Background: Amino acid substitutions in putative Gln3 α-helix(656–666) abolish Gln3-Tor1 interaction, rapamycin responsiveness, and cytoplasmic Gln3 sequestration. Are these traits inextricably linked?
Results: Substitutions throughout Gln3(510–589) uniformly abolish rapamycin responsiveness but not cytoplasmic Gln3 sequestration, nitrogen catabolite repression, or methionine sulfoximine responsiveness.
Conclusion: Gln3 possesses a domain specifically required for rapamycin responsiveness.
Significance: Greater dissection and understanding of mechanisms responsible for regulating nitrogen-responsive Gln3 localization.
Keywords: Nitrogen Metabolism, Nuclear Translocation, Signal Transduction, TOR Complex (TORC), Trafficking, Transcription Factor
Abstract
Nitrogen-responsive control of Gln3 localization is implemented through TorC1-dependent (rapamycin-responsive) and TorC1-independent (nitrogen catabolite repression-sensitive and methionine sulfoximine (Msx)-responsive) regulatory pathways. We previously demonstrated amino acid substitutions in a putative Gln3 α-helix(656–666), which are required for a two-hybrid Gln3-Tor1 interaction, also abolished rapamycin responsiveness of Gln3 localization and partially abrogated cytoplasmic Gln3 sequestration in cells cultured under nitrogen-repressive conditions. Here, we demonstrate these three characteristics are not inextricably linked together. A second distinct Gln3 region (Gln3(510–589)) is specifically required for rapamycin responsiveness of Gln3 localization, but not for cytoplasmic Gln3 sequestration under repressive growth conditions or relocation to the nucleus following Msx addition. Aspartate or alanine substitution mutations throughout this region uniformly abolish rapamycin responsiveness. Contained within this region is a sequence with a predicted propensity to form an α-helix(583–591), one side of which consists of three hydrophobic amino acids flanked by serine residues. Substitution of aspartate for even one of these serines abolishes rapamycin responsiveness and increases rapamycin resistance without affecting either of the other two Gln3 localization responses. In contrast, alanine substitutions decrease rapamycin resistance. Together, these data suggest that targets in the C-terminal portion of Gln3 required for the Gln3-Tor1 interaction, cytoplasmic Gln3 sequestration, and Gln3 responsiveness to Msx addition and growth in poor nitrogen sources are distinct from those needed for rapamycin responsiveness.
Introduction
The mechanisms through which single and multiple cell eukaryotic organisms evaluate their nitrogen requirements, appropriately sensing and responding to the intra- and extracellular supplies available to them, have proven to be unexpectedly complex (1–6). A recent example of this complexity was the discovery that the five conditions employed to down-regulate the activity of target of rapamycin complex 1 (TorC1),2 a central protein kinase complex responsible for integrating a broad array of environmental signals, in fact represented five overlapping regulatory pathways possessing distinct requirements (7).
The nitrogen-responsive GATA family transcription factors, Gln3 and Gat1, have been highly instrumental in investigations elucidating the complexity of nitrogen-responsive transcriptional regulation (4–6, 8–40). When Saccharomyces cerevisiae cells are cultured in nitrogen-replete medium, Gln3 is cytoplasmic, which in turn down-regulates the expression of genes required to transport and degrade poorly utilized nitrogen sources. Gln3 responds to the exhaustion of such luxurious growth conditions or growth in the presence of poorly used nitrogen sources by relocating to the nucleus in a Sit4 phosphatase-dependent manner and, along with Gat1, mediates the transcription of these genes (15, 24, 30, 31, 33–37). This nitrogen source-dependent regulatory response is commonly referred to as nitrogen catabolite repression (NCR) (1, 2). Treating cells with the specific TorC1 inhibitor, rapamycin, also relocates Gln3 to the nuclei of cells provided with excess nitrogen. However, this relocation requires both Sit4 and related phosphatase PP2A (35). Consistent with rapamycin-elicited nuclear Gln3 localization, Gln3 interacts with Tor1 in a two-hybrid interaction assay, and Tor1 is able to phosphorylate Gln3 in vitro (18, 23, 40). Gln3 relocation to the nucleus can also be elicited by long term nitrogen starvation or treating cells with the glutamine synthetase inhibitor, methionine sulfoximine (Msx) (22, 29, 38–40). In these two instances, however, neither Sit4 nor PP2A are required (7). The fifth condition that down-regulates TorC1 is leucine starvation as measured by the reporter Sch9 phosphorylation (41–44). However, in contrast to TorC1, Gln3 intracellular localization does not demonstrably respond to leucine starvation as observed for Sch9 (7).
These findings make a testable prediction. If the four means of eliciting nuclear relocation of Gln3 in fact represent four distinct pathways or branches of a more limited number of regulatory pathways, then one should expect to find distinct targets on the Gln3 molecule itself that individually respond to each of them. This reasoning prompted us to search for Gln3 amino acid substitutions that would specifically alter each of the above responses.
Our first successful attempt toward implementing this strategy was the discovery of a putative α-helix (Gln3(656–662)) whose loss or alteration compromised Gln3 cytoplasmic sequestration in the presence of excess nitrogen, completely eliminated rapamycin responsiveness, and most importantly, abolished the interaction of Gln3 and Tor1 (40). This putative α-helix alone (17 amino acids) was sufficient to interact with Tor1.
One interpretation of these characteristics was that TorC1 kinase activity was partially responsible for cytoplasmic Gln3 sequestration and that this portion of overall Gln3 regulation was reversed following rapamycin treatment (7). Therefore, when the Gln3-Tor1 interaction was abolished, there was no longer a Tor1-mediated event for rapamycin to reverse. This reasoning raised two questions. (i) Were the sites of Gln3-Tor1 interaction and Gln3 rapamycin responsiveness one and the same or could they be genetically separated? (ii) Was the partial loss of cytoplasmic Gln3 sequestration inextricably linked to loss of rapamycin responsiveness? The experiments described below answer these questions, and in doing so they identified a Gln3 domain, Gln3(510–589), specifically required for the response of Gln3-Myc13 localization to rapamycin treatment.
MATERIALS AND METHODS
Strains and Culture Conditions
S. cerevisiae strain JK9-3da was used as the transformation recipient for analysis of intracellular Gln3-Myc13 distribution in transformants carrying gln3 substitution mutant plasmids (Table 1). Protein interaction assays were performed in transformants of PJ69-4a and rapamycin resistance assays in transformants of KHC2. Growth conditions were identical to those described in Tate et al. (35). Cultures (50 ml) were grown to mid-log phase (A600 nm = 0.5) in YNB (without amino acids or ammonia) minimal medium containing the indicated nitrogen source at a final concentration of 0.1%. Appropriate supplements (120 μg/ml leucine and 20 μg/ml histidine and tryptophan) were added to the medium as necessary to cover auxotrophic requirements. Where indicated, cells were treated with 200 ng/ml rapamycin for 20 min or 2 mm Msx for 30 min as described earlier. For rapamycin resistance assays, the medium was solid synthetic complete (SC) with or without 50 ng/ml rapamycin.
TABLE 1.
S. cerevisiae strains used in this work
| Strain | Pertinent fenotype | Parent | Complete genotype |
|---|---|---|---|
| JK9-3da | Wild type | MATa, leu2-3,112, ura3-52, trp1, his4, rme1, HMLa | |
| PJ69-4a | Wild type transformation recipient | DGY63::171 | Mata, trp1-901, leu2-3,112, ura3-52, his3-200, gal4Δ, gal80Δ, GAL2-ADE, lys::GAL1-His3, met2::GAL7-lacZ |
| KHC2 | gln3Δ transformation recipient | TCY1a | MATa, lys2, ura3, gln3Δ::hisG |
| TCY1 | Wild type | GC210 | MATa, lys2, ura3 |
a GC210 is a spontaneously derived, isogenic derivative of Σ1278b (50).
Plasmid Construction and Protein-Protein Interaction Assays
gln3 deletion and amino acid substitution mutants were constructed using standard PCR-based methods and the primer sets in Table 2. The Myc13 and ADH1 transcriptional terminator were derived from pKA62 (29). The template for all of the constructions, unless otherwise indicated, was pRR536, which contained the wild type GLN3 gene, including its native promoter, fused in-frame with Myc13 at the GLN3 translational stop codon.
TABLE 2.
Primer sets used to construct plasmids employed in this work
Sequences *,Gln3(1631–1636), 5′-CGTCCG-3′, and **,Gln3(1761–1766), 5′-CTCCGT-3′, were changed to 5′-CGGCCG-3′ to generate a unique EagI restriction site for cloning purposes. These changes did not alter the amino acid sequence of the protein.
| Plasmids | Sequence changes | Primer sets |
|---|---|---|
| pRR536 | Gln3(1–730) (F.L. wild type) | 5′-CGCGGATCCTATACCAAATTTTAACCAATCCAATTCGTCAGCAATTGCT-3′ |
| 5′-ATCCCCGCGGGACGTCAACTCCATAGAAGTGACTTTTCCG-3′ | ||
| pRR849** | Gln3S580D,S582D,S583D,S584D,S589D | 5′-CAATCGGCCgacTTGCAACAACTGCACGAACAGCAACAAGTGGAC-3′ |
| 5′-CGCGGATCCTATACCAAATTTTAACCAATCCAATTCGTCAGCAATTGCT-3′ | ||
| 5′-CAATCGGCCGCCATAAAgtcatcgtcGTAatcTGCATTGCGCGACATCTTTCTTCTTGG-3′ | ||
| 5′-ATCCCCGCGGGACGTCAACTCCATAGAAGTGACTTTTCCG-3′ | ||
| pRR876** | Gln3S580A,S582A,S583A,S584A,S589A | 5′-CAATCGGCCGGTAcgcTGCATTGCGCGACATCTTTCTTCTTGG-3′ |
| 5′-ATCCCCGCGGGACGTCAACTCCATAGAAGTGACTTTTCCG-3′ | ||
| 5′-CAATcggccggcgTTTATGGCTGCGgctTTGCAACAACTGCACGAACAG-3′ | ||
| 5′-CGCGGATCCTATACCAAATTTTAACCAATCCAATTCGTCAGCAATTGCT-3′ | ||
| pRR924 | Gln3S544D,S545D,S550D,S552D | 5′-GTACGATGCATTGCGCGACATCTTTCTTCTTGGTATATTCATTCCTTGACGTTGGAAAGAATTTGATAATAGATTCTGCTGTAGAGGatcATTgtcGTTAAAGTTTGCgtcgtcTATAATTCTTGGTG-3′ |
| 5′-CATCCAGATCTGTTGTTCCGATATTACCAAAACC-3′ | ||
| pRR926 | Gln3S550D,S552D,S560D,S562D | 5′-GTACGATGCATTGCGCGACATCTTTCTTCTTGGTATATTCATTCCTTGACGTTGGAAatcATTatcTAATAGATTCTGCTGTAGAGGatcATTgtcGTTAAAGTTTGCGGACG-3′ |
| 5′-CATCCAGATCTGTTGTTCCGATATTACCAAAACC-3′ | ||
| pRR992 | Gln3S550A,S552A,S560A,S562A | 5′-GTACGATGCATTGCGCGACATCTTTCTTCTTGGTATATTCATTCCTTGACGTTGGAAagcATTtgcTAATAGATTCTGCTGTAGAGGagcATTtgcGTTAAAG-3′ |
| 5′-CATCCAGATCTGTTGTTCCGATATTACCAAAACC-3′ | ||
| pRR1003 | Gln3S544A,S545A,S550A,S552A | 5′-GTACGATGCATTGCGCGACATCTTTCTTCTTGGTATATTCATTCCTTGACGTTGGAAAGAATTTGATAATAGATTCTGCTGTAGAGGagcATTtgcGTTAAAGTTTGCagctgcTATAATTCTTGGTG-3′ |
| 5′-CATCCAGATCTGTTGTTCCGATATTACCAAAACC-3′ | ||
| pRR1015* | Gln3N518D,N520D,N522D,N525D | 5′-CAATCGGCCGATATAATTCTTGGTGAGGATGCGACACTATTTCCTGCACTTACATTATTTGTTGTgtcCATTAGgtcCATgtcCATgtcGAACTGCTGTGAATTAG-3′ |
| 5′-ATCCCCGCGGGACGTCAACTCCATAGAAGTGACTTTTCCG-3′ | ||
| 5′-CAATCGGCCGCAAACTTTAACTCAAATAGTCCTCTACAG-3′ | ||
| 5′-CGCGGATCCTATACCAAATTTTAACCAATCCAATTCGTCAGCAATTGCT-3′ | ||
| pRR1017* | Gln3T526A,T527A,S531A,S535A,S538A,S539A | 5′-CAATCGGCCGATATAATTCTTGGtgcggcTGCGACcgcATTTCCTGCcgcTACATTATTtgctgcGTTCATTAGGTTCATGTTC-3′ |
| 5′-ATCCCCGCGGGACGTCAACTCCATAGAAGTGACTTTTCCG-3′ | ||
| 5′-CAATCGGCCGCAAACTTTAACTCAAATAGTCCTCTACAG-3′ | ||
| 5′-CGCGGATCCTATACCAAATTTTAACCAATCCAATTCGTCAGCAATTGCT-3′ | ||
| pRR1034 | Gln3S576D | 5′-GTACGATGCATTGCGgtcCATCTTTCTTCTTGGTATATTC-3′ |
| 5′-CATCCAGATCTGTTGTTCCGATATTACCAAAACC-3′ | ||
| pRR1037 | Gln3S576A | 5′-GTACGATGCATTGCGcgcCATCTTTCTTCTTGGTATATTC-3′ |
| 5′-CATCCAGATCTGTTGTTCCGATATTACCAAAACC-3′ | ||
| pRR1045* | Gln3T526D,T527D,S531D,S535D,S538D,S539D | 5′-CAATCGGCCGCAAACTTTAACTCAAATAGTCCTCTACAG-3′ |
| 5′-CGCGGATCCTATACCAAATTTTAACCAATCCAATTCGTCAGCAATTGCT-3′ | ||
| 5′-AATCGGCCGATATAATTCTTGGtgctgcTGCGACgtcATTTCCTGCgtcTACATTATTgtcgtcGTTCATTAGGTTCATGTTC-3′ | ||
| 5′-ATCCCCGCGGGACGTCAACTCCATAGAAGTGACTTTTCCG-3′ | ||
| pRR1065 | Gln3 (1–730) | 5′-CATGCCATGGAGATGCAAGACGACCCCGAAAATTCGAAGCTG-3′ |
| 5′-CGCGGATCCTATACCAAATTTTAACCAATCCAATTCGTCAGCAATTGCT-3′ | ||
| pRR1109 | Gln3 (512–608) | 5-CATGCCATGGAGATGGCTAATTCACAGCAGTTCAACATGAACATG-3′ |
| 5′-CGCGGATCCGATTCGTGTTTGTGTTGGAATTCACGTCCACTTG-3′ (template, pRR536) | ||
| pRR1112 | Gln3 (512–608) | 5′-CATGCCATGGAGATGGCTAATTCACAGCAGTTCAACATGAACATG-3′ |
| 5′-CGCGGATCCGATTCGTGTTTGTGTTGGAATTCACGTCCACTTG-3′ (template, pRR1045) | ||
| pRR1115 | Gln3N510D,N513D,Q515D,Q516D | 5′-CATCCAGATCTGTTGTTCCGATATTACCAAAACCTTCACCTgatAGCGCTgatTCAgacgacTTCAACATGAAC-3′ |
| 5′-CGCGGATCCTATACCAAATTTTAACCAATCCAATTCGTCAGCAATTGCT-3′ | ||
| pRR1171 | Gln3N510D,N513D | 5′-TCATCCAGATCTGTTGTTCCGATATTACCAAAACCTTCACCTgatAGCGCTgatTCACAGCAGTTC-3′ |
| 5′-GTACGATGCATTGCGCGACATCTTTCTTCTTGG-3′ | ||
| pRR1190 | Gln3S583D,S584D | 5′-TCGCGCAATGCATCGTACTCCgacgacTTTATGGCTGCGTCTTTG-3′ |
| 5′-CGCGGATCCTATACCAAATTTTAACCAATCCAATTCGTCAGCAATTGCT-3′ | ||
| pRR1192 | Gln3S583A,S584A | 5′-TCGCGCAATGCATCGTACTCCgcagcgTTTATGGCTGCGTCTTTG-3′ |
| 5′-CGCGGATCCTATACCAAATTTTAACCAATCCAATTCGTCAGCAATTGCT-3′ | ||
| pRR1194 | Gln3S589D | 5′-TCGCGCAATGCATCGTACTCCTCATCGTTTATGGCTGCGgacTTGCAACAACTGCAC-3′ |
| 5′-CGCGGATCCTATACCAAATTTTAACCAATCCAATTCGTCAGCAATTGCT-3′ | ||
| pRR1196 | Gln3S589A | 5′-TCGCGCAATGCATCGTACTCCTCATCGTTTATGGCTGCGgctTTGCAACAACTGCAC-3′ |
| 5′-CGCGGATCCTATACCAAATTTTAACCAATCCAATTCGTCAGCAATTGCT-3′ | ||
| pRR1248 | Gln3 (508–730) | 5′-CATGCCATGGAGTCACCTAATAGCGCTAATTCACAGCAG-3′ |
| 5′-CGCGGATCCGTATACCAAATTTTAACCAATCCAATTCGTCAGCAATTGCT-3′ (template, pRR536) | ||
| pRR1250 | Gln3 (508–730) | 5′-CATGCCATGGAGTCACCTAATAGCGCTAATTCACAGCAG-3′ |
| 5′-CGCGGATCCGTATACCAAATTTTAACCAATCCAATTCGTCAGCAATTGCT-3′ (template, pRR850) |
Plasmid constructions and procedures for the two-hybrid interaction assays were performed as described in detail by Rai et al. (40). All of the constructs were confirmed by DNA sequencing (University of Tennessee Health Science Center Molecular Resource Center DNA Sequencing Facility).
Indirect Immunofluorescence Microscopy
Cell collection and immunofluorescent staining were performed as described previously (26, 30, 33, 35). Cells were imaged using a Zeiss Axioplan 2 imaging microscope with a 100× Plan-Apochromat 1.40 oil objective at room temperature. Images were acquired using a Zeiss Axio camera and AxioVision 3.0 and 4.8.1 (Zeiss) software and processed with Adobe Photoshop and Illustrator programs. Level settings (shadow and highlight only) were altered where necessary to avoid any change or loss in cellular detail relative to what was observed in the microscope; changes were applied uniformly to the image presented and were similar from one image to another.
Determination of Intracellular Gln3-Myc13 Distribution
A clear, comprehensive description of intracellular Gln3-Myc13 localization cannot be adequately achieved from inspecting one or two subjectively chosen images of microscopic fields containing 4–8 cells because such an image represents less than 4% of the cells we actually score. Because of the subjective nature of image selection and potential errors of interpretations based on them, we quantified intracellular Gln3-Myc13 localization by manually scoring Gln3-Myc13 localization in 200 or more cells in multiple randomly chosen fields from which each image presented was taken. Scoring was performed exclusively using unaltered, primary .zvi image files viewed with Zeiss AxioVision 3.0 and 4.8.1 software.
Cells were classified into one of three categories: cytoplasmic (cytoplasmic Gln3-Myc13 fluorescence only; red bars), nuclear-cytoplasmic (Gln3-Myc13 fluorescence appearing in the cytoplasm as well as co-localizing with DAPI-positive material, DNA; yellow bars), and nuclear (Gln3-Myc13 fluorescence co-localizing only with DAPI-positive material; green bars). A representative collection of “standard” images demonstrating the differences in these categories is shown in Fig. 2 of Ref. 35 along with a description of how the criteria were applied. The precision of our scoring has been repeatedly documented (30, 32, 36) and is specifically addressed in the latter portion of work as well. Similar experiments were repeated two or more times with similar results. Images for the accompanying histograms were chosen on the basis that they exhibited intracellular Gln3-Myc13 distributions as close as possible to those observed in the quantitative scoring data. However, identifying a field that precisely reflects the more quantitative scoring data is sometimes difficult unless Gln3 is situated in a single cellular compartment.
FIGURE 2.
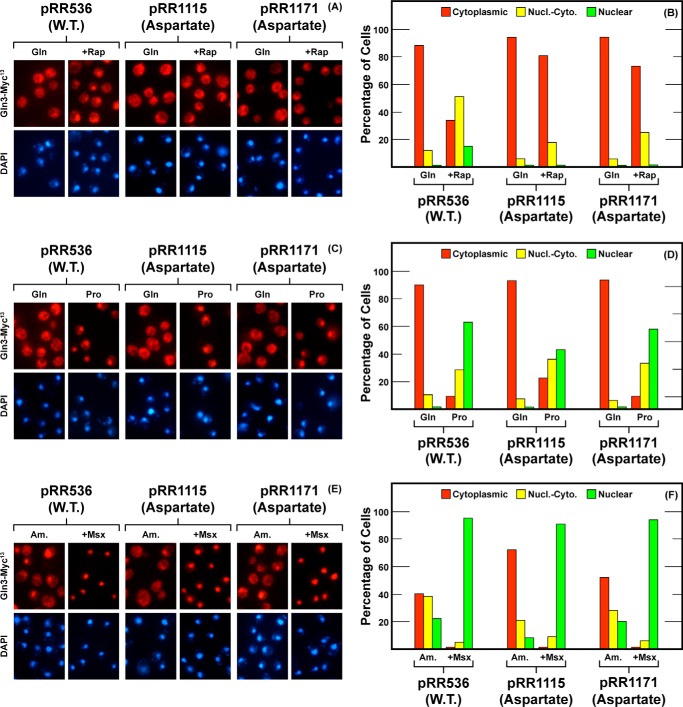
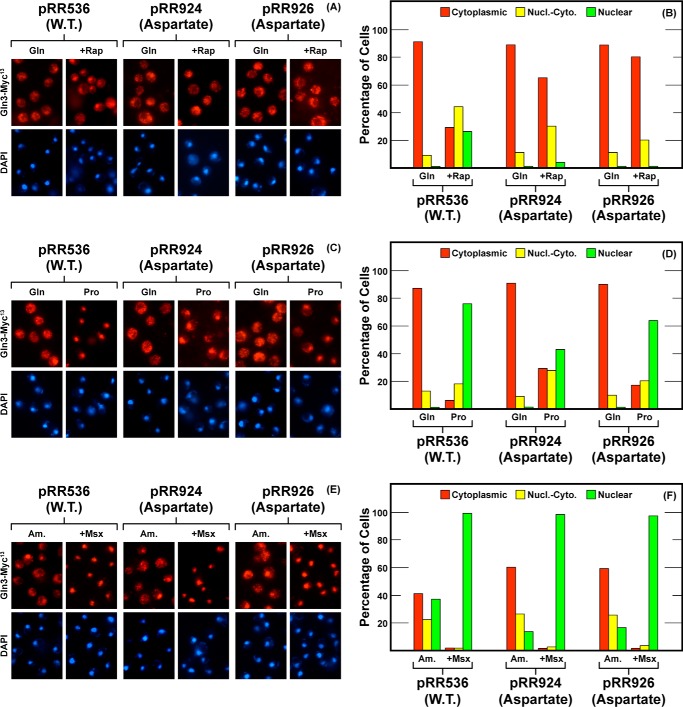
Localization of full-length Gln3(1–730)-Myc13 (pRR536), Gln3N510D,N513D,Q515D,Q516D-Myc13 (pRR1115), and Gln3N510D,N513D-Myc13 (pRR1171) in untreated glutamine-grown (Gln in A–D), proline-grown (Pro in C and D), and ammonia-grown (Am. in E and F) transformants or in those treated with rapamycin (+Rap in A and B) or Msx (+Msx in E and F). A, C, and E depict representative images from which the corresponding histograms in B, D, and F were generated. Red bars indicate Gln3-Myc13 staining in the cytoplasm only; yellow bars indicate both cytoplasmic and nuclear (Nucl.-Cyto.) staining, and green bars indicate staining in the nucleus only. The nature of the amino acid substitution(s), i.e. aspartate, alanine, or none (WT) appears below the plasmid numbers. Strain JK9-3da was the transformation recipient.
RESULTS
A previous investigation demonstrated that substitutions in a putative Gln3 α-helix(656–666) simultaneously abolished rapamycin responsiveness, Gln3-Tor1 interaction, and partially abolished cytoplasmic Gln3 sequestration under repressive growth conditions. These pleiotropic responses raised the question as to whether or not the three characteristics were inseparable and hence mechanistically linked together. To address this question, we investigated the negative hypothesis. If these characteristics were not inseparably linked, one would expect to find amino acid substitutions in Gln3 that affected them selectively. For example, substitutions might exist that eliminate nuclear Gln3 localization following rapamycin treatment, but: (i) leave Gln3 firmly sequestered in the cytoplasm of untreated cells; (ii) fail to adversely affect nuclear Gln3 localization when cells are cultured under nitrogen-derepressive conditions or following Msx treatment; and/or (iii) maintain the Gln3-Tor1 interaction. Furthermore, if a specific site for rapamycin responsiveness exists in Gln3, it might be situated in a previously uninvestigated C-terminal region of the protein because no such site has been previously reported in existing domain analyses focused on the more N-terminal regions of Gln3.
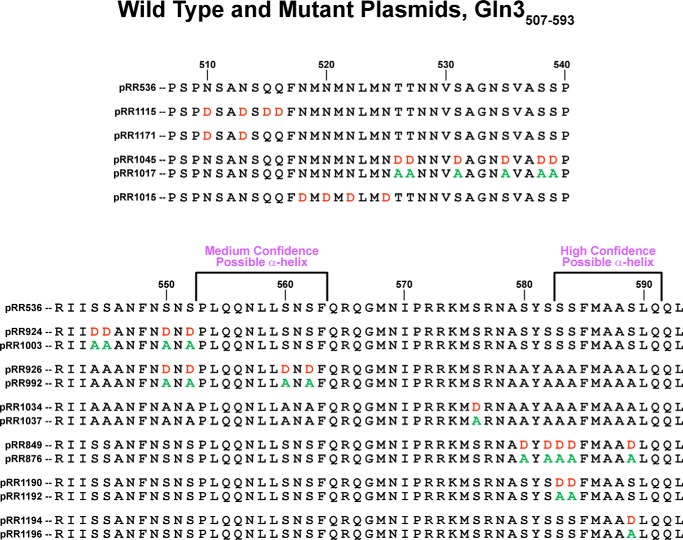
Based on this reasoning, we focused our investigation on a structured region (Gln3(510–600)) just N-terminal of the one previously investigated (Gln3(600–662)). This region contained a significant number of serine and threonine residues (25% of the total) that might serve as potential targets associated with phosphorylation and/or a rapamycin response. To investigate the region, we employed the previously successful approach (40) of constructing a series of full-length Gln3-Myc13 mutants in which phosphomimetic aspartate or unphosphorylatable alanine residues were substituted for small and closely spaced groups of serine and/or threonine residues (Fig. 1). Similar substitutions were also made in closely grouped asparagine and glutamine residues. These mutant plasmid constructs were used to transform wild type strain JK9-3da and Gln3-Myc13 intracellular localization was assessed.
FIGURE 1.
Gln3 protein sequences analyzed in this work. The wild type Gln3 sequence (pRR536) appears at the top along with coordinates, relative to the first methionine. Single or paired sequences below the wild type are those of the mutant plasmids; plasmid numbers appear beside the mutant sequence. Aspartate and alanine substitutions are indicated in red and green, respectively. All mutant plasmids contain a full-length gln3 gene driven by its native promoter. Two sequences predicted as potentially folding into α-helices are indicated.
Intracellular Gln3-Myc13 localization was classified into one of three categories (cytoplasmic, nuclear-cytoplasmic, or nuclear) as described under “Materials and Methods.” As discussed later in this work, the cumulative precision of data presented in the following figures (standard deviation about the average) ranged from 4 to 8% for experiments comparing wild type versus aspartate substitution mutant results and from 4 to 18% for experiments comparing results from wild type versus alanine substitution mutants. In each case, n = 7 experiments performed over the 3-year duration of the project. The data presented are derived from 44,802 cells scored. These levels of reproducibility are similar to those reported for earlier evaluations of our scoring procedure (30, 32, 36). A wild type, rather than gln3Δ mutant, transformation recipient was used to avoid pronounced secondary effects on multiple cellular processes known to occur in gln3 loss of function mutants.
Alteration of Gln3 Residues Abolishes Its Response To Rapamycin Treatment but Not to NCR or Msx Addition
The first mutant we analyzed substituted four aspartate residues for uncharged asparagines and glutamines at the N terminus of the 510–600 region, Gln3N510D,N513D,Q515D,Q516D-Myc13 (Fig. 1, pRR1115). These substitutions almost completely abolished rapamycin responsiveness but did not detectably compromise cytoplasmic Gln3-Myc13 sequestration (Fig. 2, A and B). In fact, there was a modest cytoplasmic shift of Gln3-Myc13 under less repressive conditions, i.e. in cells provided with ammonia or proline as sole nitrogen sources (Fig. 2, C–F). Responses to NCR (growth in proline) or Msx addition, however, were not significantly affected (Fig. 2, C–F). When a less drastic Gln3 modification was made in which only the first two asparagines were substituted (pRR1171), rapamycin responsiveness was again almost completely abolished (Fig. 2, A and B), but now without a detectable effect on Gln3-Myc13 localization in either less repressive or Msx-treated media; here the nitrogen source-responsive localization was essentially wild type (Fig. 2, C–F).
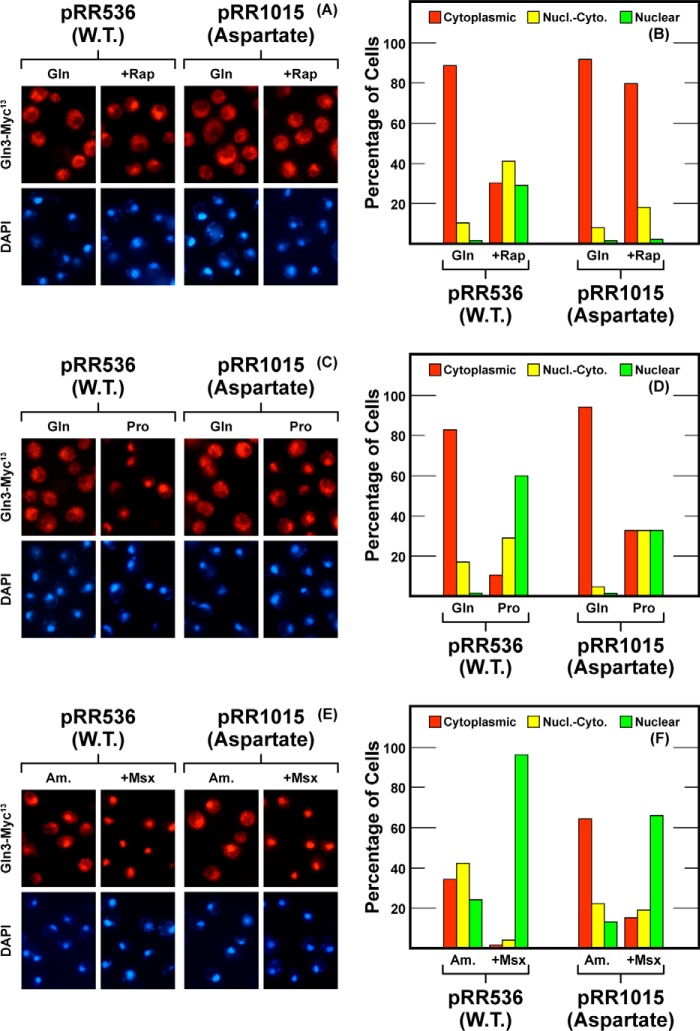
This region was followed by three methionine-asparagine repeats, Gln3(519–525). Here, we replaced each of the four asparagine residues with aspartates, Gln3N518D,N520D,N522D,N525D-Myc13 (pRR1015), thereby introducing four negative charges. These substitutions abolished the rapamycin responsiveness of Gln3-Myc13 localization (Fig. 3, A and B). They also modestly diminished Gln3-Myc13 relocation to the nuclei of proline- or ammonia-grown cells (Fig. 3, C–F). There was even a slight but detectable effect on Msx-elicited nuclear Gln3-Myc13 localization. However, the overall response to derepressive conditions (proline medium) and especially to Msx addition still occurred much as with wild type. Only the degree of the response was modestly diminished.
FIGURE 3.
Localization of full-length Gln3(1–730)-Myc13 (pRR536) and Gln3N518D,N520D,N522D,N525D-Myc13 (pRR1015). Experimental format and presentation of the data are the same as in Fig. 2. Nucl.-Cyto., cytoplasmic and nuclear.
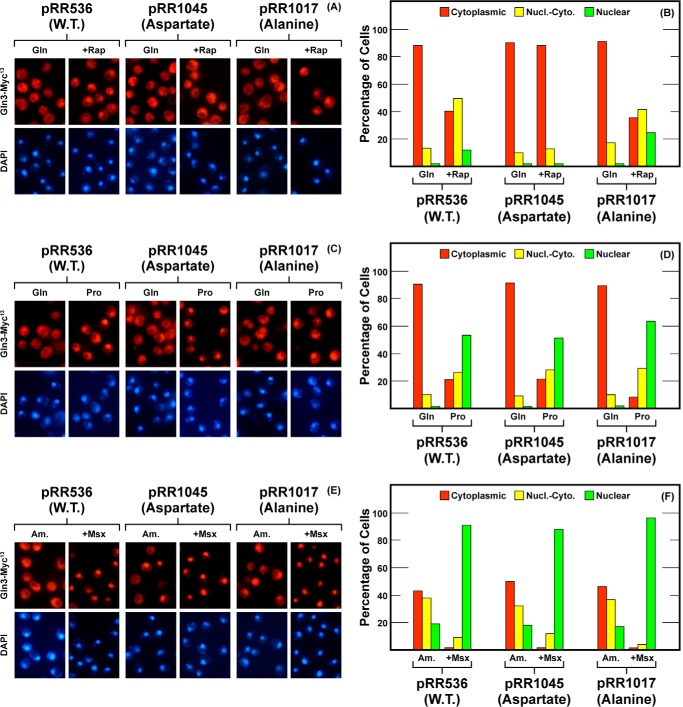
The above region was followed by one rich in serine/threonine residues. Here, we substituted aspartate or alanine for five residues, Gln3T526D,T527D,S531D,S535D,S538D,S539D, (pRR1045) and Gln3T526A,T527A,S531A,S535A,S538A,S539A, (pRR1017), respectively. The aspartate substitutions in this region completely abolished rapamycin responsiveness of the mutant protein without detectably affecting Gln3-Myc13 localization in ammonia or proline media or in response to Msx treatment (Fig. 4, A–F, pRR1045). Substitution of alanine for the serine/threonine residues elicited little if any nuclear shift of Gln3 in rapamycin-treated, glutamine- ammonia- and proline-grown cells, but no effect whatsoever in the case of Msx addition (Fig. 4, A–F, pRR1017). Overall, however, the effects of the above substitutions were again drastic on rapamycin responsiveness, but largely marginal on NCR-sensitive and Msx-elicited Gln3 localization.
FIGURE 4.
Localization of full-length Gln3(1–730)-Myc13 (pRR536), Gln3T526D,T527D,S531D,S535D,S538D,S539D-Myc13 (pRR1045) and Gln3525A,T527A,S531A,S535A,S538A,S539A-Myc13 (pRR1017). Experimental format and presentation of the data are the same as in Fig. 2. Nucl.-Cyto., cytoplasmic and nuclear; Rap, rapamycin.
Encouraged by the above results, we moved on to the region between Gln(544–562) which contained six serine residues (Fig. 1). When aspartate was substituted for the first four, Gln3S544D,S545D,S550D,S552D-Myc13 (pRR924) or last four, Gln3S550D,S552D,S560D,S562D-Myc13 (pRR926) residues, again rapamycin responsiveness was essentially abolished. The last four substitutions exhibited a slightly tighter phenotype (Fig. 5, A and B, pRR926). Again, there was a modest cytoplasmic shift of Gln3-Myc13 localization in proline-grown cells when the first four serines were substituted (Fig. 5, C and D). These modest effects did not recur, however, when the last four serines were replaced with aspartate in both of these substitutions. Moreover, the overall NCR-sensitive response (glutamine versus proline media) remained intact. The response to Msx treatment was also wild type, i.e. Gln3-Myc13 re-localized to the nuclei of all of the treated cells (Fig. 4, C–F).
FIGURE 5.
Localization of full-length Gln3(1–730)-Myc13 (pRR536), Gln3S544D,S545D,S550D,S552D-Myc13 (pRR924) and Gln3S550D,S552D,S560D,S562D-Myc13 (pRR926). Experimental format and presentation of the data are the same as in Fig. 2. Nucl.-Cyto., cytoplasmic and nuclear; Rap, rapamycin.
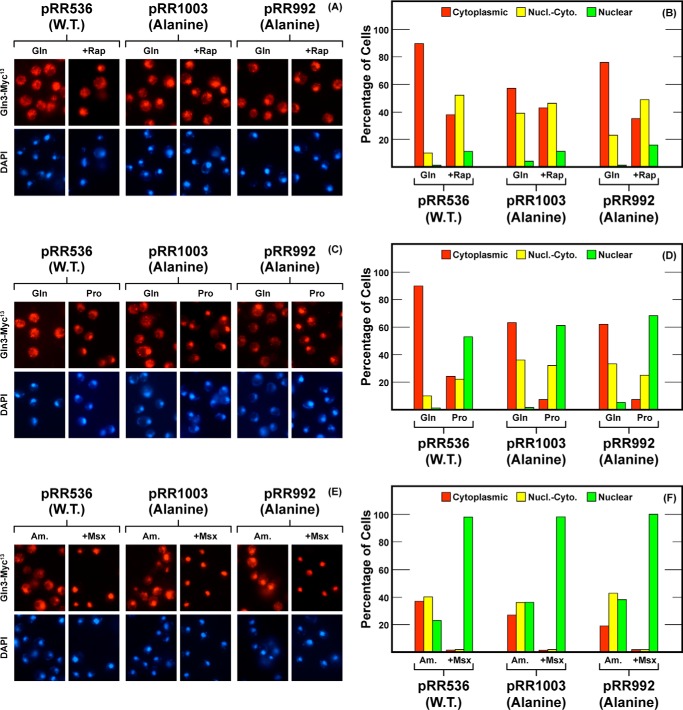
In contrast, alanine substitutions, Gln3S544A,S545A,S550A,S552A-Myc13 (pRR1003), had little if any effect on the rapamycin responsiveness, NCR-sensitivity, or Msx responsiveness of Gln3-Myc13 localization (Fig. 6). The most clearly demonstrated effect here was a moderate decrease in cytoplasmic Gln3-Myc13 sequestration in glutamine-grown cells. The phenotypes of these substitutions were somewhat similar to those observed when the Gln3-Tor1 interaction was abolished (40). However, when alanine was substituted for the last four serines, the localization profile of Gln3S550A,S552A,S560A,S562A-Myc13 (pRR992) differed little from wild type cells provided with either proline or ammonia as sole nitrogen source Fig. 6, C–F).
FIGURE 6.
Localization of full-length Gln3(1–730)-Myc13 (pRR536), Gln3S544A,S545A,S550A,S552A-Myc13 (pRR1003) and Gln3S550A,S552A,S560A,S562A-Myc13 (pRR992). Experimental format and presentation of the data are the same as in Fig. 2. Nucl.-Cyto., cytoplasmic and nuclear; Rap, rapamycin.
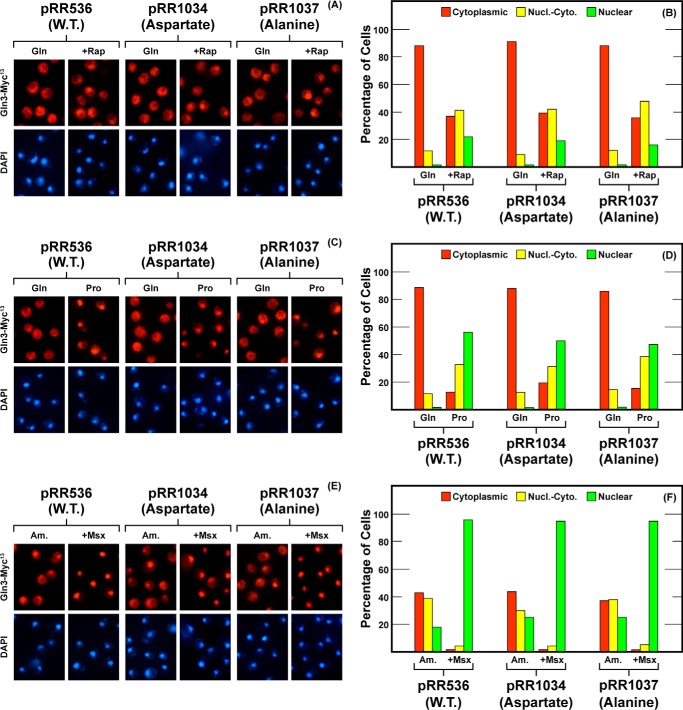
In contrast to the other substitution mutants discussed so far, strains harboring Gln3S576D-Myc13 (pRR1034) or Gln3S576A-Myc13 (pRR1037) were indistinguishable from wild type (Fig. 7). The lack of a demonstrable phenotype occurred despite the fact that an acidic amino acid had been introduced into a largely basic region (pRR1034).
FIGURE 7.
Localization of full-length Gln3(1–730)-Myc13 (pRR536), Gln3S576D-Myc13 (pRR1034), and Gln3S576A-Myc13 (pRR1037). Experimental format and presentation of the data are the same as in Fig. 2. Nucl.-Cyto., cytoplasmic and nuclear; Rap, rapamycin.
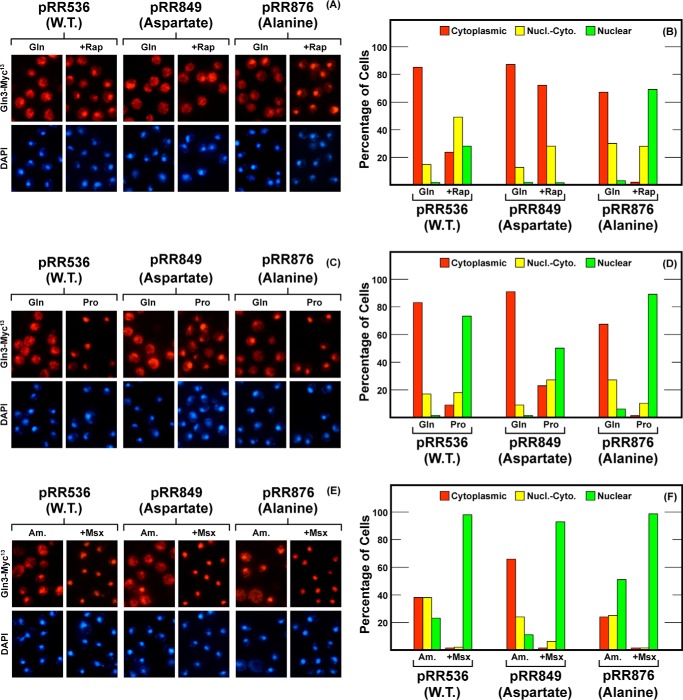
The next region we investigated was that between Gln3 residues 580 and 589 (Fig. 8). The serine to aspartate substitutions in this region, Gln3S580D,S582D,S583D,S584D,S589D-Myc13 (pRR849) resulted in a phenotype quite similar to the one seen with pRR1045 (compare Figs. 8 with 4). The rapamycin response was eliminated; there was a modest to moderate cytoplasmic shift in proline- and ammonia-grown cells, and the Msx-elicited response remained fully intact (Fig. 8, A–F). However, there was a marked effect of the alanine substitutions, Gln3S580A,S582A,S583A,S584A,S589A-Myc13 (pRR876, Fig. 8, A and B). Gln3-Myc13 was more responsive to rapamycin treatment than observed with earlier mutants and even relative to wild type. It exhibited a localization profile similar to that observed in proline-grown cells. Otherwise, the phenotypic characteristics of this mutant were largely wild type (Fig. 8, C–F).
FIGURE 8.
Localization of full-length Gln3(1–730)-Myc13 (pRR536), Gln3S580D,S582D,S583D,S584D,S589D-Myc13 (pRR849) and Gln3S580A,S582A,S583A,S584A,S589A-Myc13 (pRR876). Experimental format and presentation of the data are the same as in Fig. 2. Nucl.-Cyto., cytoplasmic and nuclear; Rap, rapamycin.
A Short, Potential α-Helix Is Required for a Gln3 Response to Rapamycin Treatment
When considered cumulatively, the phenotypes of all but two of the substitution mutants (pRR876 and pRR1037) supported the contention that Gln3 residues 510–589 were critical to rapamycin responsiveness, whereas nitrogen source responsiveness remained largely to completely intact as did a response to Msx treatment. Influenced by our previously reported finding of a putative α-helix associated with the Gln3-Tor1 interaction (40), we queried whether the presently studied region contained any predictable secondary structures. To this end, we analyzed the Gln3(510–589) region with programs that predict peptide secondary structures, including the one employed to identify the Tor1-interacting residues with a predicted propensity of folding into an α-helix (45, 46). Two candidate regions were flagged, Gln3(583–591), and Gln3(553–563). The first peptide sequence was predicted at a high level of confidence to possess a propensity for forming an α-helix, whereas the second one was predicted with only a medium level of confidence (Fig. 1). Not too surprisingly, the first sequence was highly conserved among 12 related yeast species, whereas the second one was conserved in only six (Fig. 9, A and C). Finally, secondary structure prediction programs uniformly identified the first sequence (Gln3(583–591)) as having helical potential, whereas one of the programs identified only the center portion of the second sequence (Gln3(553–563)) as being potentially helical. Although none of the above predictions can be considered as more than speculation, they did identify interesting correlations for further investigation.
FIGURE 9.
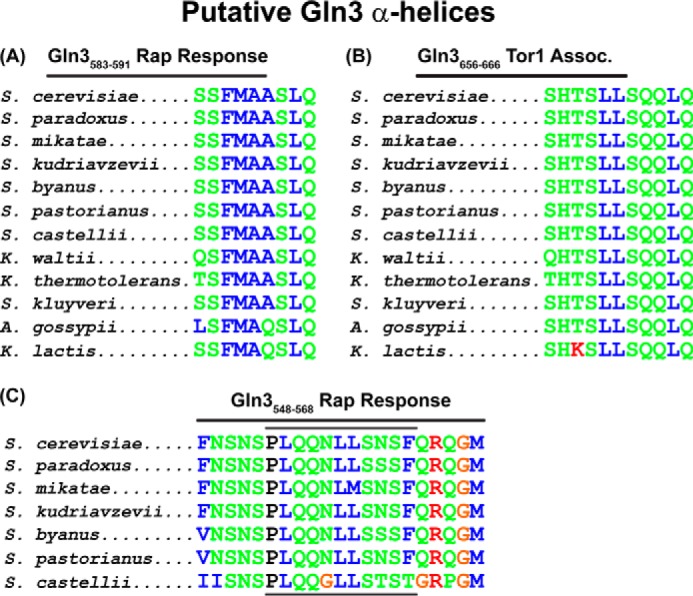
Gln3 homologies observed among yeast species for sequences required for a response to rapamycin. These sequences are also predicted to possess a propensity to form α-helices (A and C, Gln3(583–591) and Gln3(553–565); bracketed in Fig. 1) or the Gln3-Tor1 interaction (Gln3(656–666)) (B, Gln3(656–666)). Green and blue amino acid designations indicate polar and hydrophobic amino acids, respectively. Rap, rapamycin.
In this regard, we noted another interesting characteristic of the above two sequences flagged beyond their potential for secondary structure. They consisted of a central hydrophobic region flanked on either side by polar regions (Fig. 9, A and C, blue and green residues, respectively). A nearly identical organization was observed among the highly conserved Gln3(656–666) region previously demonstrated to interact with Tor1 (Fig. 9B). Therefore, we modeled the secondary structures of the three regions (Gln3(580–594), Gln3(548–569), and Gln3(656–670)) using PEP-FOLD and PHYRE2 and visualized the most likely three-dimensional structure with PyMOL legacy version 0.99 (47–49). As shown in Fig. 10, images A, B, F, G, J, and K, the hydrophobic Gln3 residues (red spheres) of the three sequences were situated on one side of putative helices, whereas the polar ones (green ribbons) were situated on the other. Additionally, one serine residue was situated in the middle of the hydrophobic face of the putative Gln3(583–591) α-helix (Fig. 10, images C and D, blue spheres). If this putative structure was at all meaningful, substituting aspartate for this serine, Gln3S589, should generate a detectable phenotype.
FIGURE 10.
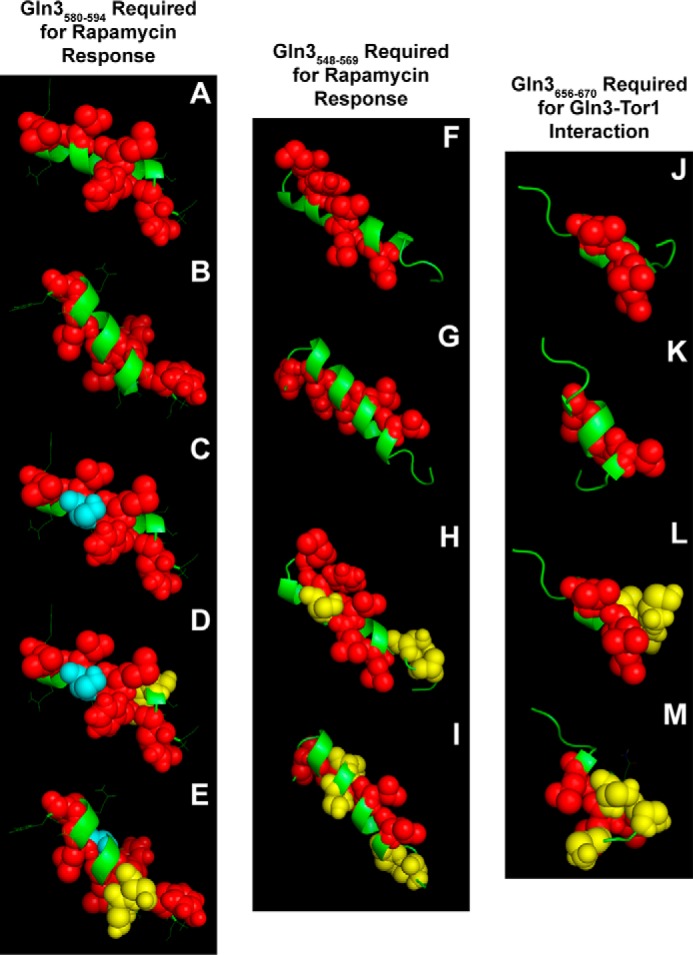
Best estimate structure models of Gln3 sequences with predicted propensities of folding into α-helices. Images A–E (Gln3(580–594)) and F–I (Gln3(548–569)) are required for a response to rapamycin, and images J–M (Gln3(656–670)) are required for a Gln3-Tor1 interaction (40). Red spheres and green ribbons indicate hydrophobic and polar amino acids, respectively. Blue spheres in images C–E indicate the serine residue that was substituted with aspartate or alanine in pRR1194 and pRR1196, respectively. Yellow spheres in images D and E indicate the serine residues that were substituted with aspartate or alanine in pRR1190 and pRR1192, respectively. Yellow spheres in images H and I indicate the serine residues that were substituted with aspartate or alanine in pRR926 and pRR992, and those in images L and M were the residues substituted in pRR850 and pRR1038, respectively (40). Images A, C, D, F, H, J, and L depict one side of the putative helices, and images B, E, G, I, K, and M depict the other side. The models were generated with PEP-FOLD and PHYRE2 and visualized with PyMOL.
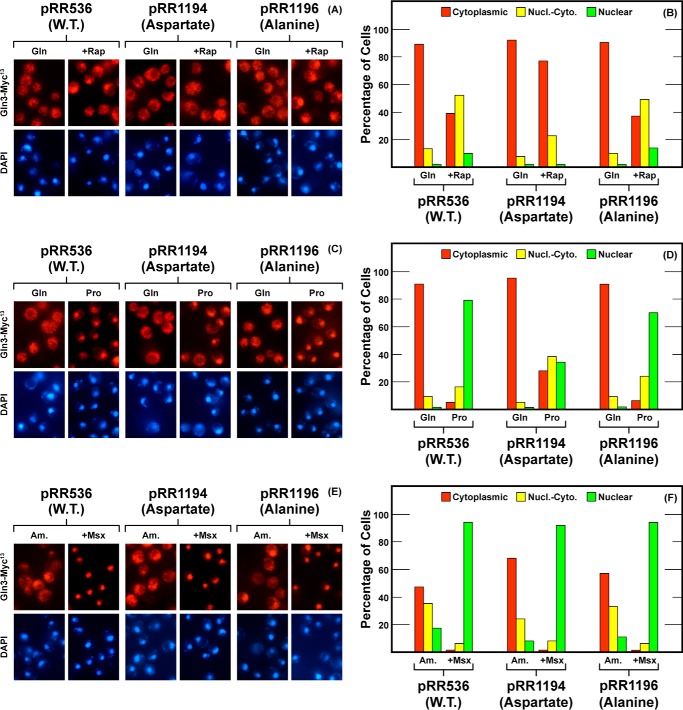
We tested this expectation by constructing Gln3S589D-Myc13 (pRR1194) and Gln3S589A-Myc13 (pRR1196). Rapamycin responsiveness of Gln3-Myc13 localization was almost completely abolished by the aspartate substitution (pRR1194) (Fig. 11, A and B), i.e. to the same degree as in the more extensively mutated pRR849 (Fig. 8). When alanine was substituted for Gln3 serine 589 (pRR1196), the rapamycin response was wild type. There was a modest decrease in nuclear Gln3-Myc13 localization relative to wild type when the aspartate but not the alanine substitution mutant was grown in proline (Fig. 11, C and D). The response to Msx was wild type for both substitutions (Fig. 11, E and F).
FIGURE 11.
Localization of full-length Gln3(1–730)-Myc13 (pRR536), Gln3S589D-Myc13 (pRR1194), and Gln3S589A-Myc13 (pRR1196). Experimental format and presentation of the data were the same as in Fig. 2. Nucl.-Cyto., cytoplasmic and nuclear; Rap, rapamycin.
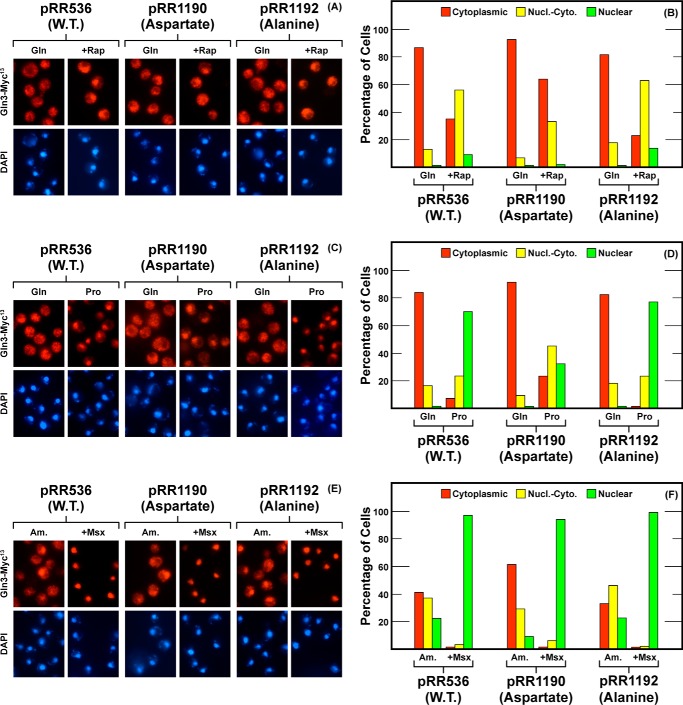
We then turned our attention to serines 583 and 584 situated at the other end of the putative α-helix (Fig. 10, images D and E, yellow spheres). Aspartates or alanines were substituted for these serines, Gln3S583D,S584D-Myc13 (pRR1190) and Gln3S583A,S584A-Myc13 (pRR1192), respectively. Aspartate substitutions resulted in a loss of rapamycin responsiveness somewhat less strongly than had occurred with pRR849 or pRR1194 (Fig. 12, A and B). In contrast, the cytoplasmic shift of Gln3-Myc13 in a proline-grown transformant containing pRR1192 was about the same as that with pRR1196 and wild type (Fig. 12, C and D). The Msx response was again totally untouched (Fig. 12, E and F). Largely wild type phenotypes were observed for all three conditions with alanine substitutions in pRR1192 (Fig. 10).
FIGURE 12.
Localization of full-length Gln3(1–730)-Myc13 (pRR536), Gln3S583D, S584D-Myc13 (pRR1090), and Gln3S583A, S584A-Myc13 (pRR1092). Experimental format and presentation of the data were the same as in Fig. 2. Nucl.-Cyto., cytoplasmic and nuclear; Rap, rapamycin.
The second Gln3 sequence, Gln3(553–563), predicted with only medium confidence to possess a propensity for folding into an α-helix, had been mutated earlier (Fig. 5, pRR924 and pRR926). It is worthy of note that Gln3S550D,S552D,S560D,S562D-Myc13 (pRR926), which exhibited the strongest and most specific phenotype of the two plasmids investigating the Gln3(544–562) region, was the one in which one of the substituted serine residues was situated in the middle of the hydrophobic face of the putative Gln3(553–563) α-helix uniformly identified by the secondary structure prediction programs as having a propensity to fold into an α-helix. Analogous observations have been previously reported for serine substitutions in the Tor1-interacting putative Gln3(656–666) α-helix (Fig. 10, images L and M, yellow spheres) (40).
Aspartate Substitutions in Gln3 Region 510–600 Increase Rapamycin Resistance, whereas Alanine Substitutions Decrease It
Gln3 substitution mutants described above generated three correlations as follows: (i) a Gln3 region predominantly required for rapamycin responsiveness, but not NCR-sensitive or Msx-elicited nuclear Gln3-Myc13 localization, was situated between residues 510 and 589; (ii) aspartate substitutions led to decreased nuclear Gln3-Myc13 localization, whereas alanine substitutions either had little effect or modestly increased it; and (iii) the Gln3-Myc13 localization phenotypes of aspartate versus alanine substitutions in the 510–589 region differed from those in the 656–666 region required for interaction with Tor1 (40).
These correlations generated three testable predictions based on previously reported results from several laboratories that a ure2Δ, in which Gln3 is constitutively nuclear, is hypersensitive to rapamycin, and a gln3Δ, in which Gln3 is not nuclear, being absent from the cell, is resistant to rapamycin (15, 16, 18, 23, 40). First, resistance to rapamycin should increase when aspartate substitution mutant plasmids were introduced into a gln3Δ (KHC2) recipient and decrease or remain unchanged when alanine substitution plasmids were similarly used for the transformation. Second, the rapamycin resistance phenotypes of substitutions in Gln3(510–589) should differ from those in Gln3(656–666). To test this prediction, we determined the resistance of all of our substitution mutants along with several gln3 mutants previously used to identify the Tor1-Gln3(656–666) interaction (40).
In previously studied mutants in which the Gln3-Tor1 interaction was lost (Gln3(1–600) (pRR614), Gln3S656D,S659D,S662D-Myc13 (pRR850), and Gln3S656A,S659A,S662A-Myc13 (pRR1038)), rapamycin sensitivity was just slightly greater than wild type (pRR536) irrespective of whether the mutant was a deletion, aspartate, or alanine substitution (Fig. 13, pRR536, pRR614, pRR850, pRR1038). This positively correlated with the fact that nuclear Gln3-Myc13 localization in all three mutants is modestly and uniformly greater than in wild type. In contrast, all but two of the mutant plasmids (pRR1034 and pRR1037) constructed in this work in which aspartates were substituted for Gln3 serine, threonine, asparagine, or glutamine residues (Fig. 13, column to the right of the images, S>D, T>D, Q>D, N>D), rapamycin resistance increased relative to wild type. Alanine substitutions, however, either increased rapamycin sensitivity or failed to alter it (Fig. 13). In other words, aspartate and alanine substitutions yielded different phenotypes in these mutants rather than the uniform phenotypes observed with pRR614, pRR850 and pRR1038. There was, as noted above, one instance in which neither aspartate nor alanine substitution altered rapamycin resistance relative to wild type, i.e. in pRR1034 and pRR1037. Correlating with the lack of altered rapamycin resistance, Gln3-Myc13 localization in these mutants similarly failed to differ from that of wild type under all conditions assayed (Fig. 7). These results supported conclusions reached from measurements of Gln3-Myc13 localization in the aspartate and alanine substitution mutants.
FIGURE 13.
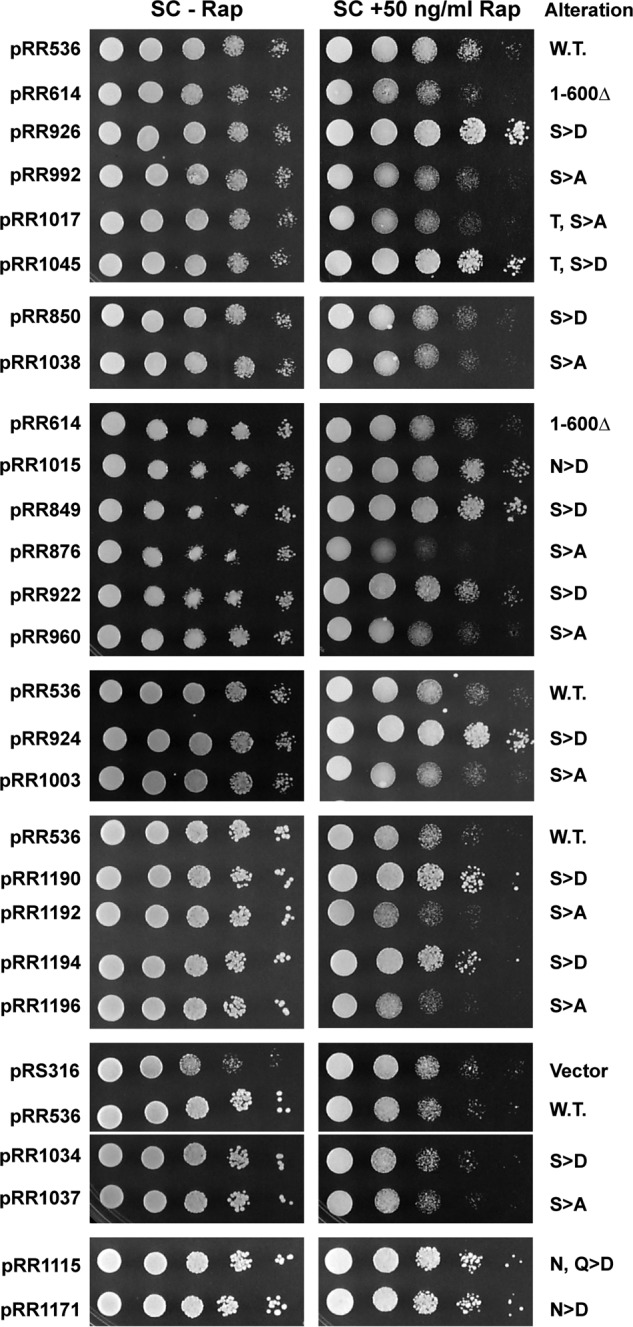
Rapamycin sensitivity or resistance of Gln3 mutant proteins. Serial dilutions (1:10) were made of gln3Δ (KHC2) transformants containing the plasmids listed on the left side of the figure. All transformants were grown on SC medium without uracil. Control plates devoid of rapamycin (left column of images) were photographed after about 3 days of incubation at 30 °C, whereas those containing 50 ng/ml rapamycin (right column of images) were incubated for about 5 days. The pertinent genotype or types of substitutions made in the mutant proteins are listed to the right of the images. W.T. indicates wild type, and vector indicates a vector-negative control that is devoid of Gln3. The panels depict individual plates. The presence of some strains (e.g. pRR536 or pRR614) in more than one panel permits comparisons between plates. A fine white line between two panels indicates that the two panels came from different locations on the same plate. Detailed descriptions of some mutants used in this experiment appear in a previous paper (40). They are pRR614 (Gln3(1–600)-Myc13), pRR850 (Gln3S656D,S659D,S662D-Myc13), pRR1038 (Gln3S656A,S659A,S662A-Myc13), pRR922 (Gln3S616D,S617D,S619D,S621D,S624D,S631D-Myc13), and pRR960 (Gln3S616A,S617A,S619A,S621A,S624A,S631A-Myc13).
There were three additional observations of note in this experiment. First, three of the alanine substitutions mutants were noticeably more sensitive to rapamycin than the rest of the mutants. Importantly, they were those located in the Gln3(580–589) region, which is the one with a predicted propensity of folding into an α-helix (Fig. 13, pRR876, pRR1192, and pRR1196). Second, substitutions in plasmids pRR1034 and pRR1037 yielded wild type Gln3-Myc13 localization phenotypes and similar rapamycin sensitivities as the strains transformed with a wild type (pRR536) or vector (pRS316) plasmids. All of the plasmids assayed, save vector plasmid pRS316, were able to support wild type growth of the gln3Δ transformation recipient on the SC medium (Fig. 13, left-hand SC-Rap column); note that the untreated SC plates were photographed 2 days earlier than those treated with rapamycin. This observation indicated that Gln3 remained sufficiently functional in all of the substitution mutants we assayed to wild type growth in this relatively rich medium.
Substitutions Throughout Gln3(510–600) Generate a Uniformly Specific Loss of Rapamycin Responsiveness
As analysis of the above gln3 mutants proceeded, we were struck by the qualitative similarity of their phenotypes. This raised the possibility they were situated in a single domain predominantly affecting a single structure or function associated with rapamycin sensitivity and prompted the following two questions. How objectively similar were the mutant phenotypes? How specifically were their effects focused on rapamycin responsiveness relative to NCR and Msx responsiveness?
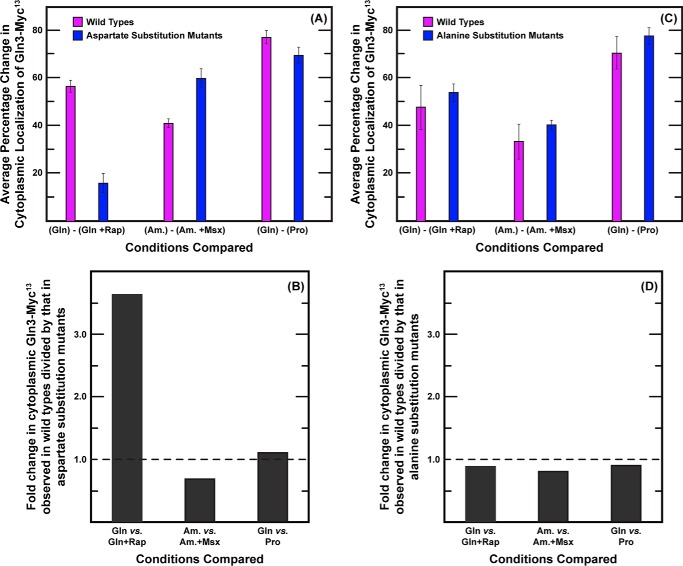
We reasoned that if the same structure or function was abolished in each of the above mutants, then the intracellular Gln3 distributions obtained with them individually could be conceptually considered as being derived from duplicate assays for the loss of that structure or function. In other words, the degree of variation observed in the cumulative data set generated by all of these mutants would objectively define the extent of their phenotypic similarity. Therefore, we calculated the following: (i) the average change (glutamine, minus versus plus rapamycin) in the fraction of wild type versus mutant cells in which Gln3-Myc13 was cytoplasmic, and (ii) the standard deviation observed among these changes. We chose to analyze cytoplasmic Gln3 localization in this analysis because it represented a single cellular compartment for which Gln3 localization could be unequivocally scored.
Addition of rapamycin to glutamine-grown wild type cells resulted in a large average change (decrease) in cytoplasmic Gln3-Myc13 in each of the seven cultures making up the data set (Fig. 14A, purple bar (Gln) − (Gln + Rap)). Similarly large changes were observed when the NCR and Msx responsiveness of these wild type cells were evaluated (Fig. 14A, purple bars, (Gln) − (Pro) or (Am) − (Am. + Msx)). The standard deviations observed for all of these changes ranged between 4 and 6% (Fig. 14A, black error bars). The seven individual data points for each of the above conditions indeed represented duplicate assays because they were derived from five different wild type isolates (collected over a 3-year period). When analogous calculations were performed using data from the nine aspartate substitution mutants (Fig. 14A, blue bars), a similarly small variation in the data was observed; the standard deviation ranged between 7 and 8% for glutamine ± rapamycin, glutamine versus proline, and ammonia ± Msx. Together, these results argued there was no more variation among the responses of the various mutant strains to each of the three conditions tested than there was among multiple assays of a single wild type. This supported our contention that the aspartate substitution mutant phenotypes were objectively very similar.
FIGURE 14.
Variation in the Gln3-Myc13 intracellular distribution profiles observed with nine aspartate (A) or nine alanine (C) substitution mutants exhibited the standard deviation as observed in nine wild type controls performed in parallel with them. The effects of aspartate substitutions were specific to rapamycin treatment (B), whereas alanine substitutions (D) yielded phenotypes identical to wild type. A value of 1.0 in B and D is indicative of no demonstrable effect of the mutations. The main text describes how these analyses were performed. The experiments from which these data were obtained were performed over a period of 3 years.
We next compared wild type versus gln3 mutant responses to the three conditions assayed. Rapamycin responsiveness was greatly diminished in the aspartate substitution mutants (Fig. 14A, purple versus blue bars). In contrast, NCR and Msx responsiveness in the aspartate substitution mutants was not strikingly different from that in the wild type. To quantify this comparison, we calculated the ratio of the fold changes in cytoplasmic Gln3-Myc13 localization observed for wild type cells divided by that in the aspartate substitution mutants. Lack of a response in the mutant strains would result in a ratio of 1.0. As shown in Fig. 14B, aspartate substitutions resulted in greater than a 3.5-fold change in the rapamycin responsiveness of cytoplasmic Gln3-Myc13 localization, whereas analogous NCR and Msx responsiveness was close to 1. This comparison supported our second contention that aspartate substitutions specifically affected the rapamycin response largely to the exclusion of the other two conditions assayed.
When a parallel statistical analysis of results obtained with the alanine substitution mutants was performed, a modestly larger amount of variation was observed, standard deviation ranging from 13 to 18% for wild type and 4 to 7% for the mutants (Fig. 14C). However, the conclusion remained qualitatively the same as with the aspartate substitutions, i.e. the amount of variation among data from the individual substitution mutants was similar to or better than that observed among multiple wild type assays. In contrast with the aspartate substitution assays, however, there was no demonstrable change in the rapamycin response elicited by the alanine substitutions (Fig 14D). The ratios of changes in wild type versus mutant strains for all three conditions tested were close to 1, indicating that the alanine substitutions had no great effects on rapamycin, NCR, or Msx responsiveness.
We additionally performed analyses, analogous to those described above, for exclusively nuclear Gln3-Myc13 localization. The standard deviations observed among the data from wild type and mutant cells were similar to those described above for the alanine substitution mutants. Importantly, however, the conclusions were identical to those just described (data not shown). We did not perform the analysis for cells in which Gln3-Myc13 was scored as nuclear-cytoplasmic, because scoring cells in this category required subjective evaluation of the microscopic images.
Gln3(512–608) Does Not Demonstrably Interact With Tor1
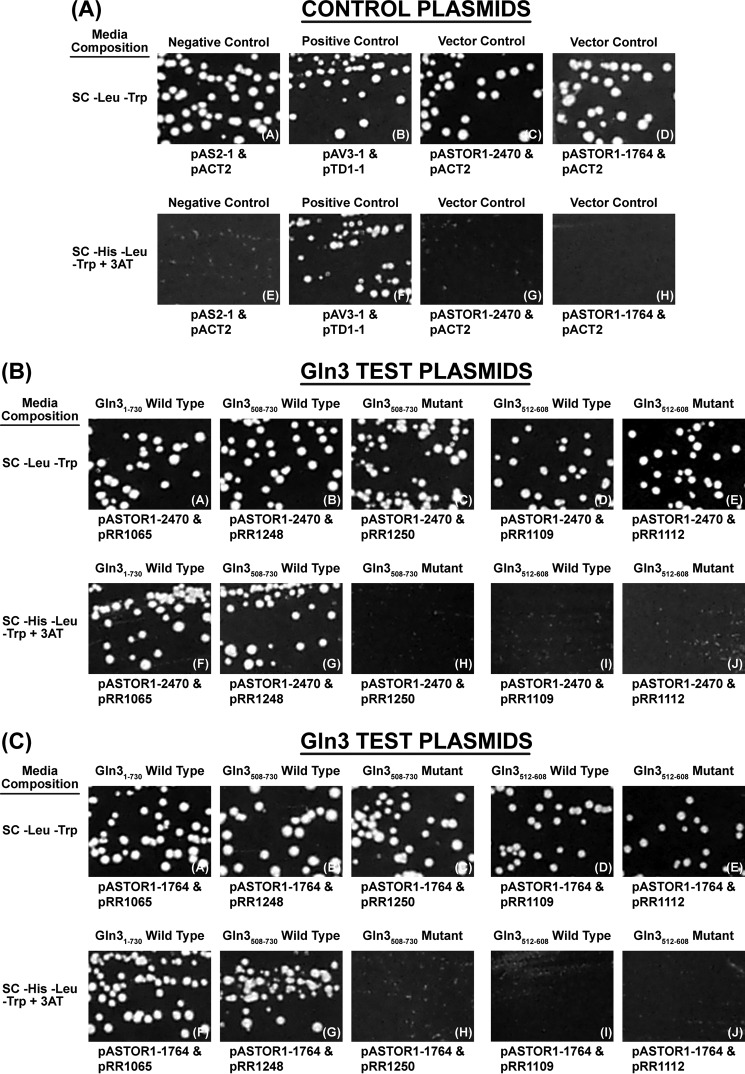
The final question we investigated was whether or not Gln3(512–608) interacted with Tor1 as occurred with Gln3(656–666), the third characteristic of the mutants studied earlier (40). To this end, we cloned wild type Gln3(512–608) and Gln3(512–606)T526D,T527D,S531D,S535D,S538D,S539D mutant peptide into the same two-hybrid vectors used to initially demonstrate the Tor1-Gln3 interaction. We could demonstrate no interaction between Tor1 and the Gln3(512–608) peptide (Fig. 15B, panels D, E, I, and J and Fig. 15C, panels D, E, I, and J). One possible explanation for this negative result may have been that Gln3 residues between 600 and 656 were also required, along with those between Gln3(512–608), to achieve a productive interaction. Therefore, we assayed interaction of Tor1 with a wild type Gln3(508–730) peptide and the same peptide containing Gln3S656D,S659D,S662D substitutions in the previously documented Tor1-Gln3(656–666) putative α-helix interaction (40). The wild type Gln3(508–730) peptide interacted with Tor1 the same as did full-length Gln3(1–730) (Fig. 15B, panels F and G, and C). However, alteration of the Gln3(656–666) putative α-helix abolished the Tor1-Gln3(508–730) interaction with both full-lengthTor1(1–2470) (Fig. 15B, panel H) and a Tor1(1–1764) peptide (Fig. 15C, panel H). As such, we were unable to demonstrate any Tor1 interaction other than the one previously reported to occur with Gln3(656–666).
FIGURE 15.
Two-hybrid assessment of Tor1 association with full-length Gln3(1–730) (pRR1065), Gln3(508–730) (pRR1248), and Gln3(508–730)S656D,S659D,S662D (pRR1250). The assays were performed as described under “Materials and Methods.” The transformation recipient in all cases was strain PJ69-4a. The positive control was constructed by sequentially transforming PJ69-4a with pAV3-1 and pTD1-1. The negative control was a transformant containing pASTOR1-2470 or pASTOR1-1764 (Gal4 DNA binding domain-Tor1 fusion) and pACT2 (corresponding empty vector). pRR1065, pRR1248, and pRR1252 consisted of the Gal4 activation domain fused N-terminal of the respective gln3 genes. Viability and the test for a two-hybrid association of the transformants were determined by streaking them on the same medium in the presence and absence of 3 mm 3′-aminotriazole (3AT). Plates were incubated 78 h. The procedures, strain, fusion vectors, and control plasmids were those used by Carvalho and Zheng (23).
DISCUSSION
Results presented in this work identify a specific region of Gln3, Gln3(510–589), required for rapamycin-elicited nuclear Gln3 localization. Twenty six amino acid substitutions (in nine mutants) across this previously uninvestigated region of Gln3 uniformly abolished the rapamycin response (Fig. 1). In fact, the standard deviation observed when comparing the nine mutant Gln3 localization profiles was similar to that obtained for parallel assays of seven independent wild type isolates (Fig. 14, A and C). Most important, the mutant phenotypes were quite specific to the rapamycin response (Fig. 14, B and D). They did not significantly affect responses of Gln3-Myc13 localization to a poor nitrogen source (NCR) or Msx treatment. Furthermore, this Gln3 region neither interacted with Tor1 (Fig. 15) nor was it required for Gln3-Tor1 interaction (40). Indeed, previously studied gln3 mutants, in which interaction with Tor1 was lost (pRR614, pRR850, and pRR1038) (40), exhibited Gln3 localization and rapamycin resistance profiles that differed from those in the Gln3(510–589) region described in this work.
At the C terminus of the Gln3(510–589) region, we discovered a highly conserved stretch of 9–11 residues, Gln3(583–591), possessing a predicted propensity to fold into an α-helix (Figs. 1 and 10). The highly conserved primary structure of this Gln3 region consisted of alternating polar and hydrophobic amino acids (Fig. 9A). This organization was remarkably similar to that previously observed for the Tor1-interacting site (Fig. 9B) (40) and a second sequence in the Gln3(510–589) region (Gln3(548–568)) with less species-specific sequence conservation (Fig. 9C). Modeling revealed that the most likely structures for all three of these Gln3 regions were putative α-helices with the hydrophobic amino acids all situated on one face (Fig. 10, images A, F, and J, red spheres) and the polar amino acids on the other one (Fig. 10, images B, G, and K, green ribbons). Although it is important to emphasize that these structures must only be considered as correlative and speculative, the observation that adding a negative charge in or adjacent to these hydrophobic regions abolished rapamycin responsiveness in two cases, and the Gln3-Tor1 interaction in the third case adds some level of credibility to the speculation (Fig. 10 serine to aspartate substitutions images C–E, H, I, L, and M). In fact, in the case of rapamycin responsiveness, a single serine substitution was sufficient to achieve this result.
It is interesting that the putative α-helix required for a Gln3 response to rapamycin, Gln3(583–591), is situated only 65 amino acids N-terminal from an equally highly conserved putative α-helix required for the Gln3-Tor1 association, Gln3(656–666). Although there were striking structural similarities between these two Gln3 regions, as noted above, there were also marked differences. None of the 56 amino acids (Gln3(600–656)) preceding the Gln3-Tor1-interacting site (Gln3(656–666)) was demonstrably required for the Gln3-Tor1 interaction. Amino acid substitutions across that entire region (Gln3(600–656) failed to elicit anything other than a wild type Gln3-Tor1 interaction phenotype. In contrast, apparently all of the 72 amino acids (Gln3(510–582)) preceding the Gln3 rapamycin responsiveness site (Gln3(583–591)) were highly required as indicated by the fact that all but one of the substitutions across this region elicited a loss of rapamycin responsiveness phenotype. There was also a second important difference that may be pertinent to the mechanisms associated with or outcomes of the Gln3-Tor1 interaction and intracellular Gln3 localization in response to rapamycin treatment. As noted above, all of the serine to aspartate substitutions in the Gln3(510–589) region generated increased rapamycin resistance, whereas alanine substitutions decreased it (Fig. 13). In contrast, neither deletion of the region required for Tor1 interaction (pRR614, Gln3(600–730)) nor serine to aspartate or alanine substitutions (pRR850 and pRR1038) in the Tor1-interacting site convincingly changed rapamycin sensitivity relative to the wild type (pRR536) (Fig. 13).
Given the differences just cited, it is not surprising that the putative α-helix required for rapamycin responsiveness could not substitute for the one required for Gln3-Tor1 interaction despite their overall structural similarity. This, however, does not eliminate the possibility of their participation in a common function. Recall the observations that amino acid substitutions in either of these putative α-helices abolish rapamycin responsiveness.
One can, however, envision an alternative way of interpreting the common phenotype, i.e. loss of rapamycin responsiveness, of mutants in the Gln3(510–589) and Gln3(600–656) regions. In this view, the Gln3(656–666) Gln3-Tor1 interaction site is required for a Tor1-mediated event, speculatively a phosphorylation, because Tor1 has been shown in vitro to phosphorylate Gln3 (18, 23). If the Tor1-mediated event could not occur due to loss of Gln3-Tor1 association (pRR614, pRR850, and pRR1038 in Ref. 40), then rapamycin could not reverse, prevent, or otherwise act on it. Therefore, alterations in the Gln3 site required for Tor1 interaction would result in loss of rapamycin responsiveness even though it had nothing to do directly with affecting the response.
Finally, the Gln3 sequence and data set we obtained generated an interesting although admittedly speculative idea. Gln3(510–591) contains 28% asparagine + glutamine, 25% serine + threonine, and 24% hydrophobic amino acids, the latter scattered relatively evenly among the other highly represented amino acids. Together, they account for 77% of the total. When analyzed for predicted secondary structures, none but the putative α-helix(583–591) and the lower probability α-helix(553–563) were observed. The striking feature of the experimental data is that introduction of negative charges into any part of this region resulted in relatively uniform loss of rapamycin responsiveness and constitutive cytoplasmic Gln3-Myc13 localization. Yet, the alanine substitutions had only minor effects on Gln3-Myc13 localization. They did not result in strong constitutive nuclear localization. In many instances they had little if any effect at all. These are not the expected characteristics of these residues acting to mimic protein phosphorylation/dephosphorylation. Such characteristics would, however, not be unexpected of a region whose hydrophobic residues were interacting with similarly hydrophobic residues of another protein or structure. Here the introduction of charge would be detrimental. By this scenario, it also would not be too surprising for alanine substitutions to elicit minimal effects. Consistent with this speculation was the observation that the hydrophobic amino acids in the Gln3(510–589) region alternated with polar amino acids and that two of the three instances in which secondary structures could be predicted with high confidence, the organization of hydrophobic and polar amino acids resulted in the hydrophobic residues being situated together on one face of the helix.
Overall these and our previous studies are systematically dissecting the complicated nitrogen-responsive regulation of the GATA transcription factors. With at least four demonstrably different regulatory pathways involved (7), it is this type of detailed structural work on the direct target of those regulatory events that will ultimately delineate the individual and common components associated with them and how they so finely regulate the cell's accommodation to varying nitrogen environments.
Acknowledgment
We thank Dr. Thomas Cunningham of the University of Tennessee Health Science Center Molecular Resource Center DNA Sequencing Facility for performing all of the DNA sequencing needed to confirm the structures of the plasmids used in this work.
This work was supported, in whole or in part, by National Institutes of Health Grant GM-35642 from the NIGMS.
This paper is dedicated to the memory of MIT Professor Boris Magasanik (1919–2013), the father of nitrogen regulation in micro-organisms and discoverer, with Aaron Mitchell, of Gln3 in S. cerevisiae.
- TorC1
- target of rapamycin complex 1
- Msx
- methionine sulfoximine.
REFERENCES
- 1. Cooper T. G. (1982) in Molecular Biology of the Yeast Saccharomyces: Metabolism and Gene Expression (Strathern J. N., Jones E. W., Broach J. R., eds) pp. 39–99, Cold Spring Harbor Laboratory Press, Cold Spring Harbor, NY [Google Scholar]
- 2. Hofman-Bang J. (1999) Nitrogen catabolite repression in Saccharomyces cerevisiae. Mol. Biotechnol. 12, 35–73 [DOI] [PubMed] [Google Scholar]
- 3. Magasanik B., Kaiser C. A. (2002) Nitrogen regulation in Saccharomyces cerevisiae. Gene 290, 1–18 [DOI] [PubMed] [Google Scholar]
- 4. Cooper T. G. (2004) in Nutrient-induced Responses in Eukaryotic Cells (Winderickx J., Taylor P. M., eds) Vol. 7, pp. 225–257, Springer-Verlag, Berlin-Heidelberg [Google Scholar]
- 5. Broach J. R. (2012) Nutritional control of growth and development in yeast. Genetics 192, 73–105 [DOI] [PMC free article] [PubMed] [Google Scholar]
- 6. Conrad M., Schothorst J., Kankipati H. N., Van Zeebroeck G., Rubio-Texeira M., Thevelein J. M. (2014) Nutrient sensing and signaling in the yeast Saccharomyces cerevisiae. FEMS Microbiol. Rev. 38, 254–299 [DOI] [PMC free article] [PubMed] [Google Scholar]
- 7. Tate J. J., Cooper T. G. (2013) Five conditions commonly used to down-regulate tor complex 1 generate different physiological situations exhibiting distinct requirements and outcomes. J. Biol. Chem. 288, 27243–27262 [DOI] [PMC free article] [PubMed] [Google Scholar]
- 8. Powers T. (2007) TOR signaling and S6 kinase 1. Yeast catches up. Cell Metab. 6, 1–2 [DOI] [PubMed] [Google Scholar]
- 9. Lorberg A., Hall M. N. (2004) TOR: the first 10 years. Curr. Top. Microbiol. Immunol. 279, 1–18 [DOI] [PubMed] [Google Scholar]
- 10. Crespo J. L., Helliwell S. B., Wiederkehr C., Demougin P., Fowler B., Primig M., Hall M. N. (2004) NPR1 kinase and RSP5-BUL1/2 ubiquitin ligase control GLN3-dependent transcription in. Saccharomyces cerevisiae. J. Biol. Chem. 279, 37512–37517 [DOI] [PubMed] [Google Scholar]
- 11. Wullschleger S., Loewith R., Hall M. N. (2006) TOR signaling in growth and metabolism. Cell 124, 471–484 [DOI] [PubMed] [Google Scholar]
- 12. Smets B., Ghillebert R., De Snijder P., Binda M., Swinnen E., De Virgilio C., Winderickx J. (2010) Life in the midst of scarcity: adaptations to nutrient availability in Saccharomyces cerevisiae. Curr. Genet. 56, 1–32 [DOI] [PubMed] [Google Scholar]
- 13. Binda M., Bonfils G., Panchaud N., Péli-Gulli M. P., De Virgilio C. (2010) An EGOcentric view of TORC1 signaling. Cell Cycle 9, 221–222 [DOI] [PubMed] [Google Scholar]
- 14. Loewith R., Hall M. N. (2011) Target of rapamycin (TOR) in nutrient signaling and growth control. Genetics 189, 1177–1201 [DOI] [PMC free article] [PubMed] [Google Scholar]
- 15. Beck T., Hall M. N. (1999) The TOR signalling pathway controls nuclear localization of nutrient-regulated transcription factors. Nature 402, 689–692 [DOI] [PubMed] [Google Scholar]
- 16. Hardwick J. S., Kuruvilla F. G., Tong J. K., Shamji A. F., Schreiber S. L. (1999) Rapamycin-modulated transcription defines the subset of nutrient-sensitive signaling pathways directly controlled by the Tor proteins. Proc. Natl. Acad. Sci. U.S.A. 96, 14866–14870 [DOI] [PMC free article] [PubMed] [Google Scholar]
- 17. Cardenas M. E., Cutler N. S., Lorenz M. C., Di Como C. J., Heitman J. (1999) The TOR signaling cascade regulates gene expression in response to nutrients. Genes Dev. 13, 3271–3279 [DOI] [PMC free article] [PubMed] [Google Scholar]
- 18. Bertram P. G., Choi J. H., Carvalho J., Ai W., Zeng C., Chan T. F., Zheng X. F. (2000) Tripartite regulation of Gln3p by TOR, Ure2p, and phosphatases. J. Biol. Chem. 275, 35727–35733 [DOI] [PubMed] [Google Scholar]
- 19. Cunningham T. S., Andhare R., Cooper T. G. (2000) Nitrogen catabolite repression of DAL80 expression depends on the relative levels of Gat1p and Ure2p production in Saccharomyces cerevisiae. J. Biol. Chem. 275, 14408–14414 [DOI] [PMC free article] [PubMed] [Google Scholar]
- 20. Shamji A. F., Kuruvilla F. G., Schreiber S. L. (2000) Partitioning the transcriptional program induced by rapamycin among the effectors of the Tor proteins. Curr. Biol. 10, 1574–1581 [DOI] [PubMed] [Google Scholar]
- 21. Blinder D., Coschigano P. W., Magasanik B. (1996) Interaction of the GATA factor Gln3p with the nitrogen regulator Ure2p in Saccharomyces cerevisiae. J. Bacteriol. 178, 4734–4736 [DOI] [PMC free article] [PubMed] [Google Scholar]
- 22. Crespo J. L., Powers T., Fowler B., Hall M. N. (2002) The TOR-controlled transcription activators GLN3, RTG1, and RTG3 are regulated in response to intracellular levels of glutamine. Proc. Natl. Acad. Sci. U.S.A. 99, 6784–6789 [DOI] [PMC free article] [PubMed] [Google Scholar]
- 23. Carvalho J., Zheng X. F. (2003) Domains of Gln3p interacting with karyopherins, Ure2p, and the target of rapamycin protein. J. Biol. Chem. 278, 16878–16886 [DOI] [PubMed] [Google Scholar]
- 24. Wang H., Wang X., Jiang Y. (2003) Interaction with Tap42 is required for the essential function of Sit4 and type 2A phosphatases. Mol. Biol. Cell 14, 4342–4351 [DOI] [PMC free article] [PubMed] [Google Scholar]
- 25. Cox K. H., Tate J. J., Cooper T. G. (2002) Cytoplasmic compartmentation of Gln3 during nitrogen catabolite repression and the mechanism of its nuclear localization during carbon starvation in Saccharomyces cerevisiae. J. Biol. Chem. 277, 37559–37566 [DOI] [PMC free article] [PubMed] [Google Scholar]
- 26. Cox K. H., Tate J. J., Cooper T. G. (2004) Actin cytoskeleton is required for nuclear accumulation of Gln3 in response to nitrogen limitation but not rapamycin treatment in Saccharomyces cerevisiae. J. Biol. Chem. 279, 19294–19301 [DOI] [PMC free article] [PubMed] [Google Scholar]
- 27. Cox K. H., Kulkarni A., Tate J. J., Cooper T. G. (2004) Gln3 phosphorylation and intracellular localization in nutrient limitation and starvation differ from those generated by rapamycin inhibition of Tor1/2 in Saccharomyces cerevisiae. J. Biol. Chem. 279, 10270–10278 [DOI] [PMC free article] [PubMed] [Google Scholar]
- 28. Magasanik B. (2005) The transduction of the nitrogen regulation signal in Saccharomyces cerevisiae. Proc. Natl. Acad. Sci. U.S.A. 102, 16537–16538 [DOI] [PMC free article] [PubMed] [Google Scholar]
- 29. Kulkarni A., Buford T. D., Rai R., Cooper T. G. (2006) Differing responses of Gat1 and Gln3 phosphorylation and localization to rapamycin and methionine sulfoximine treatment in Saccharomyces cerevisiae. FEMS Yeast Res. 6, 218–229 [DOI] [PMC free article] [PubMed] [Google Scholar]
- 30. Tate J. J., Feller A., Dubois E., Cooper T. G. (2006) Saccharomyces cerevisiae Sit4 phosphatase is active irrespective of the nitrogen source provided, and Gln3 phosphorylation levels become nitrogen source-responsive in a sit4-deleted strain. J. Biol. Chem. 281, 37980–37992 [DOI] [PMC free article] [PubMed] [Google Scholar]
- 31. Yan G., Shen X., Jiang Y. (2006) Rapamycin activates Tap42-associated phosphatases by abrogating their association with Tor complex 1. EMBO J. 25, 3546–3555 [DOI] [PMC free article] [PubMed] [Google Scholar]
- 32. Tate J. J., Cooper T. G. (2007) Stress-responsive Gln3 localization in Saccharomyces cerevisiae is separable from and can overwhelm nitrogen source regulation. J. Biol. Chem. 282, 18467–18480 [DOI] [PMC free article] [PubMed] [Google Scholar]
- 33. Georis I., Tate J. J., Cooper T. G., Dubois E. (2008) Tor pathway control of the nitrogen-responsive DAL5 gene bifurcates at the level of Gln3 and Gat1 regulation in Saccharomyces cerevisiae. J. Biol. Chem. 283, 8919–8929 [DOI] [PMC free article] [PubMed] [Google Scholar]
- 34. Puria R., Zurita-Martinez S. A., Cardenas M. E. (2008) Nuclear translocation of Gln3 in response to nutrient signals requires Golgi-to-endosome trafficking in Saccharomyces cerevisiae. Proc. Natl. Acad. Sci. U.S.A. 105, 7194–7199 [DOI] [PMC free article] [PubMed] [Google Scholar]
- 35. Tate J. J., Georis I., Feller A., Dubois E., Cooper T. G. (2009) Rapamycin-induced Gln3 dephosphorylation is insufficient for nuclear localization: Sit4 and PP2A phosphatases are regulated and function differently. J. Biol. Chem. 284, 2522–2534 [DOI] [PMC free article] [PubMed] [Google Scholar]
- 36. Tate J. J., Georis I., Dubois E., Cooper T. G. (2010) Distinct phosphatase requirements and GATA factor responses to nitrogen catabolite repression and rapamycin treatment in Saccharomyces cerevisiae. J. Biol. Chem. 285, 17880–17895 [DOI] [PMC free article] [PubMed] [Google Scholar]
- 37. Georis I., Tate J. J., Feller A., Cooper T. G., Dubois E. (2011) Intranuclear function for protein phosphatase 2A: Pph21 and Pph22 are required for rapamycin-induced GATA factor binding to the DAL5 promoter in yeast. Mol. Cell. Biol. 31, 92–104 [DOI] [PMC free article] [PubMed] [Google Scholar]
- 38. Tate J. J., Rai R., Cooper TG. (2005) Methionine sulfoximine treatment and carbon starvation elicit Snf1-independent phosphorylation of the transcription activator Gln3 in Saccharomyces cerevisiae. J. Biol. Chem. 280, 27195–27204; Correction (2007) J. Biol. Chem. 282, 13139 [DOI] [PMC free article] [PubMed] [Google Scholar]
- 39. Georis I., Tate J. J., Cooper T. G., Dubois E. (2011) Nitrogen-responsive regulation of GATA protein family activators Gln3 and Gat1 occurs by two distinct pathways, one inhibited by rapamycin and the other by methionine sulfoximine. J. Biol. Chem. 286, 44897–44912 [DOI] [PMC free article] [PubMed] [Google Scholar]
- 40. Rai R., Tate J. J., Nelson D. R., Cooper T. G. (2013) gln3 mutations dissociate responses to nitrogen limitation (nitrogen catabolite repression) and rapamycin inhibition of TorC1. J. Biol. Chem. 288, 2789–2804 [DOI] [PMC free article] [PubMed] [Google Scholar]
- 41. Binda M., Péli-Gulli M. P., Bonfils G., Panchaud N., Urban J., Sturgill T. W., Loewith R., De Virgilio C. (2009) The Vam6 GEF controls TORC1 by activating the EGO complex. Mol. Cell 35, 563–573 [DOI] [PubMed] [Google Scholar]
- 42. Bonfils G., Jaquenoud M., Bontron S., Ostrowicz C., Ungermann C., De Virgilio C. (2012) Leucyl-tRNA synthetase controls TORC1 via the EGO complex. Mol. Cell 46, 105–110 [DOI] [PubMed] [Google Scholar]
- 43. Zhang T., Péli-Gulli M. P., Yang H., De Virgilio C., Ding J. (2012) Ego3 functions as a homodimer to mediate the interaction between Gtr1-Gtr2 and Ego1 in the ego complex to activate TORC1. Structure 20, 2151–2160 [DOI] [PubMed] [Google Scholar]
- 44. Panchaud N., Péli-Gulli M. P., De Virgilio C. (2013) Amino acid deprivation inhibits TORC1 through a GTPase-activating protein complex for the Rag family GTPase Gtr1. Sci. Signal. 6, ra42. [DOI] [PubMed] [Google Scholar]
- 45. Buchan D. W., Ward S. M., Lobley A. E., Nugent T. C., Bryson K., Jones D. T. (2010) Protein annotation and modelling servers at University College London. Nucleic Acids Res. 38, W563–W568 [DOI] [PMC free article] [PubMed] [Google Scholar]
- 46. Jones D. T. (1999) Protein secondary structure prediction based on position-specific scoring matrices. J. Mol. Biol. 292, 195–202 [DOI] [PubMed] [Google Scholar]
- 47. Thévenet P., Shen Y., Maupetit J., Guyon F., Derreumaux P., Tufféry P. (2012) PEP-FOLD: an updated de novo structure prediction server for both linear and disulfide bonded cyclic peptides. Nucleic Acids Res. 40, W288–W293 [DOI] [PMC free article] [PubMed] [Google Scholar]
- 48. Maupetit J., Derreumaux P., Tufféry P. (2010) A fast and accurate method for large-scale de novo peptide structure prediction. J. Comput. Chem. 31, 726–738 [DOI] [PubMed] [Google Scholar]
- 49. Kelley L. A., Sternberg M. J. (2009) Protein structure prediction on the web: a case study using the Phyre server. Nat. Protoc. 4, 363–371 [DOI] [PubMed] [Google Scholar]
- 50. Chisholm G., Cooper T. G. (1982) Isolation and characterization of mutants that produce the allantoin-degrading enzymes constitutively in Saccharomyces cerevisiae. Mol. Cell. Biol. 2, 1088–1095 [DOI] [PMC free article] [PubMed] [Google Scholar]


