

Background: The copper-sensing operon repressor (CsoR) is representative of a large family of poorly understood copper sensors.
Results: Geobacillus thermodenitrificans CsoR (Gt CsoR) is representative of CsoRs found in several human pathogens.
Conclusion: Cu(I) binding induces a structural change as modeled by small angle x-ray scattering and NMR spectroscopy.
Significance: This work provides new insights into copper-mediated conformational switching in CsoR family proteins.
Keywords: Copper, Phylogenetics, Transcription Repressor, X-ray Crystallography, X-ray Scattering, Metal Sensor Protein, Metalloregulation
Abstract
The copper-sensing operon repressor (CsoR) is representative of a major Cu(I)-sensing family of bacterial metalloregulatory proteins that has evolved to prevent cytoplasmic copper toxicity. It is unknown how Cu(I) binding to tetrameric CsoRs mediates transcriptional derepression of copper resistance genes. A phylogenetic analysis of 227 DUF156 protein members, including biochemically or structurally characterized CsoR/RcnR repressors, reveals that Geobacillus thermodenitrificans (Gt) CsoR characterized here is representative of CsoRs from pathogenic bacilli Listeria monocytogenes and Bacillus anthracis. The 2.56 Å structure of Cu(I)-bound Gt CsoR reveals that Cu(I) binding induces a kink in the α2-helix between two conserved copper-ligating residues and folds an N-terminal tail (residues 12–19) over the Cu(I) binding site. NMR studies of Gt CsoR reveal that this tail is flexible in the apo-state with these dynamics quenched upon Cu(I) binding. Small angle x-ray scattering experiments on an N-terminally truncated Gt CsoR (Δ2–10) reveal that the Cu(I)-bound tetramer is hydrodynamically more compact than is the apo-state. The implications of these findings for the allosteric mechanisms of other CsoR/RcnR repressors are discussed.
Introduction
Copper is an essential metal in many living organisms and functions as a cofactor in metalloenzymes and electron transfer processes due to its ability to reversibly access reduced Cu(I) and oxidized Cu(II) oxidation states (1, 2). However, the capability to perform one-electron redox chemistry also makes copper potentially toxic to the cell (3). Free intracellular copper targets enzymes of intermediary metabolism that have exposed iron-sulfur clusters susceptible to Cu(I) mismetallation; this, in turn, leads to an increase in free iron, which can catalyze the generation of reactive oxygen species, whose accumulation damages cell lipids, nucleic acids, and proteins (4–6). Many prokaryotes do not have a known cytoplasmic requirement for copper, and it has been conjectured that there is no free cytoplasmic copper (7). Thus, to avoid copper toxicity, cells need to tightly control intracellular copper availability. In bacteria, this is a transcriptionally controlled process mediated by metalloregulatory or metal sensor proteins, which regulate the expression of genes encoding copper chaperones, efflux transporters, and intracellular chelators (e.g. metallothioneins).
A number of proteins involved in copper resistance have been reported to be virulence factors in intracellular pathogenic bacteria, including the copper transporter CtpV and MctB in Mycobacterium tuberculosis and CtpA in Listeria monocytogenes (8–10). An in vitro x-ray microprobe analysis showed that interferon-γ (INF-γ)-activated macrophages have increased copper levels in the presence of mycobacteria, consistent with an antimicrobial role of copper (11). Other work suggests that Cu(I)-transporting ATPase, ATP7A, is capable of importing Cu(I) into infected macrophages in an effort to use copper as a bactericidal against the invading organism (12, 13). Bacteria have therefore evolved defense mechanisms against copper toxicity even in the presumed absence of a large cellular copper requirement in order to survive in this niche.
Metalloregulatory proteins control the expression of genes involved in metal homeostasis and resistance in bacteria. The copper-sensitive operon repressor (CsoR)2 was discovered in M. tuberculosis (14) as the first representative of the DUF156 family; other CsoRs were subsequently studied in Bacillus subtilis, Staphylococcus aureus, Thermus thermophilus, L. monocytogenes, and Streptomyces lividans (15–20). A second M. tuberculosis CsoR paralog, RicR, was shown to be involved in the regulation of several genes only found in pathogenic mycobacteria in response to copper stress (2). Several non-copper-sensing CsoR-like proteins, including the nickel-sensing repressors RcnR in Escherichia coli (21, 22) and InrS in Synechocystis (23) and the sulfur transferase regulator CstR in S. aureus (24, 25), have also been identified, revealing that this family of proteins has evolved to sense a range of inducers.
The Cu(I)-CsoR complex was structurally characterized first in M. tuberculosis as an all-α-helical dimer (14) with subsequent studies of B. subtilis CsoR consistent with a stable dimer-of-dimers architecture in the presence and absence of Cu(I), with each protomer containing three α-helices (α1–α3) (16). The major structural unit of the dimer is an α1-α2-α1′-α2′ four-helix bundle, with the Cu(I) bound to an S2N trigonal planar coordination chelate at the periphery of the bundle; the C-terminal α3 helices mediate many dimer-dimer contacts within the tetramer. Two copper-free crystal structures subsequently reported for T. thermophilus and S. lividans CsoRs adopt the same dimer-of-dimers architecture (18, 20). Apo-CsoR binds specifically to its operator DNA in a 2:1 tetramer/operator binding stoichiometry (16, 26) but lacks a canonical DNA binding domain; as a result, precisely how CsoR interacts with its pseudo-2-fold symmetric DNA operator remains unclear. A recent study presents a plausible model of how two CsoR tetramers are oriented on a single DNA operator (26), whereas a mass spectrometry-based method used to probe differential lysine reactivity on B. subtilis CsoR provided some insights into the conformations in distinct allosteric states (27). However, how Cu(I) binding drives negative regulation of DNA binding is not known for any CsoR or, more generally, any CsoR/RcnR protein.
We reasoned that a target CsoR was needed that could be studied both in solution and crystallographically to obtain new insights into Cu(I)-mediated allostery. We have recently developed a CsoR from Geobacillus thermodenitrificans (Gt) as a model system for this purpose (28). We show here that Gt CsoR is representative of CsoRs from other mesophilic bacilli, including B. subtilis (16) and the pathogenic bacteria L. monocytogenes (19) and Bacillus anthracis, and is more distantly related to other CsoRs characterized previously (14, 18, 20). The x-ray crystallographic structure of Cu(I)-bound Gt CsoR and companion NMR and small angle x-ray scattering (SAXS) experiments provide new insights into the Cu(I)-dependent conformational switching associated with allosteric negative regulation of DNA binding by Cu(I). How this structural transition mediates dissociation of the CsoR-DNA complex is discussed.
EXPERIMENTAL PROCEDURES
Phylogenetic Analysis of DUF156 (CsoR/RcnR) Proteins
The data set analyzed in this study includes 14 characterized proteins known to respond to one of the following inducers: copper, nickel/cobalt, formaldehyde, or sulfide/sulfite (supplemental Table S1). The DUF156 family available at Pfam (accession PF02583, 4323 sequences) was first filtered to remove redundant (100% identity) sequences by using CD-hit (29). The filtered data set (1966 sequences) was used to generate a local BLAST database by using formatdb. This database was searched for close BLASTP homologous proteins (10–15 sequences) using each of the 14 characterized DUF156 proteins as a query (supplemental Table S1), resulting in a 227-protein data set used for sequence analyses (supplemental Table S2). This 227-sequence data set was subjected to multiple-sequence alignment using MUSCLE (30), which was run with maxiters = 32, and the resultant alignment was used for the phylogenetic analysis. The maximum likelihood tree strategy was very similar to that recently applied to CDF proteins (31) and included 100 random seed trees in addition to a BioNJ tree to start 101 searches. Tree searching under the maximum likelihood criterion was performed with PhyML version 3.0 (32), using the LG model as the substitution matrix and γ correction for among-site rate variation. The tree searches were performed on a 13-node computer cluster as reported previously (31). The best tree (Fig. 1) was characterized by the highest log likelihood score from these 101 searches. Our phylogenetic analysis strongly contrasts with the most recent unrooted cladogram reported, which was inferred from a ClustalW alignment of only 29 proteins, using the Phylip suite of programs (23).
FIGURE 1.

Phylogenetic tree and group-specific amino acid signatures of functionally characterized DUF156 proteins. Shown is an unrooted, maximum likelihood-based tree of 227 DUF156 proteins inferred from characterized proteins (supplemental Table S1) and their uncharacterized homologs (supplemental Table S2). Shimodaira-Hasegawa-like p values ≥0.90 for bipartitions are shown in blue for those defining groups and red for subgroups. Each group is numbered with roman numerals (in blue), and the known metal ligand or small molecule reactivity for functionally characterized proteins (in black) in each subgroup is indicated. Scale bar, expected number of amino acid substitutions per site under the LG model. Top left, W-X-Y-Z fingerprint (22, 51, 52) variations among functionally characterized CsoR/RcnR subgroups (labeled I, II, IIIa, etc.) are shown with positions shaded according to the conservation scale (bottom). Letters in green indicate that the calculation was performed on fewer than 10% of sequences. Top right, the W position was inferred from the MSA used for the phylogenetic analysis by positional homology with the His3 residue from the Ni(II) sensor RcnR (22), whereas the X-Y-Z positions are structurally defined by the M. tuberculosis Cu(I)-bound CsoR crystal structure as ligands to the Cu(I) ion (14).
Identification of Conserved Group-specific Amino Acids over Full-length DUF156 Proteins
From the phylogeny (Fig. 1 and supplemental Table S2), we next retrieved subgroup-by-subgroup all clade-associated sequences and realigned them using MUSCLE, with the position-specific estimated evolutionary rate of amino acid variance over the full-length DUF156 proteins analyzed using ConSurf (33). The conservation-based sequence analysis of pairwise sequence identities within individual subclades and across the entire 227-member DUF156 family and all graphical outputs (histogram plots, heat maps) was carried out using a coevolution utilities suite provided by Prof. L. Swint-Kruse (University of Kansas Medical Center, Kansas City, KS).
Protein Expression and Purification
The gene encoding G. thermodenitrificans NG80-2 (Gt) CsoR was created by PCR-based amplification of the coding sequence as annotated by locus tag GTNG_1533 (105 residues) and subcloned into plasmid pET15b (Novagen). This plasmid directs the expression of T2A Gt CsoR, taken as wild type, and was transformed into Rosetta BL21(DE3) with ampicillin selection. Cell cultures were grown in 37 °C until reaching an A600 of 0.6–0.8, and protein overexpression was induced by the addition of isopropyl 1-thio-β-d-galactopyranoside to a final concentration of 1 mm for 3 h at 37 °C before harvesting. An expression plasmid was designed to overexpress an N-terminal tail truncation mutant of Gt CsoR, in which DNA encoding residues 2–10 were “looped out” to give Gt CsoR11, giving an N-terminal sequence Met1-Leu11-His12. The integrity of the DNA sequence of all expression plasmids was confirmed by sequencing. Uniformly 15N-labeled wild-type Gt CsoR was expressed essentially as described previously (28) with transformed E. coli grown in M9 salts supplemented with 15NH4Cl. Cell cultures were grown in 37 °C until reaching an A600 of 0.6–0.8, and protein overexpression was induced by adding isopropyl 1-thio-β-d-galactopyranoside to a final concentration of 0.8 mm for 2.5 h at 37 °C before harvesting. The purification of unlabeled and 15N-labeled CsoRs and CsoR11 was carried out essentially as described previously for wild-type Gt CsoR (28). Electrospray ionization mass spectrometry was used to confirm that all recombinant proteins were characterized by the correct molecular mass: 11,926 daltons (11,925 daltons expected) for wild-type CsoR (N-terminal Met processed; residues 2–105); 11,045 daltons for CsoR11 (11,042 daltons expected) for N-terminally processed CsoR11 (residues 11–105). Apo-wild-type CsoR and N-terminally truncated CsoR11 contained the full complement of reduced thiols (1.9 free thiols per monomer; 2 expected). Copper-loaded CsoRs were prepared by saturating apo-CsoRs anaerobically with the addition of 1.0 protomer molar eq of freshly prepared CuCl stock solution in fully degassed Buffer B (25 mm HEPES, pH 7.0, 200 mm NaCl) in an anaerobic glove box essentially as described previously (34). Apo- and Cu(I)-Gt CsoR R65A and K101A for the fluorescence anisotropy DNA binding assay were expressed and purified as wild-type protein.
Size Exclusion Chromatography
Size exclusion chromatography was performed using an analytical G-200 Superdex 10/300 column. 100 μl of ∼200 μm (protomer) apo- and Cu(I)-Gt CsoR were prepared in Buffer N (10 mm MES, 120 mm NaCl, 5 mm tris(2-carboxyethyl)phosphine, 5 mm EDTA, 20 mm arginine, 20 mm glutamate, pH 6.0) and injected onto the column at a flow rate of 0.5 ml/min controlled by an Akta 10 purifier chromatography system. The estimated molecular weight was obtained using a calibration curve obtained with globular protein standards.
Bacterial Copper Induction Experiments
The coding sequence of Gt CsoR and ∼200 bp upstream of the predicted promoter region was amplified by PCR from the G. thermodenitrificans genome. This DNA was then cloned into the pDG1662 vector and transformed into B. subtilis strain HB7350 (csoR::spc) (15) to be integrated at the amyE locus to create strain HB15135 (csoR::spc amyE::Gt CsoR). SPβ lysates from strain HB7358 (CU1065 SPβ (PcopZA-cat-lacZ)) (15) were used for transduction to create HB15136 (csoR::spc amyE::Gt CsoR SPβ (PcopZA-cat-lacZ)). For β-galactosidase assays, HB15136 and HB7356 (csoR::spc amyE::Bsu csoR SPβ (PcopZA-cat-lacZ)) cells from overnight culture were diluted (1:100) into 5 ml of fresh LB medium with or without a supplement of 2 mm CuSO4 and grown to midlog phase. Cells were then harvested, and β-galactosidase activity was measured in triplicate as described previously (15).
X-ray Crystallography
Cu(I)-bound Gt CsoR was prepared in an anaerobic glove box by adding 1.1 molar eq of freshly prepared CuCl into reduced apo-Gt CsoR. Cu(I)-CsoR was then buffer-exchanged to buffer N (10 mm MES, pH 6.5, 0.2 m NaCl, 3 mm DTT, 3 mm EDTA) and concentrated to 800 μm. Protein crystals were obtained in 2.8 m sodium formate, 0.1 m HEPES, pH 7.0, 0.1 m betaine hydrochloride by hanging drop vapor diffusion at 20 °C. Crystals were freshly frozen in liquid nitrogen in the crystallization conditions containing 35% ethylene glycol. Intensity data were collected at the Advanced Light Source (35) Beamline 4.2.2. All data were processed with HKL2000. Phase calculations were performed by molecular replacement in the Phaser-MR of PHENIX using Protein Data Bank entry 4ADZ (apo-CsoR from S. lividans). The initial model and electron density map were generated by AutoBuild. Models were built in Coot, and refinements were performed in PHENIX. The final data statistics are provided in Table 1 with the structure deposited in the Protein Data Bank under accession code 4M1P.
TABLE 1.
Crystallographic data collection and refinement statistics
| Cu(I)-Gt CsoR | |
|---|---|
| Data collection | |
| Space group | P622 |
| Cell dimensions | |
| a, b, c (Å) | a = b = 89.204, c = 57.985 |
| α, β, γ (degrees) | 90, 90, 120 |
| Resolution (Å) | 50-2.57 (2.61-2.57) |
| Rsym or Rmerge | 0.067 (0.80) |
| I/σI | 30.91 (1.94) |
| Completeness (%) | 99.8 (100) |
| Redundancy | 11.3 (10.3) |
| Refinement | |
| Resolution (Å) | 46.37-2.56 |
| No. of reflections | 4463 |
| Rwork/Rfree | 0.2138/0.2483 |
| No. of atoms | |
| Protein | 735 |
| Ligand/ion | 3 |
| Water | 12 |
| B-factors | |
| Protein | 65.67 |
| Ligand/ion | 64.68 |
| Water | 48.68 |
| Root mean square deviations | |
| Bond lengths (Å) | 0.0046 |
| Bond angles (degrees) | 0.75 |
| Ramachandran statistics | |
| Outliers | 0.00% |
| Allowed | 1.06% |
| Favored | 98.94% |
NMR Experiments
Both apo- and Cu(I)-CsoR wild type were prepared at 1 mm protomer in Buffer N. All NMR experiments were performed on an 800-MHz Varian (Agilent) DDR spectrometer at 318 K in the METACyt Biomolecular NMR Laboratory at Indiana University. 1H-15N steady-state heteronuclear NOE (hNOE) values were estimated from duplicate experiments by setting the relaxation delay to 5 s prior to a 0-s (without proton saturation) and 5-s (with proton saturation) 1H presaturation delay, corresponding to the equilibrium and saturated spectra, respectively. The magnitude of the hNOE was estimated from the ratio of cross-peak intensities, Isaturated/Iequilbrium) measured in two separate experiments.
SAXS Data Collection and Analysis
All SAXS data were acquired at Sector 12ID-B of the Advanced Photon Source at the Argonne National Laboratory. The energy of the x-ray beam was 12 keV (wavelength λ = 1.033 Å), and the setup was adjusted to achieve scattering q values of 0.005 < q < 0.993 Å−1, where q = (4π/λ)sinθ, and 2θ is the scattering angle. All samples were prepared at three different concentrations (1, 3, and 5 mg/ml) with an exact buffer match. All Gt CsoR (wild-type and CsoR11) samples were prepared in Buffer N, whereas all B. subtilis CsoR samples were prepared in 10 mm MES, pH 6.5, 0.1 m NaCl, 3 mm DTT, 3 mm EDTA. Twenty two-dimensional images were recorded for each buffer or protein solution sample using a flow cell, with an exposure time of 0.5 s to minimize radiation damage and obtain a good signal/noise ratio. The two-dimensional images were reduced to one-dimensional scattering profiles using Matlab software on site. Corrected scattering curves were obtained by subtracting buffer scattering from sample scattering using PRIMUS (36). Zero concentration extrapolations from three concentration curves were performed in PRIMUS to remove attractive or repulsive interaction factors. Estimates of the radius of gyration (Rg) were obtained using the Guinier approximation, ln(I(q)) ≈ ln(I(0)) − Rg2q2/3, from data at low q values in the range of qRg < 1.3. Data points were used with q up to 8/Rg to generate a real space pair distance distribution function (PDDF or p(r)) using GNOM (37), with Dmax calibrated until the PDDF curve fell smoothly to zero. Ab initio modeling was performed using the program DAMMIF (38) to obtain 15 dummy bead models. These models were then averaged in DAMAVER (39) with normalized spatial discrepancy less than 1.0, indicating good agreement between individual models. Smooth envelopes were superimposed on crystal structure by SUPCOMB (40). The theoretical scattering intensity of the atomic structure model of Cu(I)-bound Gt CsoR was calculated and fitted to the experimental scattering intensity using the FoXS server (41, 42).
Fluorescence Anisotropy Experiments
A 41-bp 3′-fluorescein-labeled operator duplex DNA was derived from the operator-promoter region of the cso operon (5′-GTTGTAACTATATACCCCCTTCGGGTATAATGTATATAGAC-3′). The double-stranded DNA was synthesized, purified, and annealed from component single strands as described previously (16). Fluorescence anisotropy measurements were performed by using a Biotek Synergy H1 hybrid multimode microplate reader with a λex value of 487 nm. A typical experiment was conducted in triplicate in a 96-well format with 10 nm duplex DNA operator in 20 mm sodium phosphate, 130 mm NaCl, pH 6.5, at 25.0 °C and various concentrations of CsoR. Normalized r values (ranging from 0 to 1) represent fractional saturation of the DNA and were calculated from the ratio (robs − rDNA)/(rmax − rDNA), where rmax is the maximum anisotropy obtained at saturating protein concentrations, and rDNA is the anisotropy of the free DNA. The resultant data were subjected to an unweighted nonlinear least squares fit to a two-tetramer binding model (defined by K1 and K2) as described earlier (16, 25) using the program DynaFit (43) and assuming a linear relationship between robs and fractional saturation of the DNA as verified previously (16). The macroscopic DNA binding constant, A2, is determined from A2 = K1·K2 (see Table 1). Allosteric coupling free energies, ΔGc, are calculated as ΔGc = −RTln(A2Cu/A2apo), with A2Cu and A2apo corresponding to macroscopic DNA binding constants of Cu(I)-bound and apo-CsoRs, respectively.
RESULTS AND DISCUSSION
Phylogenetic Analysis of DUF156 Proteins Reveals that Gt CsoR Belongs to a New Group of Cu(I) Sensors
Several DUF156 (CsoR/RcnR) (14, 22) proteins have been biochemically or structurally characterized, including multiple distinct Cu(I) sensors of particular interest here (2, 14–16, 18–20, 24) (this work), two nickel sensors (21, 23, 44), and the sulfite/sulfide sensor CstR (24, 25) (supplemental Table S1). We used a phylogenetic approach to establish the evolutionary relationships among these characterized DUF156 proteins, with an emphasis on determining the relatedness among Gt CsoR (locus tag GTNG_1533) (28) and other CsoR-like copper-sensing repressors and to uncover shared features important for Cu(I) sensing.
An unrooted, maximum likelihood-based tree of 227 DUF156 proteins (Fig. 1), ∼8-fold larger than a previous analysis (23), distributes these sequences into seven major groups, defined on the basis of clade support (p value ≥0.9) and the currently known functionally characterized proteins (Fig. 1, left inset). Strikingly, this phylogeny reveals that the Cu(I)-sensing CsoRs are distributed in four independent groups (I, III, IV, and VI). Gt CsoR is most closely related to CsoRs of other pathogenic bacilli, including B. anthracis and L. monocytogenes, also found in group IV, suggesting that these CsoRs share a common evolutionary ancestor (Fig. 1). Major features that distinguish Cu(I)-sensing CsoRs in different groups lie outside of the primary Cu(I) binding motif (X-Y-Z within the more general W-X-Y-Z sequence derived from the entire CsoR/RcnR family (22); Fig. 1, right inset) and include significantly divergent N-terminal and C-terminal extensions as well as distinct dispositions of basic residues (Lys/Arg) that may function as clade-specific DNA-binding residues, for example (supplemental Fig. S1).
It is interesting to note that two Cu(I) sensors (T. thermophilus CsoR, M. tuberculosis CsoR) and the nickel/cobalt-sensing repressor Leptospirillum ferriphilum NcrB (44) are grouped in clade I (branch support p value = 0.97). Other nickel sensors, including InrS (group VII) and RcnR (group II), are found in independent clades; however, group II also contains the E. coli formaldehyde sensor FrmR (Fig. 1A, group IIb) (45). A sequence comparison of all currently known nickel/cobalt sensors from groups I, II, and VII reveals clearly distinct W-X-Y-Z fingerprints (Fig. 1, left inset). These data taken collectively strongly suggest that the copper- and nickel-sensing ability of DUF156 proteins may have evolved at least twice in a number of bacterial organisms.
The MUSCLE-derived multiple-sequence alignment (MSA) of 227 DUF156 proteins used for phylogenetic analysis (see “Experimental Procedures”) was also used to determine the extent to which Gt CsoR is related to other CsoR/RcnR repressors. A comparison of the histogram plots of the pairwise sequence identities of the 45 sequences in group IV CsoRs (Fig. 2A) versus all 227 DUF156 proteins (Fig. 2B) reveals that the group IV CsoRs are highly similar to one another relative to all other subgroups; in fact, this is true for all groups, as revealed by the heat map of the pairwise sequence identity across the MSA (Fig. 2B). This provides additional support for the contention that Gt CsoR is an excellent model for group IV CsoRs. The sequence analyses further suggest the possibility that the mechanisms of allosteric negative regulation of DNA binding by Cu(I) in CsoRs derived from distinct clades may differ from one another and may involve both clade-specific residues and residues common to all Cu(I)-sensing CsoRs. For example, Arg15 in the α1 helix of M. tuberculosis CsoR (Lys31 in Gt CsoR) and Arg54 in S. lividans CsoR (Arg29 in Gt CsoR) were previously shown to be important for DNA operator binding by M. tuberculosis CsoR (14) and S. lividans CsoR (26), respectively (supplemental Fig. S1A). On the other hand, clade- or group-specific charged residues in Gt CsoR are of particular interest because they might be involved in operator DNA binding or in ion pairing with other clade-specific residues. These include Arg18 in the W position of the W-X-Y-Z motif as part of a highly conserved Pro17-Arg18-Thr19 sequence, Glu22 from the N-terminal region, Arg48 near the presumed Cu(I) ligand Cys50, Arg74 (in group IVb only) next to the presumed Cu(I) ligand His75, and Glu95, previously shown to be important for allosteric switching in both M. tuberculosis and B. subtilis CsoRs (supplemental Fig. S1B) (16, 46), but not to the same degree in the closely related L. monocytogenes CsoR, where it is an Asp (19) (supplemental Fig. S1A).
FIGURE 2.

Characteristics of the MUSCLE-derived MSA of 227 DUF156 proteins. A, histogram plot of the pairwise sequence identities of all group IV DUF156 proteins (45 sequences) found in the MSA used here. B, histogram plot of the pairwise sequence identities of all 227 DUF156 proteins. C, 227 × 227 heat map of the pairwise sequence identities of 227 DUF156 proteins organized according to subclade. The x and y axes correspond to different subgroups from Ia, Ib, etc. to VII and others (sequences that could not be categorized) with sequence identity shown according to the color scale. Pairwise sequence identities between most subgroups are less than 0.4 (blue), with higher scores observed within major groups or clades. The group IV sequences of interest here (including subclades IVa, IVb, and IVc) are enclosed by the black box.
Gt CsoR Acts as Cu(I)-sensing Transcriptional Repressor in B. subtilis
Gt CsoR has 54.7% sequence identity and 73.6% sequence similarity to B. subtilis CsoR, and both reside in the same clade (group IV, p value = 0.91; Fig. 1), but Gt CsoR is uncharacterized. To determine whether Gt CsoR is capable of sensing copper in cells, lacZ reporter assays were performed in a ΔcsoR strain of B. subtilis complemented with Gt CsoR wild-type, Cu(I)-binding residue substitution mutant C50A or B. subtilis CsoR, and β-galactosidase activities were measured in the presence and absence of 2 mm copper (Fig. 3A). This experiment reveals that Gt CsoR is a bona fide copper sensing repressor in B. subtilis.
FIGURE 3.
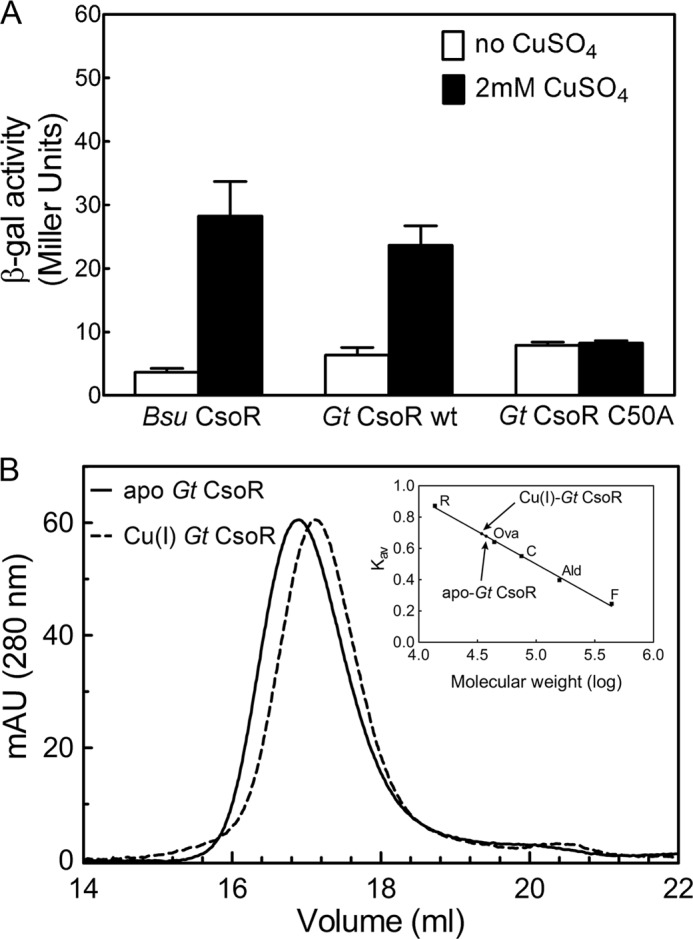
A, β-gal activity of B. subtilis CsoR-, wild-type Gt CsoR-, and C50A Gt CsoR-complemented B. subtilis csoR-null strain containing copZA promoter-lacZ fusion as reporter analyzed in LB medium with or without the addition of 2 mm CuSO4 (15). B, G200 gel filtration chromatographic elution profiles of apo- (solid) and Cu(I)-bound (dashed) Gt CsoR monitored at 280 nm. The calibration curve (inset) was prepared in Kav versus log molecular weight. R, ribonuclease A; Ova, ovalbumin; C, conalbumin; Ald, aldolase; F, ferritin.
X-ray Crystallographic Structure of Tetrameric Cu(I)-Gt CsoR
Size exclusion chromatography (Fig. 3B) and sedimentation velocity ultracentrifugation (28) reveal that both apo- and Cu(I)-bound Gt CsoR adopt tetrameric assembly states in solution, as previously found for B. subtilis CsoR (16), with the Cu(I) complex hydrodynamically measurably smaller than the apo-CsoR (Fig. 3B). In order to elucidate the structural mechanism of Cu(I)-dependent allosteric switching, we determined the crystal structure of tetrameric Cu(I)-bound Gt CsoR to a resolution of 2.56 Å (Fig. 4A). The final model was refined to an Rwork of 21.38% and an Rfree of 24.83% (Table 1). Like other Cu(I)-sensing CsoRs, copper-bound Gt CsoR adopts a disc-shaped homotetrameric assembly state (Fig. 4A) with the electron density visible from residue 10 to the C-terminal residue 105 in all four protomers; residues 2–9 are probably missing due to substantial disorder in this region of the structure (see below). Each protomer consists of four helices, labeled as α1 (residues 20–46), α2a (residues 50–76), α2b (residues 80–86), and α3 (residues 88–104). α1 and α2 pack against α1′ and α2′ from the symmetry-related protomer in the dimer to form an antiparallel four-helix bundle (Fig. 4A). Residues 12–19 just N-terminal to the α1 helix adopt an extended conformation and fold over the Cu(I)-binding site region (see below).
FIGURE 4.

Structure of Cu(I)-bound Gt CsoR. A, 2.56 Å resolution crystal structure of Cu(I)-Gt CsoR tetramer (see Table 1 for structure statistics). Each protomer is shaded differently, with Cu(I) ions represented as tan spheres and Na+ ions as purple spheres. Secondary structural units are labeled on the protomer shaded magenta. B, electrostatic surface potential of Cu(I)-Gt CsoR tetramer, with positive potential in blue and negative potential in red. Note that the side chains of Lys101 and Lys105 (C-terminal residues, close to the middle hole of the tetramer) are modeled as Ala residues. C, expansion of the tetramer interface highlighting group IV-specific residues between two protomers near the tetramer interface (marked by the black arrow). Chain coloring and approximate orientation are as in A. D, Cu(I) binding region with backbone residues in green from one protomer and residues in magenta from the other protomer with a dimer. Cu(I) is coordinated by Cys79, His75, and Cys50′ in a trigonal planar geometry. Second coordination shell residues Tyr49′ and Glu95 are also shown. The electron density map is contoured at 1σ 2Fo − Fc level. E, ribbon illustration of the folding of the N-terminal tail regions (residues 11–20) folding over the Cu(I)-binding pocket. Backbone helices from two different protomers are shaded in green and magenta, with the N-terminal tail shaded in red.
The electrostatic surface potential (Fig. 4B) shows a region of substantial strong positive potential located in the region between the C terminus of the α2b helix and the N terminus of the α3 helix, in the general vicinity of the bound Cu(I) ions. There is a slight negative potential toward the center of the tetramer, although this may be influenced by the fact that the side chains of Lys101 and the C-terminal residue Lys105 could not be traced in this structure. In any case, there is a small “hole” in the center of the donut-shaped tetramer, which is largely filled by Arg65, making close approach to the C-terminal COO− group of Lys105, which hydrogen-bonds to a solvent molecule (Fig. 4C). Arg65 corresponds to Lys60 in B. subtilis CsoR, and the reactivity of Lys60 toward an exogenous amidinating reagent is significantly reduced on DNA binding (27). An R65A mutant exhibits reduced DNA binding affinity in the apo-state (Fig. 5B) as well as a reduced allosteric coupling free energy relative to wild-type CsoR (Fig. 5A and Table 2), consistent with a direct interaction between the Arg65 side chain and DNA. Of the two conserved basic residues corresponding to Lys101 and Lys105 in Gt CsoR (Lys96 and Lys100 in B. subtilis CsoR), Lys96 (Lys101) is also strongly protected from amidination in both DNA- and Cu(I)-bound states (27). Lys101 is well positioned to form an ion pair with Glu73′ from the α2 helix (just two residues removed from Cu(I)-binding residue His75) across the tetramer interface (Fig. 4C). Formation of a salt bridge here would attenuate its reactivity. Moreover, this proposed Lys101-Glu73′ interaction is conserved in other group IV CsoRs (supplemental Fig. S1) and is charge-reversed in B. anthracis CsoR. Lys101 clearly plays an energetically important role in DNA binding because K101A CsoR is essentially inactive under these conditions in both the absence and presence of Cu(I) (Fig. 5C and Table 2). Taken together, these structural, chemical modification, and DNA binding data on two group IV CsoRs suggest that a major determinant of Cu(I)-induced DNA dissociation is a remodeling of the tetramer interface near the “hole” in the molecule upon Cu(I) binding.
FIGURE 5.
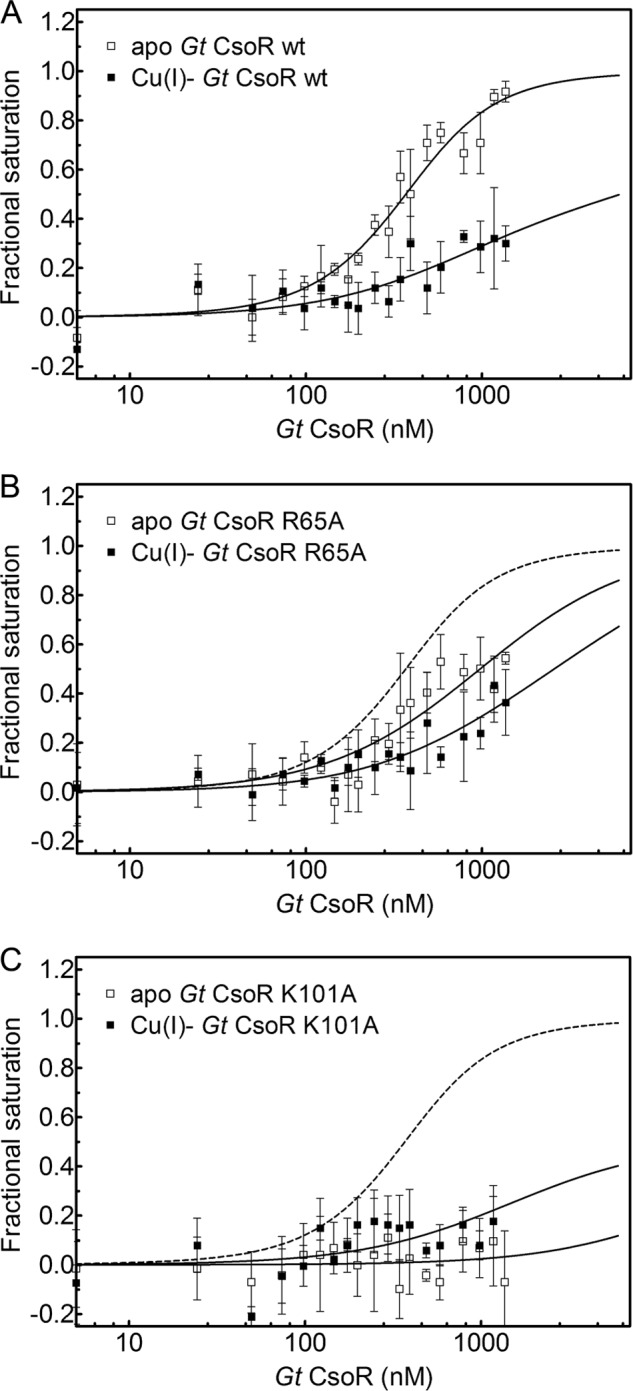
Normalized fluorescence anisotropy-based DNA binding isotherms of wild-type CsoR (A), R65A CsoR (B), and K101A CsoR (C) in the absence (open squares) and presence (filled squares) of bound Cu(I). The apo-Gt CsoR wild-type binding curve is shown as a dashed line in B and C for reference. Continuous lines represent the best fit using a stepwise two-tetramer DNA binding model with fitted parameters summarized in Table 1. Error bars, S.D.
TABLE 2.
DNA binding properties for Gt CsoRs
Conditions were as follows: 20 mm NaPi, pH 6.5, 130 mm NaCl, 25.0 °C, 10 nm DNA duplex. ND, could not be determined.
| Gt CsoR | DNA binding affinitya |
ΔGc | r0 | r∞ | ||
|---|---|---|---|---|---|---|
| K1 | K2 | A2 | ||||
| × 106m−1 | × 106m−1 | × 1013m−2 | kcal/mol | |||
| Wild type | ||||||
| Apo | 6.4 (±3.2) | 23 (±12) | 15 (±11) | >3.5 (±0.8) | 105 | 129 |
| Cu(I) | 5.3 (±1.5) | <0.1 | <0.43 (±0.12) | 104.8 | 128.8 | |
| R65A | ||||||
| Apo | 8.9 (±2.6) | 2.1 (±1.0) | 1.8 (±1.0) | 1.2 (±1.0) | 100.3 | 124.3 |
| Cu(I) | 4.4 (±1.3) | 0.6 (±0.6) | 0.3 (±0.3) | 116.6 | 140.6 | |
| K101A | ||||||
| Apo | <0.1 | ND | ND | ND | 150.7 | 174.7 |
| Cu(I) | 2.8 (±1.3) | ND | ND | 121.1 | 145.1 | |
a Determined by a fluorescence anisotropy-based assay. A2 is defined as K1·K2. K2 < 104 m−1, A2 < 1010 m−2 under these conditions. Both R65A and K101A are tetramers, as revealed by gel filtration chromatography like that shown in Fig. 3 (data not shown).
One Cu(I) per protomer is trigonally coordinated by the conserved Cys′/His/Cys (X-Y-Z; Fig. 1) motif formed by the Sγ atoms of Cys50′ of one protomer and Cys79 and the Nδ1 atom of His75 of the another protomer, analogous to that previously described in M. tuberculosis CsoR (14) (Fig. 4D). Two conserved second coordination shell residues (Tyr49′ and Glu95) are also in close proximity to primary copper ligating residues (Fig. 4D), as in M. tuberculosis CsoR (see Fig. 7A) (46). Two solvent water molecules were also found near the copper binding site, with one hydrogen-bonding to Nϵ2 of His75 and the carboxyl group of Glu95 and the other hydrogen-bonding to the hydroxyl group of Tyr49′ (Fig. 4D). Tyr49′ appears to form a short hydrogen bond with the Glu95, whereas Glu95 forms a water-mediated hydrogen bond to the Nϵ2 atom of His75. There are no other direct hydrogen bonds to the side chain of His75 in this structure.
FIGURE 7.
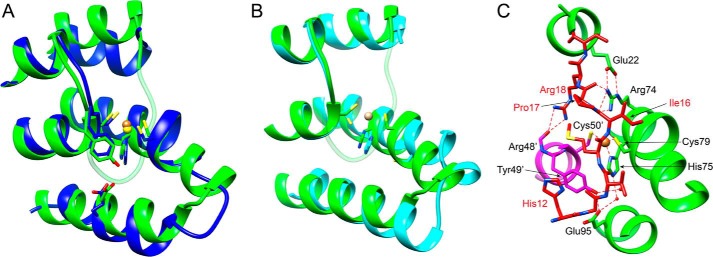
A, superposition of Cu(I)-binding region of Cu(I)-M. tuberculosis CsoR (14) (blue) and Cu(I)-Gt CsoR (55). Cu(I) ions are shaded yellow in Cu(I)-M. tuberculosis CsoR and in orange in Cu(I)-Gt CsoR. The N-terminal tail of Cu(I)-Gt CsoR is colored in light green for visualization purposes only. The global root mean square deviation is 1.0 Å as calculated by the Needleman-Wunsch alignment algorithm in Chimera. B, superposition of Cu(I)-binding region of apo-S. lividans CsoR (20) (cyan) and Cu(I)-bound Gt CsoR (55). Cu(I) ions are shaded orange in Cu(I)-bound Gt CsoR. The global root mean square deviation is 0.559 Å and is calculated by the Needleman-Wunsch alignment algorithm in Chimera. C, 90° rotation around the z axis of a schematic illustration of the N-terminal tail folding onto the Cu(I)-binding pocket from that shown in Fig. 4E. Backbone helices from two different protomers are shaded in green and magenta, with the N-terminal tail shaded in red. Selected side chains are indicated.
Gt CsoR is unique relative to other CsoRs in that it harbors a region N-terminal to the α1 helix that folds into a well defined structure. Residues 12–19 fold over the Cu(I)-binding site and include the π-π stacking of His12 on Tyr49′ and a second coordination shell hydrogen bond between the Ile16 amide proton and Sγ of copper ligand Cys79. Another striking feature of this fold is that the side chain of Arg18 is completely buried, hydrogen-bonding to the carbonyl group of Arg48′; in addition, the Arg74 side chain appears locked down, hydrogen-bonding with the backbone carbonyl groups of Ile16 and Pro17 while engaging in a salt bridge with Glu22 (Figs. 4E and 7C). These residues are highly conserved only in group IV CsoRs (supplemental Fig. S1) and thus probably represent clade-specific interactions. Interestingly, a distinct kink or helical discontinuity is found in the α2 helix between Ala76 and His78, which is required to allow Cys79 to bind the Cu(I) ion (Fig. 4E), ultimately creating the α2a and α2b helices. This discontinuity in helical geometry is also observed in solution when comparing the Cu(I)-bound versus Cu(I)-free states, and this must be part of the allosteric switching mechanism in CsoR (28) (Fig. 6A). Although not previously discussed (14), this disruption in α2 helical geometry was also found in the structure of Cu(I)-bound M. tuberculosis CsoR (Fig. 7A) but is not found in the apoprotein structure of S. lividans CsoR (Fig. 7B).
FIGURE 6.
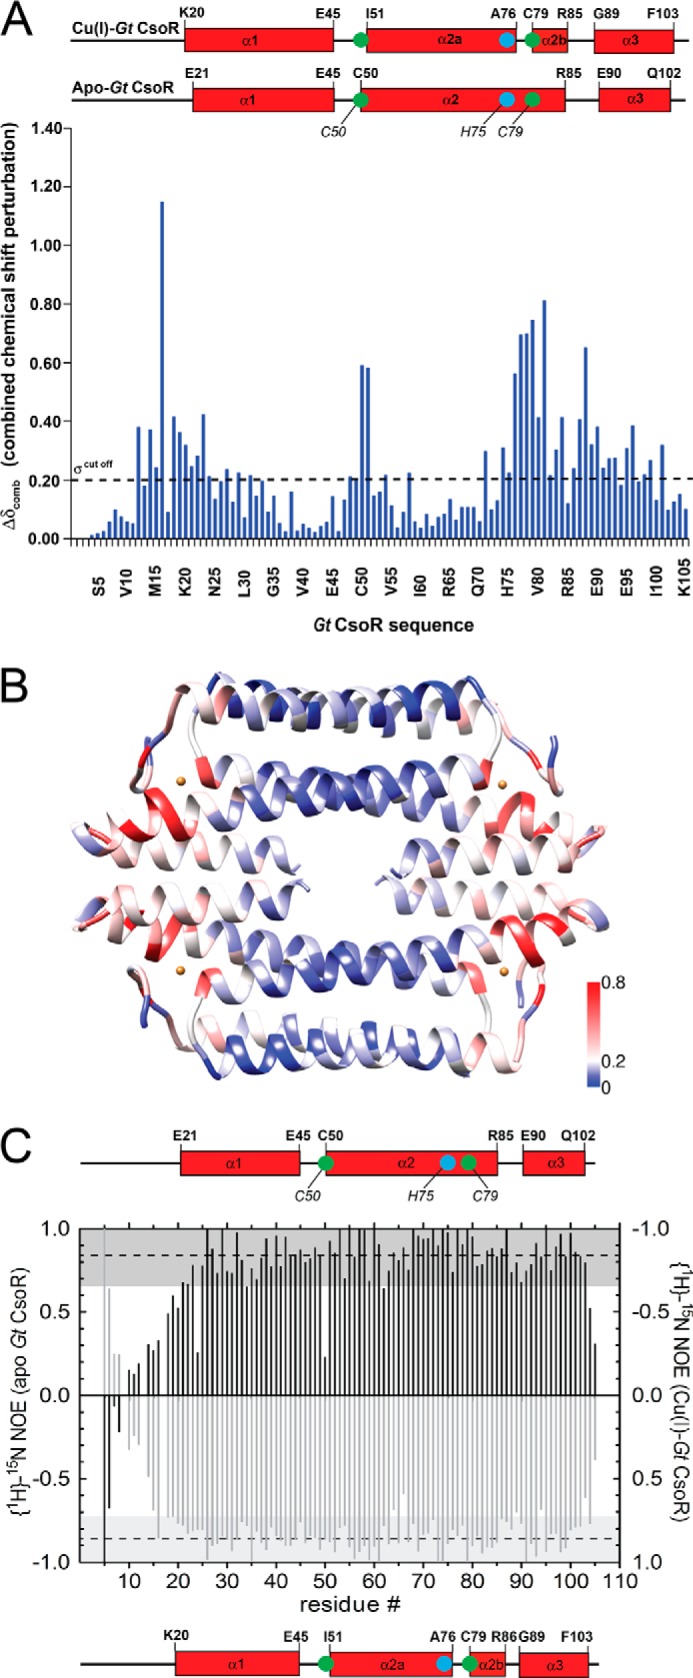
NMR analysis of Gt CsoR. A, backbone amide chemical shift perturbation map of Gt CsoR in the apo- and Cu(I)-bound states (28). Secondary structures for apo- and Cu(I)-Gt CsoR are shown at the top, with Cu(I)-binding residues labeled in green (Cys50 and Cys79) and cyan (His75). The helical boundaries are determined by TALOS+ analysis (53). B, composite chemical shift perturbation map painted on the crystal structure of Cu(I)-Gt CsoR. Cu(I)-induced perturbations are colored from blue to red according to the scale shown. C, 1H-15N hNOE analysis of apo-Gt CsoR (black bars, left axis) and Cu(I)-Gt CsoR (light gray bars, right axis). The residue-specific hNOE value is plotted as a function of residue number, with hNOE values of Cu(I)-Gt CsoR multiplied by −1 for presentation. A secondary structure schematic is shown at the top (apo) and bottom (holo) (28). Larger hNOEs correspond to lower mobility, whereas smaller or negative hNOE represent high mobility on the picosecond to nanosecond time scale (54). Dashed lines represent the mean hNOE value from residues Arg18–Lys105, with a single S.D. value defined by the shaded gray area.
NMR Analysis of the Cu(I)-dependent Allosteric Switching Mechanism in Gt CsoR
Despite the availability of a number of crystallographic structures of different apo- and Cu(I)-CsoRs, the global nature of the Cu(I)-dependent structural switch has remained elusive. Heteronuclear NMR spectroscopy was therefore utilized to study Gt CsoR in solution. All but three (of 103) non-Pro 1H-15N amide correlations have been specifically assigned in both apo- and Cu(I)-bound states in solution (28) (data not shown). A composite chemical shift perturbation map of all backbone atoms (Fig. 6A) reveals chemical shift perturbations throughout the molecule, with perturbations more pronounced near the Cu(I)-binding pocket region at the more peripheral regions of the tetramer (shaded red in Fig. 6B) with somewhat smaller changes in the “cold zone” (blue in Fig. 6B). Large perturbations occur in the N-terminal tail from His12 through the first four residues of the α1 helix to Ile23, which is reporting on folding of the N-terminal tail upon Cu(I) binding. The largest perturbation is in Ile16, which derives from a hydrogen-bonding interaction between the amide proton of Ile16 and the side chain of Cys79 (Figs. 4E and 7C). The other large perturbations are localized to the region between Ala76 and Ile84 near Cu(I) ligands His75 and Cys79, which derives from a kink of the α2 helix, to create the α2a and α2b helices (28) (Figs. 4E and 7C). Additional structural perturbations are localized to the α2b-α3 loop proximate to the Cu(I)-coordination site.
Fast time scale (picoseconds to nanoseconds) internal dynamics fluctuations as measured by the magnitude of the hNOE provide additional information about changes in conformational entropy that might be linked to Cu(I)-dependent allostery in CsoRs (47) (Fig. 6C). The apo-CsoR tetramer (Fig. 6C, black bars) is globally more dynamic (smaller hNOE and larger spread in the values) across the structured regions of the molecule (residues 20–105). Further, residues N-terminal to residue 19 exhibit a hNOE ≤ 0.5, indicative of high internal mobility in the apo-state. In contrast, Cu(I)-CsoR (Fig. 6C, light gray bars) is less globally dynamic, with residues starting with Val14 exhibiting hNOE ≥ 0.5. His12, which stacks on Tyr49′ in the structure (Fig. 4E), is dynamic in solution, as are all residues N-terminal to His12. In both allosteric states, residues 1–9 are highly mobile, exhibiting negative hNOE values; as a result, these residues are not observed in the crystal structure (Fig. 4A).
SAXS Analysis of Cu(I)-mediated Allosteric Switching
We next employed SAXS as a means to describe global features of the Cu(I)-mediated conformational switch within the tetrameric assembly state of Gt CsoR. We first examined the behavior of intact Gt CsoR and B. subtilis CsoR (16) in both apo- and Cu(I)-bound states (Fig. 8). These studies reveal that, consistent with the hydrodynamic results discussed above (16), each state is readily distinguished from one another in the raw scattering profiles (to q = 0.5 Å−1) (Fig. 8, A and D) as well as in the PDDF plots (p(r) versus r) (Fig. 8, B and E), with Guinier plots (Fig. 8, A and D, inset), indicative of monodispersity without aggregation. In both cases, the radius of gyration (Rg) was found to be slightly and consistently larger for the apo-state versus the Cu(I)-bound state (Table 3). Unfortunately, molecular scattering envelopes (Fig. 8, C and F) calculated as bead models with the ab initio program DAMMIF and averaged in DAMAVER reveal that although the envelopes are hydrodynamically smaller for the Cu(I)-bound state, the N-terminal flexible tail present in both states makes it difficult to draw additional conclusions concerning quaternary structural switching upon Cu(I) binding.
FIGURE 8.

Comparative SAXS analysis of intact wild-type Gt CsoR (A–C) and B. subtilis CsoR (D–F). A, SAXS scattering curves of apo- (solid) and Cu(I)-bound (dashed) Gt CsoR. Guinier approximations are shown in the inset and return Rgapo and RgCu listed in Table 3. B, PDDF plots of apo- (solid line) and Cu(I)-bound (dashed line) Gt CsoR to give Rgapo and RgCu in Table 3. C, tetramer face view of a superposition of the SAXS envelopes of apo- (blue, shown in mesh) and Cu(I)-bound (orange, shown in surface) Gt CsoR superimposed on the crystal structure of Cu(I)-Gt CsoR (cyan, shown in ribbon). D, SAXS scattering curves of apo- (solid line) and Cu(I)-bound (dashed) B. subtilis CsoR tetramer. Guinier approximations are shown in the inset, and Rgapo and RgCu are reported in Table 3. E, PDDF of apo- (solid line) and Cu(I)-bound (dashed line) B. subtilis CsoR to give Rgapo and RgCu values that are reported in Table 3. F, superposition of the SAXS envelopes calculated for apo- (black, shown in mesh) and Cu(I)-bound (blue, shown in surface) B. subtilis CsoR on the crystal structure of Cu(I)-Gt CsoR (green, shown in ribbon). Both CsoRs are characterized by N-terminal, probably unstructured tails of 10 or more residues, and this extension impacts the scattering envelopes, when compared with Gt CsoR11 (see Fig. 9).
TABLE 3.
SAXS structural parameters obtained for wild-type Gt CsoR, N-terminally truncated Gt CsoR (Gt CsoR11), and wild-type B. subtilis CsoR
| Apo-Gt CsoR | Cu(I)-Gt CsoR | Apo-Gt CsoR11 | Cu(I)-Gt CsoR11 | Apo-B. subtilis CsoR | Cu(I)-B. subtilis CsoR | |
|---|---|---|---|---|---|---|
| Rg (Å)a | 29.5 ± 0.3 | 28.3 ± 0.3 | 26.9 ± 0.3 | 25.2 ± 0.3 | 29.4 ± 0.3 | 27.6 ± 0.3 |
| Rg (Å)b | 29.8 ± 0.2 | 28.5 ± 0.1 | 26.9 ± 0.2 | 25.0 ± 0.1 | 29.6 ± 0.1 | 27.5 ± 0.1 |
| Dmax (Å) | 105 ± 2 | 95 ± 2 | 93 ± 2 | 72 ± 2 | 95 ± 2 | 85 ± 2 |
| Mass (kDa)c | 58.7 (47.7) | 46.45 (47.95) | 48.13 (44.17) | 37.54 (44.42) | 54.02 (45.67) | 45.62 (45.92) |
| Mass (kDa)d | 55.75 (47.7) | 45.88 (47.95) | 44.02 (44.17) | 33.65 (44.42) | 51.17 (45.67) | 42.91 (45.92) |
| NSDe | 0.708 ± 0.228 | 0.573 ± 0.037 | 0.918 ± 0.223 | 0.891 ± 0.106 | 0.631 ± 0.147 | 0.770 ± 0.154 |
| χf | 0.149 | 0.140 | 0.189 | 0.693 | 0.678 | 0.688 |
a Derived from Guinier fitting.
b Derived from GNOM analysis.
c Molecular mass calculated from SAXS; theoretical molecular masses calculated from protein sequence are shown in parentheses.
d Molecular mass calculated from excluded volume (bead models).
e Averaged normalized spatial discrepancy from 15 dummy bead models.
f Global goodness of fit of the theoretical model to the measured scattering data.
To circumvent this, we characterized a Gt CsoR lacking residues 2–10, which deletes precisely the region of the molecule that is unstructured and highly mobile in both conformational states (Fig. 6), denoted Gt CsoR11 (Fig. 9). Inspection of the SAXS scattering curves to q = 0.5 Å−1 (Fig. 9A), Guinier plots (Fig. 9A, inset), and PDDF plots (Fig. 9B) reveals that CsoR11 is hydrodynamically smaller in the Cu(I)-bound state (Rg of 26.9 and 25.1 Å for apo- and Cu(I)-bound CsoR11, respectively; Table 3), as found for intact Gt CsoR, a finding that is now better capitulated by the bead models of each conformational state (Fig. 9C). The bead model calculated with Cu(I)-bound CsoR fits the crystallographic model very well (Fig. 10B), consistent with the excellent agreement between the experimental and theoretical scattering curves, the latter calculated from the crystal structure (Fig. 9A). The SAXS model captures the major features of the quaternary structure of the tetramer, including the torqueing or swiveling of one dimer relative to the other in the tetramer to create a model that resembles a “bow tie” from the α1-α1′ face (Fig. 9C, bottom). The major discriminating feature of the apo-state tetramer is a more elongated envelope, the latter due partly to a mobile tail region (residues 11–18) (Fig. 6C) and a straight α2 helix (Fig. 6, A and B, and supplemental Movie S1). In fact, global superposition of our apoprotein scattering envelope on the structure of apo-S. lividans CsoR that lacks an N-terminal tail (20) gives a statistically better fit than when superimposed on our structure of Cu(I)-Gt CsoR (Fig. 10, A and C). A dimer superposition of Cu(I)-bound Gt CsoR (orange helical cylinders; Fig. 9D) and apo-S. lividans CsoR (green cylinders; Fig. 9D) provides another view of the degree to which Cu(I) binding to the peripheral sites may remodel the Gt CsoR tetramer. If DNA binds across the one face of the tetramer and over the “hole” (see Fig. 4C), as recent studies taken collectively indicate (26, 27), such a change in quaternary structure would probably drive disassembly of the 2:1 CsoR-DNA complex (Fig. 5A).
FIGURE 9.

Structural switching of the CsoR tetramer on Cu(I) binding. SAXS analysis of Gt CsoRΔ2–10 (denoted CsoR11). A, raw SAXS scattering curves of apo- (continuous) and Cu(I)-bound (dashed) Gt CsoR11 are shown, as is the theoretical SAXS curve back-calculated from the Cu(I)-Gt CsoR structure (red continuous line, χ = 0.595). Inset, Guinier approximations for apo-CsoR11 (filled squares) and Cu(I)-CsoR11 (open squares). B, real space PDDFs for apo- (continuous line) and Cu(I)-bound (dashed line) Gt CsoR11. C, superposition of SAXS envelopes of apo- (shaded magenta, shown in mesh) and Cu(I)-bound (shaded yellow, shown in surface) Gt CsoR11 on the crystal structure of Cu(I)-Gt CsoR (cyan, shown in ribbon). Tetramer-facing (see Fig. 3) and α1-α1′ helical face views are shown. D, helical cylinder representations of apo-S. lividans CsoR (shaded green) (20) and Cu(I)-bound Gt CsoR (shaded orange). This superposition was performed by globally aligning one dimer of each tetramer (shaded light green and light orange) shown on the top, back, and left on each of three 2-fold axis views, from top to bottom, using the program Chimera (55). The global root mean square deviation of the aligned dimer is 0.56 Å, whereas that of the other dimer is 3.04 Å.
FIGURE 10.

Global superpositions of the calculated scattering envelopes obtained for Gt CsoR in the apo- and Cu(I)-bound state (Fig. 9) with space-filling crystallographic models of Cu(I)-bound Gt CsoR or apo-S. lividans CsoR (20), as indicated. A, apo-Gt CsoR11 envelope, Cu(I)-Gt CsoR structure; B, Cu(I) Gt CsoR envelope on Cu(I)-Gt CsoR structure; C, apo-Gt CsoR envelope, apo-S. lividans CsoR structure. NSD, normalized spatial discrepancy calculated by the algorithm SUPCOMB (40). Normalized spatial discrepancy values approach 0 for ideal superposition, whereas values greater than 1.0 are systematically different. All models here represent statistically good fits with the Cu(I)-Gt CsoR envelope superimposed on the Cu(I)-Gt CsoR structure representative of the best fit (B).
Conclusion
In this work, we propose a mechanism for Cu(I)-mediated allosteric switching in a family of metalloregulatory proteins supported by structural, phylogenetic, and DNA binding data. Our crystal structure of a new Cu(I)-sensing CsoR from G. thermodenitrificans differs in important ways from the other known Cu(I)-bound CsoR structure from M. tuberculosis (14), which we show here is only distantly related to other Cu(I)-specific CsoRs (see Fig. 1). Our phylogenetic analysis could be interpreted to suggest that Cu(I)-sensing CsoRs arose multiple times during the course of evolution within CsoR/RcnR family repressors, although this cannot be stated with certainty, given the relatively small data set. Gt CsoR is representative of one of these groups and is most closely related to other CsoRs from mesophilic bacilli, including those of B. subtilis (15, 16) and the human pathogens B. anthracis and L. monocytogenes (19). The observed distribution of functionally characterized proteins and their uncharacterized homologs as well as the presence of highly conserved clade-specific residues figure prominently in the structure of the Gt CsoR and provide support for the hypothesis that features that distinguish one Cu(I)-sensing CsoR group from another derive from these clade-specific residues outside the X-Y-Z motif (Cys50, His75, and Cys79) and previously characterized second coordination residues (Tyr49 and Glu95) (Fig. 4D), which are identical for all Cu(I)-specific CsoRs. None of these clade-specific residues are found, for example, in M. tuberculosis CsoR, but all must be superimposed on conserved residues probably important for DNA binding (26). The same is more generally true for Ni(II)/Co(II)-specific RcnR (group IIa; Fig. 1) versus M. tuberculosis CsoR (48). Consistent with this, our functional analysis of R65A and K101A CsoRs reveals that these two group IV clade-specific residues contribute to apoprotein DNA binding affinity, with K101A CsoR essentially inactive under these conditions (Fig. 5). Thus, Cu(I) binding might drive a reorientation and/or sequestration of key Arg/Lys residues that interact with the DNA, which function together to lower the affinity of group IV CsoRs for DNA on Cu(I) binding. Additional mutagenesis experiments beyond the scope of this work will provide further support for or against this hypothesis.
Although a high resolution apoprotein structure of apo-Gt CsoR is not yet available, NMR spectroscopy and comprehensive small angle x-ray scattering experiments provide, for the first time, detailed insights into the local and global determinants of Cu(I)-dependent allosteric switching in a single CsoR. These copper-dependent conformational changes are propagated throughout the molecule, with the largest perturbations localized to the periphery of the tetramer in the immediate vicinity of the bound Cu(I). A prominent aspect of this structural transition is an interruption in the α2 helix; this, in turn, promotes a change in the trajectory of the α2b helix that drives a global compaction of the tetramer (supplemental Movie S1). Part of this compaction is Cu(I)-induced folding of the N-terminal tail that packs against the Cu(I)-binding site and organizes an extensive set of hydrogen bonding and electrostatic interactions that stabilize the Cu(I)-bound state.
Finally, our model of Gt CsoR also allows us to speculate on how residues in the N-terminal region may be recruited into the primary Ni(II) or Co(II) coordination spheres in other non-Cu(I)-sensing CsoR family members (e.g. in the Ni(II)/Co(II) sensors E. coli RcnR (22) and Synechocystis InrS (23, 49)). His3 of the ACTUN-like Ni(II)-binding motif at the extreme N terminus of the group IIA sensor RcnR defines the W residue of the W-X-Y-Z motif (Fig. 1) and is a key allosteric residue, the identity of which appears to impact the metal specificity of the allosteric response (50). His3 aligns with Arg18 in Gt CsoR, which is very close to the Cu(I) binding site and a key component of the N-terminal folding in Gt CsoR (Fig. 4D). Direct metal coordination by His3 and the α-amino group of Ser2 in RcnR would complete an octahedral metal coordination complex, at least for Co(II) (50). Arg18 in Gt CsoR also aligns with His21 in the Ni(II) sensor InrS in group VII (23, 49); provided the N termini of the α1 helices are in similar structural positions in these two sensors (they are within 1–2 residues in Cu(I)-sensing CsoRs (supplemental Fig. S1A)), folding the N-terminal tail as a result of direct Ni(II) coordination by His21 or His19 to complete the four-coordinate square planar complex in InrS (23, 49) could be accommodated. However, a recent report suggests that His21 in InrS in unlikely to coordinate the Ni(II) ion (49). Alternatively, His12, which is stacked on Tyr49′ in our structure, aligns with His13 in InrS, which would be in a position to potentially coordinate the Ni(II) ion. The characterization of chimeric Gt CsoRs that alter the N-terminal tail may well prove useful in this regard, as will high resolution structures of the Ni(II) complexes of RcnR and InrS.
Supplementary Material
Acknowledgments
We thank Drs. Xiaobing Zuo and R. E. Winans (Argonne National Laboratory) for assistance with the SAXS experiments. We also thank B. Kester for constructing the plasmid designed to overexpress Gt CsoR, Dr. S. Wibawo for help with the crystallography, and Dr. H. Wu for help with some NMR experiments.
This work was supported, in whole or in part, by National Institutes of Health Grant GM042569 (to D. P. G.). This work was also supported by Consejo Nacional de Ciencia y Tecnologia (México) Ph.D. Scholarship CVU 269108 (to C. C.), Ciencia Básica Grant 179133 (to P. V.), and Universidad Nacional Autónoma de México/PAPIIT (Programa de Apoyo a Projectos de Investigación e Innovación Tecnológica) Grant IN201112 (to A. G. S.). The NMR instrumentation at Indiana University was supported by the Indiana METACyt Initiative of Indiana University, funded in part through a major grant from the Lilly Endowment, Inc. Use of the Advanced Photon Source was supported by the United States Department of Energy, Office of Science, Office of Basic Energy Sciences, under Contract DE-AC02-06CH11357 and under Partner User Proposal 22978.
The atomic coordinates and structure factors (code 4M1P) have been deposited in the Protein Data Bank (http://wwpdb.org/).
NMR data have been deposited in the BioMagResBank database (http://www.bmrb.wisc.edu) under the accession numbers 18472 and 18470 for apo- and Cu(I)-CsoR, respectively.

This article contains supplemental Tables S1 and S2, Fig. S1, and Movie S1.
- CsoR
- copper-sensing operon repressor
- Gt CsoR and Gt CsoR11
- G. thermodenitrificans CsoR and CsoR11, respectively
- SAXS
- small angle x-ray scattering
- hNOE
- heteronuclear NOE
- PDDF
- pair distance distribution function
- MSA
- multiple-sequence alignment.
REFERENCES
- 1. Peña M. M., Lee J., Thiele D. J. (1999) A delicate balance: homeostatic control of copper uptake and distribution. J. Nutr. 129, 1251–1260 [DOI] [PubMed] [Google Scholar]
- 2. Festa R. A., Jones M. B., Butler-Wu S., Sinsimer D., Gerads R., Bishai W. R., Peterson S. N., Darwin K. H. (2011) A novel copper-responsive regulon in Mycobacterium tuberculosis. Mol. Microbiol. 79, 133–148 [DOI] [PMC free article] [PubMed] [Google Scholar]
- 3. Dupont C. L., Grass G., Rensing C. (2011) Copper toxicity and the origin of bacterial resistance: new insights and applications. Metallomics 3, 1109–1118 [DOI] [PubMed] [Google Scholar]
- 4. Macomber L., Rensing C., Imlay J. A. (2007) Intracellular copper does not catalyze the formation of oxidative DNA damage in Escherichia coli. J. Bacteriol. 189, 1616–1626 [DOI] [PMC free article] [PubMed] [Google Scholar]
- 5. Macomber L., Imlay J. A. (2009) The iron-sulfur clusters of dehydratases are primary intracellular targets of copper toxicity. Proc. Natl. Acad. Sci. 106, 8344–8349 [DOI] [PMC free article] [PubMed] [Google Scholar]
- 6. Chillappagari S., Seubert A., Trip H., Kuipers O. P., Marahiel M. A., Miethke M. (2010) Copper stress affects iron homeostasis by destabilizing iron-sulfur cluster formation in Bacillus subtilis. J. Bacteriol. 192, 2512–2524 [DOI] [PMC free article] [PubMed] [Google Scholar]
- 7. Rae T. D., Schmidt P. J., Pufahl R. A., Culotta V. C., O'Halloran T. V. (1999) Undetectable intracellular free copper: the requirement of a copper chaperone for superoxide dismutase. Science 284, 805–808 [DOI] [PubMed] [Google Scholar]
- 8. Ward S. K., Abomoelak B., Hoye E. A., Steinberg H., Talaat A. M. (2010) CtpV: a putative copper exporter required for full virulence of Mycobacterium tuberculosis. Mol. Microbiol. 77, 1096–1110 [DOI] [PMC free article] [PubMed] [Google Scholar]
- 9. Wolschendorf F., Ackart D., Shrestha T. B., Hascall-Dove L., Nolan S., Lamichhane G., Wang Y., Bossmann S. H., Basaraba R. J., Niederweis M. (2011) Copper resistance is essential for virulence of Mycobacterium tuberculosis. Proc. Natl Acad. Sci. 108, 1621–1626 [DOI] [PMC free article] [PubMed] [Google Scholar]
- 10. Francis M. S., Thomas C. J. (1997) Mutants in the CtpA copper transporting P-type ATPase reduce virulence of Listeria monocytogenes. Microb. Pathog. 22, 67–78 [DOI] [PubMed] [Google Scholar]
- 11. Wagner D., Maser J., Lai B., Cai Z., Barry C. E., 3rd, Höner Zu Bentrup K., Russell D. G., Bermudez L. E. (2005) Elemental analysis of Mycobacterium avium-, Mycobacterium tuberculosis-, and Mycobacterium smegmatis-containing phagosomes indicates pathogen-induced microenvironments within the host cell's endosomal system. J. Immunol. 174, 1491–1500 [DOI] [PubMed] [Google Scholar]
- 12. White C., Lee J., Kambe T., Fritsche K., Petris M. J. (2009) A role for the ATP7A copper-transporting ATPase in macrophage bactericidal activity. J. Biol. Chem. 284, 33949–33956 [DOI] [PMC free article] [PubMed] [Google Scholar]
- 13. Hodgkinson V., Petris M. J. (2012) Copper homeostasis at the host-pathogen interface. J. Biol. Chem. 287, 13549–13555 [DOI] [PMC free article] [PubMed] [Google Scholar]
- 14. Liu T., Ramesh A., Ma Z., Ward S. K., Zhang L., George G. N., Talaat A. M., Sacchettini J. C., Giedroc D. P. (2007) CsoR is a novel Mycobacterium tuberculosis copper-sensing transcriptional regulator. Nat. Chem. Biol. 3, 60–68 [DOI] [PubMed] [Google Scholar]
- 15. Smaldone G. T., Helmann J. D. (2007) CsoR regulates the copper efflux operon copZA in Bacillus subtilis. Microbiology 153, 4123–4128 [DOI] [PMC free article] [PubMed] [Google Scholar]
- 16. Ma Z., Cowart D. M., Scott R. A., Giedroc D. P. (2009) Molecular insights into the metal selectivity of the copper(I)-sensing repressor CsoR from Bacillus subtilis. Biochemistry 48, 3325–3334 [DOI] [PMC free article] [PubMed] [Google Scholar]
- 17. Baker J., Sengupta M., Jayaswal R. K., Morrissey J. A. (2011) The Staphylococcus aureus CsoR regulates both chromosomal and plasmid-encoded copper resistance mechanisms. Environ. Microbiol. 13, 2495–2507 [DOI] [PubMed] [Google Scholar]
- 18. Sakamoto K., Agari Y., Agari K., Kuramitsu S., Shinkai A. (2010) Structural and functional characterization of the transcriptional repressor CsoR from Thermus thermophilus HB8. Microbiology 156, 1993–2005 [DOI] [PubMed] [Google Scholar]
- 19. Corbett D., Schuler S., Glenn S., Andrew P. W., Cavet J. S., Roberts I. S. (2011) The combined actions of the copper-responsive repressor CsoR and copper-metallochaperone CopZ modulate CopA-mediated copper efflux in the intracellular pathogen Listeria monocytogenes. Mol. Microbiol. 81, 457–472 [DOI] [PubMed] [Google Scholar]
- 20. Dwarakanath S., Chaplin A. K., Hough M. A., Rigali S., Vijgenboom E., Worrall J. A. (2012) Response to copper stress in Streptomyces lividans extends beyond genes under direct control of a copper-sensitive operon repressor protein (CsoR). J. Biol. Chem. 287, 17833–17847 [DOI] [PMC free article] [PubMed] [Google Scholar]
- 21. Iwig J. S., Rowe J. L., Chivers P. T. (2006) Nickel homeostasis in Escherichia coli: the rcnR-rcnA efflux pathway and its linkage to NikR function. Mol. Microbiol. 62, 252–262 [DOI] [PubMed] [Google Scholar]
- 22. Iwig J. S., Leitch S., Herbst R. W., Maroney M. J., Chivers P. T. (2008) Ni(II) and Co(II) sensing by Escherichia coli RcnR. J. Am. Chem. Soc. 130, 7592–7606 [DOI] [PMC free article] [PubMed] [Google Scholar]
- 23. Foster A. W., Patterson C. J., Pernil R., Hess C. R., Robinson N. J. (2012) A cytosolic Ni(II) sensor in a cyanobacterium: nickel detection follows nickel affinity across four families of metal sensors. J. Biol. Chem. 287, 12142–12151 [DOI] [PMC free article] [PubMed] [Google Scholar]
- 24. Grossoehme N., Kehl-Fie T. E., Ma Z., Adams K. W., Cowart D. M., Scott R. A., Skaar E. P., Giedroc D. P. (2011) Control of copper resistance and inorganic sulfur metabolism by paralogous regulators in Staphylococcus aureus. J. Biol. Chem. 286, 13522–13531 [DOI] [PMC free article] [PubMed] [Google Scholar]
- 25. Luebke J. L., Arnold R. J., Giedroc D. P. (2013) Selenite and tellurite form mixed seleno- and tellurotrisulfides with CstR from Staphylococcus aureus. Metallomics 5, 335–342 [DOI] [PMC free article] [PubMed] [Google Scholar]
- 26. Tan B. G., Vijgenboom E., Worrall J. A. (2014) Conformational and thermodynamic hallmarks of DNA operator site specificity in the copper sensitive operon repressor from Streptomyces lividans. Nucleic Acids Res. 42, 1326–1340 [DOI] [PMC free article] [PubMed] [Google Scholar]
- 27. Chang F. M., Lauber M. A., Running W. E., Reilly J. P., Giedroc D. P. (2011) Ratiometric pulse-chase amidination mass spectrometry as a probe of biomolecular complex formation. Anal. Chem. 83, 9092–9099 [DOI] [PMC free article] [PubMed] [Google Scholar]
- 28. Coyne H. J., 3rd, Giedroc D. P. (2013) Backbone resonance assignments of the homotetrameric (48 kD) copper sensor CsoR from Geobacillus thermodenitrificans in the apo- and Cu(I)-bound states: insights into copper-mediated allostery. Biomol. NMR Assign. 7, 279–283 [DOI] [PMC free article] [PubMed] [Google Scholar]
- 29. Li W., Godzik A. (2006) Cd-hit: a fast program for clustering and comparing large sets of protein or nucleotide sequences. Bioinformatics 22, 1658–1659 [DOI] [PubMed] [Google Scholar]
- 30. Edgar R. C. (2004) MUSCLE: multiple sequence alignment with high accuracy and high throughput. Nucleic Acids Res. 32, 1792–1797 [DOI] [PMC free article] [PubMed] [Google Scholar]
- 31. Cubillas C., Vinuesa P., Tabche M. L., García-de los Santos A. (2013) Phylogenomic analysis of cation diffusion facilitator proteins uncovers Ni2+/Co2+ transporters. Metallomics 5, 1634–1643 [DOI] [PubMed] [Google Scholar]
- 32. Guindon S., Gascuel O. (2003) A simple, fast, and accurate algorithm to estimate large phylogenies by maximum likelihood. Syst. Biol. 52, 696–704 [DOI] [PubMed] [Google Scholar]
- 33. Glaser F., Pupko T., Paz I., Bell R. E., Bechor-Shental D., Martz E., Ben-Tal N. (2003) ConSurf: identification of functional regions in proteins by surface-mapping of phylogenetic information. Bioinformatics 19, 163–164 [DOI] [PubMed] [Google Scholar]
- 34. Fu Y., Tsui H. C., Bruce K. E., Sham L. T., Higgins K. A., Lisher J. P., Kazmierczak K. M., Maroney M. J., Dann C. E., 3rd, Winkler M. E., Giedroc D. P. (2013) A new structural paradigm in copper resistance in Streptococcus pneumoniae. Nat. Chem. Biol. 9, 177–183 [DOI] [PMC free article] [PubMed] [Google Scholar]
- 35. Adamou J. E., Heinrichs J. H., Erwin A. L., Walsh W., Gayle T., Dormitzer M., Dagan R., Brewah Y. A., Barren P., Lathigra R., Langermann S., Koenig S., Johnson S. (2001) Identification and characterization of a novel family of pneumococcal proteins that are protective against sepsis. Infect. Immun. 69, 949–958 [DOI] [PMC free article] [PubMed] [Google Scholar]
- 36. Konarev P. V., Volkov V. V., Sokolova A. V., Koch M. H. J., Svergun D. I. (2003) PRIMUS: a Windows PC-based system for small-angle scattering data analysis. J. Appl. Cryst. 36, 1277–1282 [Google Scholar]
- 37. Svergun D. (1992) Determination of the regularization parameter in indirect-transform methods using perceptual criteria. J. Appl. Cryst. 25, 495–503 [Google Scholar]
- 38. Franke D., Svergun D. I. (2009) DAMMIF, a program for rapid ab-initio shape determination in small-angle scattering. J. Appl. Cryst. 42, 342–346 [DOI] [PMC free article] [PubMed] [Google Scholar]
- 39. Volkov V. V., Svergun D. I. (2003) Uniqueness of ab initio shape determination in small-angle scattering. J. Appl. Cryst. 36, 860–864 [DOI] [PMC free article] [PubMed] [Google Scholar]
- 40. Kozin M., Svergun D. I. (2001) Automated matching of high- and low-resolution structural models. J. Appl. Cryst. 34, 33–41 [Google Scholar]
- 41. Schneidman-Duhovny D., Hammel M., Sali A. (2010) FoXS: a web server for rapid computation and fitting of SAXS profiles. Nucleic Acids Res. 38, W540–W544 [DOI] [PMC free article] [PubMed] [Google Scholar]
- 42. Schneidman-Duhovny D., Hammel M., Tainer J. A., Sali A. (2013) Accurate SAXS profile computation and its assessment by contrast variation experiments. Biophys. J. 105, 962–974 [DOI] [PMC free article] [PubMed] [Google Scholar]
- 43. Kuzmic P. (1996) Program DYNAFIT for the analysis of enzyme kinetic data: application to HIV proteinase. Anal. Biochem. 237, 260–273 [DOI] [PubMed] [Google Scholar]
- 44. Zhu T., Tian J., Zhang S., Wu N., Fan Y. (2011) Identification of the transcriptional regulator NcrB in the nickel resistance determinant of Leptospirillum ferriphilum UBK03. PLoS One 6, e17367. [DOI] [PMC free article] [PubMed] [Google Scholar]
- 45. Herring C. D., Blattner F. R. (2004) Global transcriptional effects of a suppressor tRNA and the inactivation of the regulator frmR. J. Bacteriol. 186, 6714–6720 [DOI] [PMC free article] [PubMed] [Google Scholar]
- 46. Ma Z., Cowart D. M., Ward B. P., Arnold R. J., DiMarchi R. D., Zhang L., George G. N., Scott R. A., Giedroc D. P. (2009) Unnatural amino acid substitution as a probe of the allosteric coupling pathway in a mycobacterial Cu(I) sensor. J. Am. Chem. Soc. 131, 18044–18045 [DOI] [PMC free article] [PubMed] [Google Scholar]
- 47. Tzeng S. R., Kalodimos C. G. (2012) Protein activity regulation by conformational entropy. Nature 488, 236–240 [DOI] [PubMed] [Google Scholar]
- 48. Higgins K. A., Hu H. Q., Chivers P. T., Maroney M. J. (2013) Effects of select histidine to cysteine mutations on transcriptional regulation by Escherichia coli RcnR. Biochemistry 52, 84–97 [DOI] [PMC free article] [PubMed] [Google Scholar]
- 49. Foster A. W., Pernil R., Patterson C. J., Robinson N. J. (2014) Metal-specificity of cyanobacterial nickel-responsive repressor InrS: cells maintain zinc and copper below the detection-threshold for InrS. Mol. Microbiol. 92, 797–812 [DOI] [PMC free article] [PubMed] [Google Scholar]
- 50. Higgins K. A., Chivers P. T., Maroney M. J. (2012) Role of the N terminus in determining metal-specific responses in the E. coli Ni- and Co-responsive metalloregulator, RcnR. J. Am. Chem. Soc. 134, 7081–7093 [DOI] [PMC free article] [PubMed] [Google Scholar]
- 51. Ma Z., Jacobsen F. E., Giedroc D. P. (2009) Coordination chemistry of bacterial metal transport and sensing. Chem. Rev. 109, 4644–4681 [DOI] [PMC free article] [PubMed] [Google Scholar]
- 52. Higgins K. A., Giedroc D. (2014) Insights into protein allostery in the CsoR/RcnR family of transcriptional repressors. Chem. Lett. 43, 20–25 [DOI] [PMC free article] [PubMed] [Google Scholar]
- 53. Cornilescu G., Delaglio F., Bax A. (1999) Protein backbone angle restraints from searching a database for chemical shift and sequence homology. J. Biomol. NMR 13, 289–302 [DOI] [PubMed] [Google Scholar]
- 54. Henzler-Wildman K. A., Lei M., Thai V., Kerns S. J., Karplus M., Kern D. (2007) A hierarchy of timescales in protein dynamics is linked to enzyme catalysis. Nature 450, 913–916 [DOI] [PubMed] [Google Scholar]
- 55. Pettersen E. F., Goddard T. D., Huang C. C., Couch G. S., Greenblatt D. M., Meng E. C., Ferrin T. E. (2004) UCSF Chimera: a visualization system for exploratory research and analysis. J. Comp. Chem. 25, 1605–1612 [DOI] [PubMed] [Google Scholar]
Associated Data
This section collects any data citations, data availability statements, or supplementary materials included in this article.