

Abstract
Objective
Although a heritable contribution to risk for major depressive disorder (MDD) has been established and neural alterations in patients have been identified through neuroimaging, it is unclear which brain abnormalities are related to genetic risk. Studies on brain structure of high-risk subjects – such as individuals carrying a familial liability for the development of MDD – can provide information on the potential usefulness of these measures as intermediate phenotypes of MDD.
Methods
63 healthy first-degree relatives of patients with MDD and 63 healthy controls underwent structural magnetic resonance imaging. Regional gray matter volumes were analyzed via voxel-based morphometry (VBM).
Results
Whole-brain analysis revealed significantly larger gray matter volume in the bilateral amygdala in first-degree relatives of patients with MDD. Furthermore, relatives showed significantly larger gray matter volume in anatomical structures found relevant to MDD in previous literature, specifically in the bilateral hippocampus and amygdala as well as the left dorsolateral prefrontal cortex (DLPFC). Bilateral DLPFC volume correlated positively with the experience of negative affect.
Conclusions
Larger gray matter volume in healthy relatives of MDD patients point to a possible vulnerability mechanism in MDD etiology and therefore extend knowledge in the field of high-risk approaches in MDD.
Keywords: Major depressive disorder, High-risk, voxel-based morphometry, Gray matter volume, Amygdala
Highlights
-
•
Brain structure of high-risk subjects might indicate intermediate phenotypes of MDD
-
•
63 first-degree relatives of MDD patients/ 63 healthy controls were studied
-
•
Local gray matter volumes were analyzed via VBM
-
•
Analysis revealed larger volume in bilateral amygdalae in relatives of MDD patients
-
•
Brain volume differences point to a vulnerability mechanism in MDD etiology
1. Introduction
In recent years, research on neurobiological risk factors for major depressive disorder (MDD) has increasingly identified neurobiological contributions to disease risk. This is important since MDD is one of the leading causes of years lost due to disability (World Health Organization, 2009) and is associated with high mortality rates (Palazidou, 2012). One of the major methodological approaches in this domain has been neuroimaging. Several studies in patients reported functional as well as structural brain alterations (Drevets et al., 2008). Functional findings suggest dysregulation in neural circuits involving the prefrontal cortex as well as limbic structures (including the amygdala and hippocampus) (Price and Drevets, 2012). In line with these findings are results from structural imaging: Meta-analyses have highlighted volume reductions in the bilateral anterior cingulate cortex (ACC), dorsomedial frontal cortex, right middle frontal gyrus extending into the precentral gyrus, bilateral putamen, caudate, and right anterior insula/inferior frontal cortex in MDD (Bora et al., 2012). Arnone et al. (2012) described volume reductions in the frontal, orbitofrontal and cingulate cortices, hippocampus and striatum. Yet, as has been shown in a review by Frodl et al. (2008), some of these findings have been inconsistent, e.g., those concerning amygdala volumes. Diverging results might be due to methodological differences of study design and data analysis. Moreover, biological variables (e.g., age and sex) as well as psychopathological factors (e.g., age of onset, course of the disease and medication) might contribute to inconsistent findings (Arnone et al., 2012). Even given widespread and replicable structural–functional alterations in patients compared to controls, it remains unclear whether such changes occur after the manifestation of MDD symptoms, whether they represent risk factors for the development of MDD, or whether they are related to confounds such as comorbidity, medication use, social stress and lifestyle changes associated with having a severe mental illness.
Research on etiology of MDD has shown that multiple factors contribute to the manifestation of the disorder. MDD etiology is linked to interactions between genetic vulnerability – indexed not only by familial liability, but also by heritable traits such as neuroticism – and biographical/ environmental factors such as adverse life events (Burke et al., 2005). Often, risk factors are combined. For instance, patients with a family history of depression show a lower age of onset and are more likely to have recurrent depressive phases (Hollon et al., 2006). With an overall heritability of 30–40%, MDD is less strongly genetically determined than other severe mental illnesses, which emphasizes the importance of gene–environment interactions. One strategy to disentangle the complex network of influencing factors is to focus on high-risk subjects for MDD. Healthy first-degree relatives of MDD patients (H1stR) enable the investigation of vulnerability factors as well as resilience markers related to heritable or shared environmental (e.g., early familial) factors. While vulnerability factors are thought to increase risk of mental illness, resilience factors are considered to facilitate healthy functioning. Applied to quantitative, more biologically based measures such as neuroimaging, these studies add to the search for intermediate (or “endo”-) phenotypes. One necessary, but by no means sufficient, criterion for an endophenotype is that markers found in affected family members should also be found in nonaffected family members at a rate higher than that of the general population (Gottesman and Gould, 2003). Conversely, findings opposite in directionality between patients and their family members in similar systems may point to resilience factors protecting healthy relatives from manifest illness despite their genetic susceptibility. In the domain of brain structure, few manual tracing and voxel-based morphometry (VBM) studies searching for MDD endophenotypes have been published to date. Manual tracing studies revealed smaller hippocampal but larger amygdala volume in high-risk subjects (Boccardi et al., 2010; Rao et al., 2010; Saleh et al., 2012). The reduction in hippocampal volume in high-risk subjects compared to healthy controls or MDD patients was confirmed by VBM (Amico et al., 2011; Baaré et al., 2010; Carballedo et al., 2012; Chen et al., 2010; de Geus et al., 2007). Furthermore, VBM studies exhibited a reduction in local gray matter in the dorsolateral prefrontal cortex (DLPFC) (Amico et al., 2011; Carballedo et al., 2012). Nevertheless, the explanatory power of previous results regarding the potential structural endophenotypes of MDD is limited due to heterogeneity in sample sizes, studied risk populations and applied methods, e.g. region-of-interest (ROI) based analyses only.
To advance the data available in this field, we collected structural magnetic resonance imaging (MRI) data from a large sample of H1stR and matched healthy control subjects without any familial history of psychiatric illness (HC) and conducted a whole-brain VBM-analysis, thereby applying a very conservative statistical threshold. For consistency with the literature, we additionally tested our data for effects in regions previously observed using small volume alpha error adjustment. This approach decreases the probability of false positive as well as false negative findings and provides new insights in brain structural correlates linked to the genetic risk for MDD.
2. Methods and materials
2.1. Participants
All subjects were enrolled in a multicenter study (Esslinger et al., 2009) conducted by the Charité — Universitätsmedizin Berlin, the Universitätsklinikum Bonn and the Zentralinstitut für Seelische Gesundheit, Mannheim. The study was performed in accordance with the latest version of the Declaration of Helsinki and approved by the local Ethics Committees. Subjects participated in the study after providing written informed consent. 63 H1stR (38 females; 21 subjects from Berlin, 21 from Bonn and 21 from Mannheim) were measured and 63 HC (38 females; 21 subjects from Berlin, 21 from Bonn and 21 from Mannheim) matched for age and sex were taken from a larger study sample. Affected relatives of the H1stR group (43 offspring, 17 siblings, 1 parent, 2 NA) were examined by an experienced psychiatrist or clinical psychologist using the German version of the Structured Clinical Interview for DSM-IV (SCID-I) (First et al., 2002) or had to provide a medical report confirming a major depressive disorder. Both the H1stR and the HC group had no history of any neurological disorder or lifetime psychiatric axis I disorder including drug or alcohol dependence as verified by an interview according to the Screening Interview for DSM-IV axis I disorders. Further, subjects in the HC group were questioned carefully whether there is any knowledge about psychiatric disorders in their family, and special emphasis was put on first degree relatives. Subjects with axis 1 disorders or unclear diagnoses in their families were not included in the study sample. Handedness was measured by the Edinburgh Handedness Inventory (Oldfield, 1971) (H1stR: 55 right handers, 6 left handers, 2 both hander; HC: 57 right handers, 4 left handers, 2 both hander). In addition, years of education and premorbid intelligence assessed by the multiple choice verbal intelligence test (MWT-B) (Lehrl, 2005) as well as clinical scales such as the Symptom Check List (SCL-90-R) with the subscales Global Severity Index (SCL-GSI) and Depression (SCL-Depr) (Derogatis, 1983) were assessed. No significant difference between the two groups were found (see Table 1). Furthermore, a composite score (NegAff) comprising three self-report measures associated with the experience of negative affect was included, in detail: 1) the trait form of the Spielberger State/Trait Anxiety Inventory (STAI) (Spielberger, 1989) for the assessment of feelings of tension, fear and worry; 2) the neuroticism scale from the NEO five-factor inventory (Costa and McCrae, 1992) which assesses the degree to which an individual experiences negative affects such as anger, sadness and guilt; and 3) the harm avoidance scale of the Temperament and Character Inventory (TCI) (Cloninger, 1994) which measures a personality trait characterized by anticipatory worry, pessimism, easy fatigue and shyness. The composite score was calculated by using the average of the Z-scores for each individual scale as suggested previously (Holmes et al., 2012). The two groups did not differ on this scale either.
Table 1.
Sociodemographical and clinical data. Abbreviations: H1stR — healthy first-degree relatives of MDD patients; HC — healthy control subjects; MWT-B — multiple choice verbal intelligence test; SCL-90-R — Symptom Check List; GSI — Global Severity Index, *IQ.
| Variable | H1stR (25 ?/38 ?) |
HC (25 ?/38 ?) |
Wilcoxon |
|||
|---|---|---|---|---|---|---|
| Median | 95% CI | Median | 95% CI | z-value | p-value | |
| Age in years |
25.0 | 10.4/39.6 | 26.0 | 11.2/40.8 | –.14 | .89 |
| Years of education |
15.5 | 10.8/20.2 | 15.5 | 11.7/19.3 | –.54 | .588 |
| MWT-B |
30 (107*) | 20.5/39.5 | 30 (107*) | 25.1/34.9 | –.76 | .45 |
| SCL-90-R (GSI) |
.16 | –.18/.5 | .12 | –.2/.5 | –1.32 | .19 |
| SCL-90-R (depression) |
.15 | –.5/0.8 | .08 | –.4/0.6 | –1.28 | .202 |
| Composite score: experience of negative affect |
–.19 | –1.9/1.5 | –.18 | –1.9/1.6 | –.04 | .965 |
2.2. Statistical analysis of sociodemographical, psychometrical and clinical data
Statistical analyses were performed using the software package MATLAB (MATLAB 7.8, The MathWorks Inc., Natick, MA, 2009). Due to violation of statistical assumptions for parametrical testing (normal distribution as assessed by the Kolmogorov–Smirnov test or the level of measurement), the medians of age, years of education, IQ, SCL-GSI and SCL-Depr and the composite score NegAff were tested regarding group differences via non-parametrical Wilcoxon rank-sum test (see Supplementary Table S1).
2.3. MRI acquisition
Structural MRI data were acquired on a 3 Tesla Siemens MAGNETOM Tim Trio MRI system (Siemens, Erlangen, Germany) at all three study sites. All subjects underwent a T1-weighted three-dimensional magnetization prepared rapid gradient echo (MP-RAGE) sequence with an isotropic spatial resolution of 1 mm3 (repetition time = 1.57 s, echo time = 2.74 ms, flip angle = 15°). Additional quality control measurements via EPI sequences were conducted at all study sites on every day of data collection according to a multicenter quality assurance protocol (Friedman and Glover, 2006), revealing stable signals over time and comparable quality between sites.
2.4. Voxel-based morphometry (VBM)
MRI data processing was performed according to an established voxel-based morphometry protocol using the VBM8 toolbox (Structural Brain Mapping Group, University of Jena, Germany; http://dbm.neuro.uni-jena.de/vbm8) for the Statistical Parametric Mapping 8 Software (SPM8, Welcome Trust Centre for Neuroimaging, UCL, London, UK; http://www.fil.ion.ucl.ac.uk/spm).
Before segmentation into tissue classes, images were visually inspected to remove images with artefacts, manually aligned to the orientation as defined by the used brain templates, and the origin was set on the anterior commissure. Afterwards, individual anatomical images were classified into gray matter, white matter and cerebro-spinal fluid as well as three extra-cerebral tissue classes and transformed to the stereotactical standard space as provided by the International Consortium for Brain Mapping (6 tissue class template; http://www.loni.usc.edu/ICBM) using the diffeomorphic image registration algorithm (DARTEL) developed by Ashburner (2007). To account for the local normalization degree, gray matter images were modulated with the nonlinear transformation parameters as computed during the normalization procedures. The resulting images contain the volume proportion of probabilistically assigned gray matter tissue for each voxel. These gray matter tissue probability images were again inspected visually and finally smoothed using an isotropic Gaussian kernel with a full-width at a half-maximum of 8 mm. Note that each image of the regional GM volume was corrected for individual brain size, since this step is part of the VBM8 toolbox routine.
A voxel-wise whole-brain 2 × 3 analysis of covariance (ANCOVA) with the factor of interest Group (H1stR vs. HC) was performed. The additional factor scanner site allowed for detailed quality control regarding possible influences of the multicenter setting: no interaction between the two factors was observed (p < .05 FWE corr.). Due to its impact on brain volume, sex and the MWT-B were also used as covariates. Finally, age was included as covariate of no interest. Only findings that passed a significance level of p < .05 (voxel level inference), whole-brain family wise error (FWE) corrected for multiple comparison and a cluster size of at least 10 adjacent voxels, are reported. Gray matter regions that showed a significant group effect were anatomically labeled using the probabilistic cytoarchitectonic Anatomy toolbox (Eickhoff et al., 2005) as implemented in SPM8. Based on the maps provided by Amunts et al. (2005) (amygdala and hippocampus), the cytoarchitectonic probabilities for these regions were computed. To test for the direction of differences in gray matter volume, we applied post hoct-tests at the peak voxel positions for the individual gray matter values.
Due to our strong hypotheses based on previous literature, we performed an adjustment of alpha error probabilities for the volumes of the following a-priori defined anatomical regions as provided by the Automated Anatomical Labelling (AAL) (Tzourio-Mazoyer et al., 2002) brain atlas: bilateral hippocampus (volume: right 7.6 cm3, left 7.5 cm3), amygdala (volume: right 1.9 cm3, left 1.7 cm3) and DLPFC (?? middle frontal gyrus; Brodmann areas 8, 9, 46; volume: right 37.9 cm3, left 38.6 cm3) (see Supplementary Fig. S1). Only results with an adjusted alpha error probability less than .05 family-wise error (FWE) corrected for multiple comparisons are reported.
In order to probe whether differences in gray matter volume between H1stR and HC relate to subclinical depressive symptoms and experience of negative affect, we conducted, for both groups, voxel-wise correlation analyses (non-normally distributed: Spearman's rho, corrected for age, sex and MWT-B) for the self-report measure SCL-Depr as well as the NegAff and local gray matter volume in the ROIs.
3. Results
3.1. Sociodemographical, psychometrical and clinical sample characteristics
For results of sociodemographical, psychometrical and clinical data, see Table 1.
3.2. Voxel-wise local gray matter volume — whole-brain analysis
VBM results revealed a main effect of Group for the amygdala bilateral with larger local gray matter volume for H1stR subjects in the bilateral amygdala (left: x = -21, y= 2, z= -14, 278 voxels; right: x= 26, y= 0, z= -15, 318 voxels) compared with HC subjects (see Fig. 1and Supplementary Table S2). In contrast, HC did not have any relative increases in local gray matter volume.
Fig. 1.
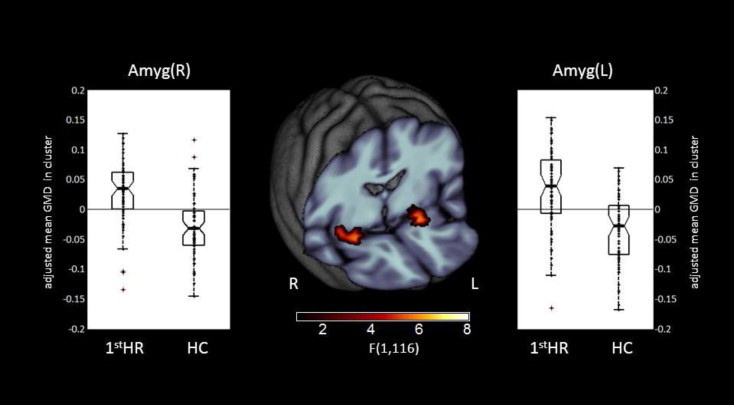
Whole-brain FWE correctable results. Middle panel: Clusters with a significant main effect of group. Left and right panels: Box plots for local gray matter volumes of H1stR (n = 63) and HC (n= 63) at peak voxel coordinates. The dots indicate the individual gray matter volumes. Abbreviation: CI — confidence interval; H1stR — healthy first-degree relatives of MDD patients; HC — healthy control subjects.
3.3. Voxel-wise local gray matter volume — ROI based analyses
Alpha error adjustment for a-priori defined ROIs revealed a larger local gray matter volume for H1stR subjects in the bilateral hippocampus, bilateral amygdala and left DLPFC (see Table 2).
Table 2.
Differences in local gray matter volume between H1stR (n= 63) and HC (n = 63) subjects (alpha error probabilities adjusted for a-priori regions of interest). Abbreviations: CP — cytoarchitectonic probability, H — hemisphere; DLPFC — dorsolateral prefrontal cortex; SF — superficial group; CA — cornu ammonis.
| Brain structure (CP) | H | Cluster size | Z (peak) | T (peak) | p (FWE) | MNI coord. (mm) |
||
|---|---|---|---|---|---|---|---|---|
| x | y | z | ||||||
| Amygdala (SF) |
L | 389 | 5.67 | 6.10 | <.001 | –21 | 2 | –14 |
| Amygdala (SF) |
R | 379 | 5.42 | 5.80 | <.001 | 26 | 0 | –15 |
| DLPFC |
L | 97 | 3.89 | 4.03 | 0.026 | –32 | 47 | 28 |
| Hippocampus (CA) | L | 480 | 4.47 | 4.68 | 0.001 | –26 | –6 | –17 |
| Hippocampus (CA) | R | 367 | 4.96 | 5.25 | <.001 | 27 | –4 | –17 |
3.4. Correlation analysis
Correlation analysis revealed a significant positive correlation between NegAff score and local gray matter volume in the left (Spearman's rho = .43, p< .001) and right DLPFC (Spearman's rho = .458, p< .001) in the H1stR group (see Fig. 2). Furthermore, a trend-wise positive correlation between the SCL-Depr score and local gray matter volume in the right hippocampus (Spearman's rho = .23, p= .074) and left amygdala (Spearman's rho = .206, p = .102) has been observed. For HC subjects, no significant correlation was found.
Fig. 2.
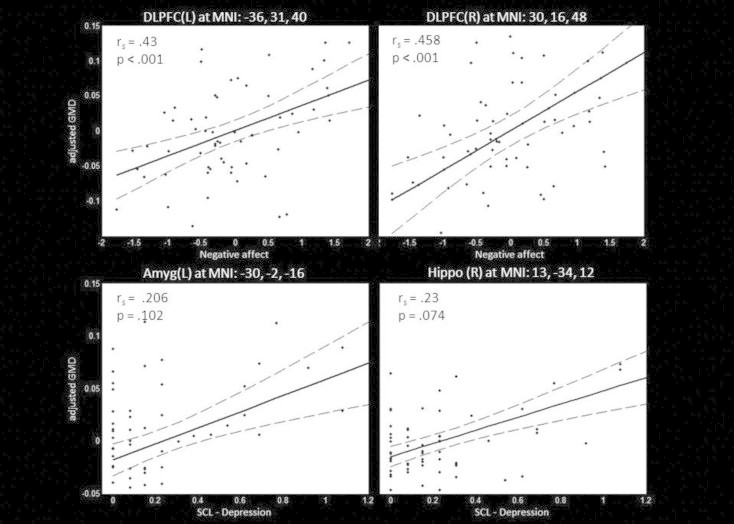
Correlation between SCL depression score and local gray matter volume in the left amygdala and right hippocampus as well as the negative affect composite score and bilateral DLPFC volume in H1stR (n= 63). Scatter plots between individual SCL — depression or negative affect score and gray matter volume at peak coordinate are shown. Additionally the post-hoc regression model (solid line) and its 95% confidence interval (dotted lines) are displayed. Abbreviations: rs – Spearman's rho; DLPFC — dorsolateral prefrontal cortex; Amyg — amygdala, Hippo — hippocampus.
4. Discussion
The main findings of our study are larger local gray matter volumes in the bilateral amygdala in healthy relatives of MDD patients compared to control subjects. With a statistically highly conservative approach (whole-brain analysis FWE corrected for multiple comparisons) this study proves brain volume differences in high-risk subjects. According to the literature, the evidence for volumetric differences in limbic regions is inconsistent in MDD patients (Bora et al., 2012). While one study in pediatric MDD (Rosso et al., 2005) as well as a meta-analysis of VBM results in first-episode MDD patients (Bora et al., 2012) showed relatively reduced local gray matter volume in the amygdala, larger amygdala volume has also been shown in samples of medicated MDD patients (Hamilton et al., 2008; Malykhin et al., 2012) as well as in early stages of MDD (Frodl et al., 2003, 2002; Lange and Irle, 2004; van Eijndhoven et al., 2009). In contrast, previous studies in high-risk subjects consistently reported a larger volume in the amygdala (Boccardi et al., 2010; Saleh et al., 2012), which is in line with our findings. Further, it is of high interest that recent studies also linked larger amygdala volume with psychological characteristics of depression, in terms of heightened negative affect (Holmes et al., 2012) and negative memory bias (Gerritsen et al., 2012), even in non-depressed subjects. These aspects are considered to be important vulnerability factors, e.g. frequent experience of ‘negative emotionality’ such as anxiety, low mood, and hostility is characteristic of the personality trait of neuroticism which is a well-known risk factor for MDD (Kendler et al., 2004; Steunenberg et al., 2006). In line with these findings, it has been shown that unaffected twins of MDD patients have an increased tendency to display negative affect in response to minor stressors in daily life (Wichers et al., 2007) and show higher stress sensitivity (Wichers et al., 2009) and that unaffected relatives differ from the standard population in terms of neural correlates of inhibition of negative emotional information (Lisiecka et al., 2012). Albeit the present study did not find any significant relationship between amygdala volume and experience of negative affect and only a trend-wise relation to subclinical depressive symptoms, we found a significant positive correlation of the experience of negative affect and bilateral DLPFC volume in the H1stR group, which was not present in the HC subjects.
In non-human primates, larger DLPFC volume and thickness were related to resilience to stress exposure, which in turn has been linked to emotional competences in humans (Schneider et al, 2013). Considering the close functional relationship between the DLPFC and amygdala, it is of interest that also on a functional level the DLPFC has been well-documented to be involved in emotion regulation in terms of showing increased activity during, e.g. reappraisal of negative events and suppression of negative memories (Goldin et al., 2008). Thus, the amygdala–prefrontal cortex circuitry is central to the emotional processing of biologically salient stimuli, memory formation and response regulation (Kim et al., 2011), important functions that are altered in MDD (Hamilton and Gotlib, 2008; Rosenblau et al., 2012). Further, fMRI studies showed that the functional relationship between the amygdala and the DLPFC is decreased in depression (Anand et al., 2005; Dannlowski et al., 2009; Siegle et al., 2007). Thus, the larger gray matter volume in the amygdalae and the correlation between DLPFC gray matter volume and the experience of negative affect might be provoked by more intense affective processes in the amygdala as well as more demanding top down regulation of these processes by the DLPFC. Taking the findings together, we conclude that the found structural brain differences in the amygdala might reflect an increased vulnerability for the onset of MDD in healthy first-degree relatives. To further understand the role of the amygdala in the etiology of depression, non-MR-related findings should also be taken into account, like post-mortem neuromorphometric and histopathological investigations (Manji et al., 2001).
Additionally, our region-of-interest analyses methodologically followed previous studies in this field and identified altered gray matter volumes in relatives of MDD patients in regions also highlighted by previous work: earlier studies found group differences in the amygdala (Boccardi et al., 2010; Saleh et al., 2012), the hippocampus (Amico et al., 2011; Baaré et al., 2010; Carballedo et al., 2012; Chen et al., 2010; de Geus et al., 2007; Rao et al., 2010) and the DLPFC (Amico et al., 2011; Carballedo et al., 2012) by means of region of interest VBM analyses and manual tracing methods respectively. However, whereas a larger amygdala volume in our H1stR participants is in line with previous studies (Boccardi et al., 2010; Saleh et al., 2012), we also found larger volume in the hippocampus as well as the DLPFC which is in contrast to the previous literature. Given the methodological differences in sample size and sample characteristics, like the definition of high-risk, further studies have to specify the direction and the precise role of DLPFC and hippocampal volume in MDD etiology. On the one hand, reduced hippocampal volumes were determined in subjects with different risk factors related to depression (Chen et al., 2010; Dannlowski et al., 2012; Teicher et al., 2012). On the other hand, pointing to state-dependent effects, reduced hippocampal volumes can be abolished by antidepressant treatment (Arnone et al., 2013; Nordanskog et al., 2010; Tendolkar et al., 2013).
Limitations of our study arise from the question of how structural alterations influence brain function in terms of modulating the probability of MDD in high-risk populations. In this context, it is worthy to mention that the detailed relationship between altered brain structure and its function is not fully understood, i.e. changes in local gray matter volume might be due to various processes. For example, heightened gray matter volume as described might point to a more ineffective functional state in the respective brain system. Evidence from animal studies points to a variability in local gray matter volume in amygdalar nuclei related to neuropathic pain and depressive symptoms (Gonçalves et al., 2008). Further, volumetric changes might also be related to neurochemical alterations, as discussed for MDD — like GABAergic deficits (Luscher et al., 2011), which were also linked to chronic deficits in neurotrophic support in mice models (Duman et al., 2000). Further, we conducted a cross-sectional analysis. Longitudinal analyses assessing brain volume before and after illness onset are needed to underline the importance of neurobiological markers of vulnerability for MDD. Moreover, we do not know whether the studied high-risk subjects are indeed carriers of genetic risk factors for MDD. H1stR share approximately 50% of common genetic variants related to the disorder with their affected family members, in addition to a degree of shared early environment. Of course we cannot determine which specific variants the studied high-risk subjects carry, given the limited number of genome-wide supported variants associated with MDD, as well as we do not know the specific ratio within our group of H1stR subjects which develop a major depressive episode in the future. Since MDD does manifest over the whole lifespan, it is also not possible to reliably estimate the probability of MDD manifestation in the studied sample. However, the close degree of kinship of our H1stR subjects to the affected family members suggests a high level of genetic similarity with the MDD relatives.
Besides these limitations, the strengths of this study include the fact that it was conducted on a representative sample of 63 subjects per group and is therefore less likely to be affected by biases associated with convenience sampling or clinical populations, which is also an important advantage of the used high-risk approach. We advanced evidence in this field by applying very conservative statistical thresholds and reporting whole brain FWE-corrected results as well as followed former research strategies by replicating previous studies. Thus, it is very likely that the observed larger volume in the amygdalae in healthy H1stR subjects is a reliable and valid finding and may represent a vulnerability factor for developing MDD. At this point, future research has to replicate whether volumetric alterations depict an endophenotype for MDD.
Disclosure
The first authors had full access to all of the data in the study and take responsibility for the integrity of the data and the accuracy of the data analysis.
Source of funding
Funding for this study was provided by the German Ministry for Education and Research (BMBF) grant NGFNplus MooDS (01 GS 08148). The funding source was not involved in study design, the collection, analysis and interpretation of the presented data as well as writing of the report or in the decision to submit the article for publication. Further, the authors of this article declare no financial or other conflicts of interest.
Acknowledgment
We thank Josephine Klaembt, Claudia Schütz and Carolin Wackerhagen for help with data acquisition and Phöbe Schmierer for assistance in data analysis.
Appendix A. Supplementary Material
Supplementary material associated with this article can be found, in the online version, at http://dx.doi.org/10.1016/j.nicl.2014.05.015.
Appendix A. Supplementary Materials
Supplementary materials for Larger amygdala volume in first-degree relatives of patients with major depression.
References
- Amico F., Meisenzahl E., Koutsouleris N., Reiser M., Möller H.-J., Frodl T. Structural MRI correlates for vulnerability and resilience to major depressive disorder. Journal of Psychiatry & Neuroscience: JPN. 2011;36:15–22. doi: 10.1503/jpn.090186. 20964952 [DOI] [PMC free article] [PubMed] [Google Scholar]
- Amunts K., Kedo O., Kindler M., Pieperhoff P., Mohlberg H., Shah N.J., Habel U., Schneider F., Zilles K. Cytoarchitectonic mapping of the human amygdala, hippocampal region and entorhinal cortex: intersubject variability and probability maps. Anatomy and Embryology. 2005;210:343–352. doi: 10.1007/s00429-005-0025-5. 16208455 [DOI] [PubMed] [Google Scholar]
- Anand A., Li Y., Wang Y., Wu J., Gao S., Bukhari L., Mathews V.P., Kalnin A., Lowe M.J. Activity and connectivity of brain mood regulating circuit in depression: a functional magnetic resonance study. Biological Psychiatry. 2005;57:1079–1088. doi: 10.1016/j.biopsych.2005.02.021. 15866546 [DOI] [PubMed] [Google Scholar]
- Arnone D., McIntosh A.M., Ebmeier K.P., Munafò M.R., Anderson I.M. Magnetic resonance imaging studies in unipolar depression: systematic review and meta-regression analyses. European Neuropsychopharmacology: the Journal of the European College of Neuropsychopharmacology. 2012;22:1–16. doi: 10.1016/j.euroneuro.2011.05.003. 21723712 [DOI] [PubMed] [Google Scholar]
- Arnone D., McKie S., Elliott R., Juhasz G., Thomas E.J., Downey D., Williams S., Deakin J.F.W., Anderson I.M. State-dependent changes in hippocampal grey matter in depression. Molecular Psychiatry. 2013;18:1265–1272. doi: 10.1038/mp.2012.150. 23128153 [DOI] [PubMed] [Google Scholar]
- Ashburner J. A fast diffeomorphic image registration algorithm. Neuroimage. 2007;38:95–113. doi: 10.1016/j.neuroimage.2007.07.007. 17761438 [DOI] [PubMed] [Google Scholar]
- Baaré W.F.C., Vinberg M., Knudsen G.M., Paulson O.B., Langkilde A.R., Jernigan T.L., Kessing L.V. Hippocampal volume changes in healthy subjects at risk of unipolar depression. Journal of Psychiatric Research. 2010;44:655–662. doi: 10.1016/j.jpsychires.2009.12.009. 20096419 [DOI] [PubMed] [Google Scholar]
- Boccardi M., Almici M., Bresciani L., Caroli A., Bonetti M., Monchieri S., Gennarelli M., Frisoni G.B. Clinical and medial temporal features in a family with mood disorders. Neuroscience Letters. 2010;468:93–97. doi: 10.1016/j.neulet.2009.10.067. 19874870 [DOI] [PubMed] [Google Scholar]
- Bora E., Fornito A., Pantelis C., Yücel M. Gray matter abnormalities in major depressive disorder: a meta-analysis of voxel based morphometry studies. Journal of Affective Disorders. 2012;138:9–18. doi: 10.1016/j.jad.2011.03.049. 21511342 [DOI] [PubMed] [Google Scholar]
- Burke H.M., Davis M.C., Otte C., Mohr D.C. Depression and cortisol responses to psychological stress: a meta-analysis. Psychoneuroendocrinology. 2005;30:846–856. doi: 10.1016/j.psyneuen.2005.02.010. 15961250 [DOI] [PubMed] [Google Scholar]
- Carballedo A., Lisiecka D., Fagan A., Saleh K., Ferguson Y., Connolly G., Meaney J., Frodl T. Early life adversity is associated with brain changes in subjects at family risk for depression. World Journal of Biological Psychiatry: the Official Journal of the World Federation of Societies of Biological Psychiatry. 2012;13:569–578. doi: 10.3109/15622975.2012.661079. 22515408 [DOI] [PubMed] [Google Scholar]
- Chen M.C., Hamilton J.P., Gotlib I.H. Decreased hippocampal volume in healthy girls at risk of depression. Archives of General Psychiatry. 2010;67:270–276. doi: 10.1001/archgenpsychiatry.2009.202. 20194827 [DOI] [PMC free article] [PubMed] [Google Scholar]
- Cloninger C.R. The Temperament and Character Inventory (TCI): A Guide to Its Development and Use. Center for Psychobiology of Personality, Washington University; St. Louis, MO.: 1994. [Google Scholar]
- Costa P.T., McCrae R.R. Revised NEO Personality Inventory (NEO-PI-R) and NEO Five-Factor Inventory (NEO-FFI) Professional Manual. Psychological Assessment Resources; Odessa, FL: 1992. [Google Scholar]
- Dannlowski U., Ohrmann P., Konrad C., Domschke K., Bauer J., Kugel H., Hohoff C., Schöning S., Kersting A., Baune B.T., Mortensen L.S., Arolt V., Zwitserlood P., Deckert J., Heindel W., Suslow T. Reduced amygdala–prefrontal coupling in major depression: association with MAOA genotype and illness severity. International Journal of Neuropsychopharmacology/Official Scientific Journal of the Collegium Internationale Neuropsychopharmacologicum (CINP) 2009;12:11–22. doi: 10.1017/S1461145708008973. 18544183 [DOI] [PubMed] [Google Scholar]
- Dannlowski U., Stuhrmann A., Beutelmann V., Zwanzger P., Lenzen T., Grotegerd D., Domschke K., Hohoff C., Ohrmann P., Bauer J., Lindner C., Postert C., Konrad C., Arolt V., Heindel W., Suslow T., Kugel H. Limbic scars: long-term consequences of childhood maltreatment revealed by functional and structural magnetic resonance imaging. Biological Psychiatry. 2012;71:286–293. doi: 10.1016/j.biopsych.2011.10.021. 22112927 [DOI] [PubMed] [Google Scholar]
- De Geus E.J.C., Van’t Ent D., Wolfensberger S.P.A., Heutink P., Hoogendijk W.J.G., Boomsma D.I., Veltman D.J. Intrapair differences in hippocampal volume in monozygotic twins discordant for the risk for anxiety and depression. Biological Psychiatry. 2007;61:1062–1071. doi: 10.1016/j.biopsych.2006.07.026. 17137562 [DOI] [PubMed] [Google Scholar]
- Derogatis, L.R., SCL-90-R: Administration, Scoring and Procedures Manual — II for the Revised Version (SCL-90-R; German Version: G.H. Franke, 2002), second edition (1983). Clinical Psychometric Research, Towson, MD.
- Drevets W.C., Price J.L., Furey M.L. Brain structural and functional abnormalities in mood disorders: implications for neurocircuitry models of depression. Brain Structure & Function. 2008;213:93–118. doi: 10.1007/s00429-008-0189-x. 18704495 [DOI] [PMC free article] [PubMed] [Google Scholar]
- Duman R.S., Malberg J., Nakagawa S., D’Sa C. Neuronal plasticity and survival in mood disorders. Biological Psychiatry. 2000;48:732–739. doi: 10.1016/s0006-3223(00)00935-5. 11063970 [DOI] [PubMed] [Google Scholar]
- Eickhoff S.B., Stephan K.E., Mohlberg H., Grefkes C., Fink G.R., Amunts K., Zilles K. A new SPM toolbox for combining probabilistic cytoarchitectonic maps and functional imaging data. NeuroImage. 2005;25:1325–1335. doi: 10.1016/j.neuroimage.2004.12.034. 15850749 [DOI] [PubMed] [Google Scholar]
- Esslinger C., Walter H., Kirsch P., Erk S., Schnell K., Arnold C., Haddad L., Mier D., Opitz von Boberfeld C., Raab K., Witt S.H., Rietschel M., Cichon S., Meyer-Lindenberg A. Neural mechanisms of a genome-wide supported psychosis variant. Science (New York, N.Y.) 2009;324:605. doi: 10.1126/science.1167768. 19407193 [DOI] [PubMed] [Google Scholar]
- First, M.B., Spitzer, R.L., Gibbon, M., Williams, J.B.W., Structured Clinical Interview for DSM-IV-TR axis I disorders, research version, patient edition. (SCID-I/P; German version: H.-U. Wittchen, M. Zaudig & T. Fydrich, 1997). Biometrics Research (2002). New York State Psychiatric Institute, New York.
- Friedman L., Glover G.H. Report on a multicenter fMRI quality assurance protocol. Journal of Magnetic Resonance Imaging: JMRI. 2006;23:827–839. doi: 10.1002/jmri.20583. 16649196 [DOI] [PubMed] [Google Scholar]
- Frodl T., Meisenzahl E., Zetzsche T., Bottlender R., Born C., Groll C., Jäger M., Leinsinger G., Hahn K., Möller H.-J. Enlargement of the amygdala in patients with a first episode of major depression. Biological Psychiatry. 2002;51:708–714. doi: 10.1016/s0006-3223(01)01359-2. 11983184 [DOI] [PubMed] [Google Scholar]
- Frodl T., Meisenzahl E.M., Zetzsche T., Born C., Jäger M., Groll C., Bottlender R., Leinsinger G., Möller H.-J. Larger amygdala volumes in first depressive episode as compared to recurrent major depression and healthy control subjects. Biological Psychiatry. 2003;53:338–344. doi: 10.1016/s0006-3223(02)01474-9. 12586453 [DOI] [PubMed] [Google Scholar]
- Frodl T., Möller H.-J., Meisenzahl E. Neuroimaging genetics: new perspectives in research on major depression? Acta Psychiatrica Scandinavica. 2008;118:363–372. doi: 10.1111/j.1600-0447.2008.01225.x. 18644006 [DOI] [PubMed] [Google Scholar]
- Gerritsen L., Rijpkema M., van Oostrom I., Buitelaar J., Franke B., Fernández G., Tendolkar I. Amygdala to hippocampal volume ratio is associated with negative memory bias in healthy subjects. Psychological Medicine. 2012;42:335–343. doi: 10.1017/S003329171100122X. 21740626 [DOI] [PubMed] [Google Scholar]
- Goldin P.R., McRae K., Ramel W., Gross J.J. The neural bases of emotion regulation: reappraisal and suppression of negative emotion. Biological Psychiatry. 2008;63:577–586. doi: 10.1016/j.biopsych.2007.05.031. 17888411 [DOI] [PMC free article] [PubMed] [Google Scholar]
- Gonçalves L., Silva R., Pinto-Ribeiro F., Pêgo J.M., Bessa J.M., Pertovaara A., Sousa N., Almeida A. Neuropathic pain is associated with depressive behaviour and induces neuroplasticity in the amygdala of the rat. Experimental Neurology. 2008;213:48–56. doi: 10.1016/j.expneurol.2008.04.043. 18599044 [DOI] [PubMed] [Google Scholar]
- Gottesman I.I., Gould T.D. The endophenotype concept in psychiatry: etymology and strategic intentions. American Journal of Psychiatry. 2003;160:636–645. doi: 10.1176/appi.ajp.160.4.636. 12668349 [DOI] [PubMed] [Google Scholar]
- Hamilton J.P., Gotlib I.H. Neural substrates of increased memory sensitivity for negative stimuli in major depression. Biological Psychiatry. 2008;63:1155–1162. doi: 10.1016/j.biopsych.2007.12.015. 18281017 [DOI] [PMC free article] [PubMed] [Google Scholar]
- Hamilton J.P., Siemer M., Gotlib I.H. Amygdala volume in major depressive disorder: a meta-analysis of magnetic resonance imaging studies. Molecular Psychiatry. 2008;13:993–1000. doi: 10.1038/mp.2008.57. 18504424 [DOI] [PMC free article] [PubMed] [Google Scholar]
- Hollon S.D., Shelton R.C., Wisniewski S., Warden D., Biggs M.M., Friedman E.S., Husain M., Kupfer D.J., Nierenberg A.a., Petersen T.J., Shores-Wilson K., Rush A.J. Presenting characteristics of depressed outpatients as a function of recurrence: preliminary findings from the STAR*D clinical trial. Journal of Psychiatric Research. 2006;40:59–69. doi: 10.1016/j.jpsychires.2005.07.008. 16243357 [DOI] [PMC free article] [PubMed] [Google Scholar]
- Holmes A.J., Lee P.H., Hollinshead M.O., Bakst L., Roffman J.L., Smoller J.W., Buckner R.L. Individual differences in amygdala-medial prefrontal anatomy link negative affect, impaired social functioning, and polygenic depression risk. Journal of Neuroscience: the Official Journal of the Society for Neuroscience. 2012;32:18087–18100. doi: 10.1523/JNEUROSCI.2531-12.2012. 23238724 [DOI] [PMC free article] [PubMed] [Google Scholar]
- Kendler K.S., Kuhn J., Prescott C.A. The interrelationship of neuroticism, sex, and stressful life events in the prediction of episodes of major depression. American Journal of Psychiatry. 2004;161:631–636. doi: 10.1176/appi.ajp.161.4.631. 15056508 [DOI] [PubMed] [Google Scholar]
- Kim M.J., Loucks R.A., Palmer A.L., Brown A.C., Solomon K.M., Marchante A.N., Whalen P.J. The structural and functional connectivity of the amygdala: from normal emotion to pathological anxiety. Behavioural Brain Research. 2011;223:403–410. doi: 10.1016/j.bbr.2011.04.025. 21536077 [DOI] [PMC free article] [PubMed] [Google Scholar]
- Lange C., Irle E. Enlarged amygdala volume and reduced hippocampal volume in young women with major depression. Psychological Medicine. 2004;34:1059–1064. doi: 10.1017/s0033291703001806. 15554576 [DOI] [PubMed] [Google Scholar]
- Lehrl S. Mehrfachwahl-Wortschatz-Intelligenztest MWT-B. fifth edition. Spitta Verlag; Balingen: 2005. [Google Scholar]
- Lisiecka D.M., Carballedo A., Fagan A.J., Connolly G., Meaney J., Frodl T. Altered inhibition of negative emotions in subjects at family risk of major depressive disorder. Journal of Psychiatric Research. 2012;46:181–188. doi: 10.1016/j.jpsychires.2011.10.010. 22078646 [DOI] [PubMed] [Google Scholar]
- Luscher B., Shen Q., Sahir N. The GABAergic deficit hypothesis of major depressive disorder. Molecular Psychiatry. 2011;16:383–406. doi: 10.1038/mp.2010.120. 21079608 [DOI] [PMC free article] [PubMed] [Google Scholar]
- Malykhin N.V., Carter R., Hegadoren K.M., Seres P., Coupland N.J. Fronto-limbic volumetric changes in major depressive disorder. Journal of Affective Disorders. 2012;136:1104–1113. doi: 10.1016/j.jad.2011.10.038. 22134041 [DOI] [PubMed] [Google Scholar]
- Manji H.K., Drevets W.C., Charney D.S. The cellular neurobiology of depression. Nature Medicine. 2001;7:541–547. doi: 10.1038/87865. 11329053 [DOI] [PubMed] [Google Scholar]
- Nordanskog P., Dahlstrand U., Larsson M.R., Larsson E.-M., Knutsson L., Johanson A. Increase in hippocampal volume after electroconvulsive therapy in patients with depression: a volumetric magnetic resonance imaging study. Journal of ECT. 2010;26:62–67. doi: 10.1097/YCT.0b013e3181a95da8. 20190603 [DOI] [PubMed] [Google Scholar]
- Oldfield R.C. The assessment and analysis of handedness: the Edinburgh inventory. Neuropsychologia. 1971;9:97–113. doi: 10.1016/0028-3932(71)90067-4. 5146491 [DOI] [PubMed] [Google Scholar]
- Palazidou E. The neurobiology of depression. British Medical Bulletin. 2012;101:127–145. doi: 10.1093/bmb/lds004. 22334281 [DOI] [PubMed] [Google Scholar]
- Price J.L., Drevets W.C. Neural circuits underlying the pathophysiology of mood disorders. Trends in Cognitive Sciences. 2012;16:61–71. doi: 10.1016/j.tics.2011.12.011. 22197477 [DOI] [PubMed] [Google Scholar]
- Rao U., Chen L.-A., Bidesi A.S., Shad M.U., Thomas M.A., Hammen C.L. Hippocampal changes associated with early-life adversity and vulnerability to depression. Biological Psychiatry. 2010;67:357–364. doi: 10.1016/j.biopsych.2009.10.017. 20015483 [DOI] [PMC free article] [PubMed] [Google Scholar]
- Rosenblau G., Sterzer P., Stoy M., Park S., Friedel E., Heinz A., Pilhatsch M., Bauer M., Ströhle A. Functional neuroanatomy of emotion processing in major depressive disorder is altered after successful antidepressant therapy. Journal of Psychopharmacology (Oxford, England) 2012;26:1424–1433. doi: 10.1177/0269881112450779. 22767373 [DOI] [PubMed] [Google Scholar]
- Rosso I.M., Cintron C.M., Steingard R.J., Renshaw P.F., Young A.D., Yurgelun-Todd D.A. Amygdala and hippocampus volumes in pediatric major depression. Biological Psychiatry. 2005;57:21–26. doi: 10.1016/j.biopsych.2004.10.027. 15607296 [DOI] [PubMed] [Google Scholar]
- Saleh K., Carballedo A., Lisiecka D., Fagan A.J., Connolly G., Boyle G., Frodl T. Impact of family history and depression on amygdala volume. Psychiatry Research. 2012;203:24–30. doi: 10.1016/j.pscychresns.2011.10.004. 22867951 [DOI] [PubMed] [Google Scholar]
- Schneider T.R., Lyons J.B., Khazon S. Emotional intelligence and resilience. Personality and Individual Differences. 2013;55:909–914. [Google Scholar]
- Siegle G.J., Thompson W., Carter C.S., Steinhauer S.R., Thase M.E. Increased amygdala and decreased dorsolateral prefrontal BOLD responses in unipolar depression: related and independent features. Biological Psychiatry. 2007;61:198–209. doi: 10.1016/j.biopsych.2006.05.048. 17027931 [DOI] [PubMed] [Google Scholar]
- Spielberger C.D. State–Trait Anxiety Inventory: Bibliography. second edition. Consulting Psychologists Press; Palo Alto, CA: 1989. [Google Scholar]
- Steunenberg B., Beekman A.T.F., Deeg D.J.H., Kerkhof A.J.F.M. Personality and the onset of depression in late life. Journal of Affective Disorders. 2006;92:243–251. doi: 10.1016/j.jad.2006.02.003. 16545466 [DOI] [PubMed] [Google Scholar]
- Teicher M.H., Anderson C.M., Polcari A. Childhood maltreatment is associated with reduced volume in the hippocampal subfields CA3, dentate gyrus, and subiculum. Proceedings of the National Academy of Sciences of the United States of America. 2012;109:E563–E572. doi: 10.1073/pnas.1115396109. 22331913 [DOI] [PMC free article] [PubMed] [Google Scholar]
- Tendolkar I., van Beek M., van Oostrom I., Mulder M., Janzing J., Voshaar R.O., van Eijndhoven P. Electroconvulsive therapy increases hippocampal and amygdala volume in therapy refractory depression: a longitudinal pilot study. Psychiatry Research. 2013;214:197–203. doi: 10.1016/j.pscychresns.2013.09.004. 24090511 [DOI] [PubMed] [Google Scholar]
- Tzourio-Mazoyer N., Landeau B., Papathanassiou D., Crivello F., Etard O., Delcroix N., Mazoyer B., Joliot M. Automated anatomical labeling of activations in SPM using a macroscopic anatomical parcellation of the MNI MRI single-subject brain. NeuroImage. 2002;15:273–289. doi: 10.1006/nimg.2001.0978. 11771995 [DOI] [PubMed] [Google Scholar]
- Van Eijndhoven P., van Wingen G., van Oijen K., Rijpkema M., Goraj B., Jan Verkes R., Oude Voshaar R., Fernández G., Buitelaar J., Tendolkar I. Amygdala volume marks the acute state in the early course of depression. Biological Psychiatry. 2009;65:812–818. doi: 10.1016/j.biopsych.2008.10.027. 19028381 [DOI] [PubMed] [Google Scholar]
- Wichers M., Geschwind N., Jacobs N., Kenis G., Peeters F., Derom C., Thiery E., Delespaul P., van Os J. Transition from stress sensitivity to a depressive state: longitudinal twin study. British Journal of Psychiatry: the Journal of Mental Science. 2009;195:498–503. doi: 10.1192/bjp.bp.108.056853. 19949197 [DOI] [PubMed] [Google Scholar]
- Wichers M., Myin-Germeys I., Jacobs N., Peeters F., Kenis G., Derom C., Vlietinck R., Delespaul P., Van Os J. Genetic risk of depression and stress-induced negative affect in daily life. British Journal of Psychiatry: the Journal of Mental Science. 2007;191:218–223. doi: 10.1192/bjp.bp.106.032201. 17766761 [DOI] [PubMed] [Google Scholar]
- World Health Organization. Global health risks: Mortality and burden of disease attributable to selected major risks. [WWW Document]2009
Associated Data
This section collects any data citations, data availability statements, or supplementary materials included in this article.
Supplementary Materials
Supplementary materials for Larger amygdala volume in first-degree relatives of patients with major depression.