Abstract
Brain glucose hypometabolism has been observed in Alzheimer’s disease (AD) patients, and is detected with 18F radiolabelled glucose, using positron emission tomography. A pathological hallmark of AD is deposition of brain β-amyloid plaques that may influence cerebral glucose metabolism. The five times familial AD (5XFAD) mouse is a model of brain amyloidosis exhibiting AD-like phenotypes. This study examines brain β-amyloid plaque deposition and 18FDG uptake, to search for an early biomarker distinguishing 5XFAD from wild-type mice. Thus, brain 18FDG uptake and plaque deposition was studied in these mice at age 2, 5 and 13 months. The 5XFAD mice demonstrated significantly reduced brain 18FDG uptake at 13 months relative to wild-type controls but not in younger mice, despite substantial β-amyloid plaque deposition. However, by comparing the ratio of uptake values for glucose in different regions in the same brain, 5XFAD mice could be distinguished from controls at age 2 months. This method of measuring altered glucose metabolism may represent an early biomarker for the progression of amyloid deposition in the brain. We conclude that brain 18FDG uptake can be a sensitive biomarker for early detection of abnormal metabolism in the 5XFAD mouse when alternative relative uptake values are utilized.
Keywords: Alzheimer's disease, β-amyloid, computed tomography, glucose metabolism, magnetic resonance imaging, positron emission tomography, standardized uptake value, Tg6799.
INTRODUCTION
Alzheimer’s disease (AD) is a neurodegenerative disorder characterized by cognitive and behavioural symptoms that are a consequence of structural and functional brain abnormalities including deposition of β-amyloid (Aβ) plaques and tau neurofibrillary tangles [1]. The reduction of brain function in AD can be observed in vivo by using a radiolabelled glucose analogue, 2-deoxy-2-(18F)fluoro-D-glucose (18FDG), followed by positron emission tomography (PET) scanning. In AD, deficits in glucose uptake classically occur in temporal, parietal, posterior cingulate and inferior parietal cortices [2, 3], indicating dysfunction or death of neurons in these areas. As AD progresses, the decrease in glucose metabolism is indicative of the clinical severity of the disease [4].
A number of pathophysiological mechanisms have been postulated for cell death in AD. These include deposition of proteins, such as Aβ and tau, as well as processes such as neuroinflammation [5]. Under the amyloid cascade hypothesis [6], the presence and aggregation of Aβ leads to events that result in neurotoxicity and neurodegeneration in AD.To further examine the role of Aβ deposition in AD pathogenesis, transgenic mouse models of brain amyloidosis have been developed, based on familial AD (FAD) mutations, that result in brain Aβ accumulation. Similar to human AD, these animals have demonstrated synaptic loss [7], mitochondrial abnormalities [8, 9], activated microglia/neuroinflammation [7, 10] and neuronal loss [7]. It has been postulated that deposition of Aβ and its deleterious effects on neurons may result in decreased glucose metabolism in AD and, thus, the effect of Aβ deposition on brain 18FDG uptake can be explored using mouse models [11].
A number of mouse models of brain Aβ deposition have been developed using a combination of mutations found in FAD [12]. These include mutations in the amyloid precursor protein (APP) or proteins involved in its processing such as presenilin 1 (PS1) and presenilin 2 (PS2). Investigations of these animal models have begun to chronicle the patterns of changes in brain glucose metabolism as a result of amyloidosis. However, there is widespread variability in 18FDG uptake reported in these models. For example, the PDAPP (APPV717F) and PSAPP (APPK670N/M671L, PS1M146L), mouse models demonstrated hypometabolism in regions such as the cingulate cortex [11, 13, 14]. In contrast, the Tg2576 (APPK670N/M671L) mouse was reported to exhibit glucose hypermetabolism at a young age but at older age, there was no detectable difference in 18FDG uptake [15, 16]. On the other hand, some mouse models, such as APP/PS1 (APPK670N/M671L, V717I) and PS1M146L) have been observed to exhibit both hypometabolism and hypermetabolism of glucose in different brain regions [17, 18]. Thus, no clear association between brain amyloidosis and glucose metabolism has emerged from these studies.
The 5XFAD mouse model overexpresses human APP(695) with the Swedish (K670N, M671L), Florida (I716V), and London (V717I) FAD mutations and human PS1 harbouring two FAD mutations, M146L and L286V. This mouse model of brain amyloidosis has a very aggressive course exhibiting Aβ deposition as early as ~2 months of age [7]. In addition, a number of similarities between this animal model and human AD have been documented, including loss of synaptic markers and cognitive impairment [7, 19, 20].
Brain glucose metabolism was reported to be elevated in 12-15 month old 5XFAD mice [10]. However, the progression of brain glucose metabolism across the lifespan of this mouse, and potential differences in specific brain regions, have not been examined. The effects of brain Aβ plaque deposition and glucose metabolism were therefore studied in quest for an early biomarker to distinguish 5XFAD from wild-type mice. The present cross sectional study examines both brain 18FDG uptake and plaque deposition in 5XFAD mice at 2, 5 and 13 months of age, relative to controls. Portions of this work have been presented in abstract form [21].
MATERIALS AND METHODS
Animals
Pairs of female wild-type (C57BL/6J x SJL/J F1, Stock Number: 100012-JAX) and male transgenic hemizygous 5XFAD mice (B6SJL-Tg (APPSwFlLon, PSEN1*M146L* L286V) 6799Vas/Mmjax, Stock Number: 006554-JAX) were obtained from Jackson Laboratory (Bar Harbor, ME). These mice were bred, and from the offspring, male transgenic hemizygous and male wild-type mice were used in this experiment. Mice were housed in same-sex groups of 2-4, within polyethylene cages (30 x 19 x 13 cm), containing a wood-chip bedding, a small polyethylene tube (4 cm diameter, 7.5 cm long), and were covered by a metal cage top and micro-isolator filter. Food (Purina rodent chow, #5001) and tap water were available ad libitum. Mice were housed in a temperature controlled vivarium (22 ± 1°C) with a 12:12 h reversed light/dark cycle, with lights off from 9:30 am – 9:30 pm. Imaging studies were performed during the dark phase of the light-dark cycle. Mice were cared for according to the guidelines set by the Canadian Council on Animal Care. A total of 26 5XFAD mice and 16 age-matched WT counterparts at 2 (5XFAD: n=7; WT: n=7), 5 (5XFAD: n=7; WT: n=4) and 13 (5XFAD: n=12; WT: n=5) months of age comprised the imaging groups for this study. All mice were genotyped for the APP and PS1 transgenes to ensure pure genetic background for AD mutations with polymerase chain reaction using tissue from the ears and the presence or absence of β-amyloid verified with immunohistochemistry.
Formal approval to conduct these experiments was obtained from the Dalhousie University Committee on Laboratory Animals.
PET-CT Imaging
The WT and age-matched 5XFAD mice were weighed immediately prior to the imaging procedure, restrained in a TailVeiner Restrainer (Braintree Scientific) and injected via the tail vein with 18F-FDG (573-829 µCi, in 140-160 µL saline). Uptake of the tracer occurred in conscious mice in a novel cage over 30 min under a heat lamp and in the presence of a motile battery powered mechanical mouse (Hurry Scurry Mouse, Toysmith) which the test mouse could interact with to facilitate uptake under controlled conditions. Mice were then anaesthetized with 3% isoflurane (in 100% oxygen) in an induction chamber and secured in prone position in a custom built, Magnetic Resonance (MR)-compatible animal tray with an integrated nosecone and bite bar. Mice were wrapped in a blanket on a heated bed and maintained under a continuous stream of isoflurane gas anesthetic (1.5-2%) and respiratory rate was monitored for the duration of the scan (SA Instruments Inc. Stony Brook, NY). The head region of the mouse was centered on a 37 mm axial field of view (FOV) and PET coincidence events were acquired in list mode over a 30 min scan period, with a LabPET4 pre-clinical PET/CT scanner (Trifoil Imaging, CA).
Immediately following PET scanning, for anatomical reference, a computed tomography (CT) image was performed in fly mode with a 70 kVp x-ray beam energy (160 µA beam current), 512 projections, 4 summed frames/projection, with 2×2 binning and a magnification of 2.26X, providing complete whole brain coverage in a 56 mm FOV. CT scan duration was approximately 8.5 min. Once imaging was completed, mice were immediately transported in the MR compatible bed to the MR scanner located in a room adjacent to the PET/CT scanner.
MR Imaging
All MR scans were performed at 3.0 T using a superconducting Magnex Scientific clinical MR “head only” scanner (Oxford, UK) retrofitted for small animal imaging (Magnex Scientific gradient coil, ID of 21 cm; maximum gradient strength of 400 mT/m) and interfaced with a Direct Drive spectrometer (Varian Inc., Palo Alto, CA). A 30 mm ID “Litzcage” quadrature RF coil (Doty Scientific, Columbia, SC), tuned to 128.8 MHz, was used as a transmit/receive volume coil for imaging. In vivo anatomical images were obtained using a 3D balanced steady-state free precession, (b-SSFP) imaging sequence (T2/T1-weighting) acquired in a sagittal readout. Repetition time (TR), echo time (TE), flip angle and bandwidth (BW) were optimized for best brain image quality. The sequence consisted of TR/TE = 9/4.5 ms, flip angle = 30°, 4 frequencies, 4 signal averages and BW = 40.3 kHz. A FOV of 22.1 mm × 22.1 mm × 22.1 mm with matrix dimensions 156 × 156 × 156 was used to acquire (142 μm)3 isotropic resolution images with full brain coverage (~61 min/scan). During imaging, respiratory rate and internal body temperature of the mice were monitored using an MR compatible physiological monitoring and gating system (SA Instruments Inc., Stony Brook, NY). The temperature of the mouse was maintained at 37±1 °C via temperature control feedback loop controlling an air heating system.
Image Processing
PET list-mode data were temporally histogrammed as a single timeframe and binned according to their line of response. Coincidence events were rebinned over a maximum span field of 31 oblique planes using a single slice rebinning algorithm. An iterative reconstruction approach was employed via a 2D Maximum-Likelihood Expectation Maximization (MLEM) algorithm, which was performed 100 times and constrained to a 46 mm radial FOV. The resultant PET images yielded an effective isotropic resolution of 1.2 mm. Normalization correction (to account for count-rate variability of sensors) and quantitative calibrations were performed weekly for the duration of the study and these corrections were applied in the reconstruction of the data sets. Processing of PET list mode data, reconstruction and corrections were performed in LabPET software.
CT images were reconstructed with a 512 × 512 × 512 image matrix over a 56 mm FOV using the built-in optimum noise reconstruction procedure provided with the Triumph XO CT acquisition software, yielding images with (102 μm)3 isotropic resolution. Fusion of PET and CT images was achieved using the VividTM Image Analysis Platform (Trifoil Imaging, CA and Visualization Sciences Group, MA), which aligns and overlays the common coordinate frames of each modality. Images were assessed by visual inspection by a single observer to ensure accurate fusion results. PET data was then interpolated to 102 µm in each plane (resolution-matched to the CT). MR images underwent 3D maximum intensity projection (MIP) processing of 4 phase cycle frequencies, and resulting reconstructed images were zero-padded (interpolated to higher resolution grid to increase the effective resolution and image quality) in ImageJ (NIH, USA).
Whole Brain 18FDG Uptake Analysis
Whole brain 18FDG uptake was determined using Amira (Visualization Sciences Group, MA, USA). Briefly, PET/CT fused images were imported into Amira, the borders between the brain/skull interface were manually defined on each CT image which permitted selection of the entire brain volume within the skull. This generated a brain mask that was applied to the co-registered PET data. 18FDG uptake values are reported as standardized uptake values (SUV) which represents the mean activity values for each whole brain or parcellated structure, normalized to the injected dose per body weight of each individual animal [22].
Regional 18FDG Uptake Analysis
For region of interest (ROI) analysis of regional distributions of 18FDG uptake in the brain, the use of an MR-based 3D digital mouse atlas [23, 24] was employed and inter-modality registration between PET/CT/MRI was performed. Briefly, a semi-automated skull stripping algorithm using BrainSuite 11 (LONI UCLA) was performed on each mouse-specific MR image to remove all extraneous non-brain data. A linear, 6-parameter model rigid body registration was performed using Automated Image Registration 5.3.0 [25] between the skull stripped MR and the standard brain from which the digital atlas was derived. Subsequently, higher order non-linear spatial transformations (warping) of the standard brain to the mouse-specific MR images acquired in this study were carried out to either the 3rd or 5th order polynomial determined by visual inspection of resultant fits of the image sets. This provided the necessary transformations to be applied to the 3D digital mouse atlas. Visualization of the mouse-specific MR image and corresponding warped atlas mask overlay was carried out in Review [26] to assess the goodness of fit. PET/CT fused data, mouse-specific MR image data and the warped digital atlas were imported into AMIDE [27], and were manually aligned to the CT and PET image. ROI statistics were generated from the PET data for brain structures defined by the warped atlas mask for each animal, which included amygdala, basal forebrain, basal ganglia, cerebellum, hippocampus, hypothalamus, neocortex and thalamus. 18FDG uptake values are reported as SUVs.
Statistical Analysis
18FDG uptake values are presented as mean activity values for each whole brain or parcellated structure, normalized to the injected dose per body weight of each individual animal (SUV). Parametric analysis using unpaired t-tests of group means (5XFAD vs WT), at each age point, as well as removal of outlier uptake values (> 3 standard deviations from mean) followed by unpaired t-tests of group means was employed. Using this approach, two 5XFAD (2 and 13 months) and three WT (2, 5 and 13 months) animals were found to be outliers, leaving twenty four 5XFAD and thirteen WT animals for analysis. There was variability in the SUVs measured, and therefore, non-parametric approach for analysis, Mann-Whitney test, which makes no assumptions about the normality of distribution of the data was employed and were in general agreement with the parametric analysis for significant relationships. Differences between 5XFAD and WT were considered significant at p<0.05 (*) or p<0.01 (**). Since all statistical approaches employed for data analysis were in general agreement for significant relationships the results of the t-test analysis are reported. All data are presented as group means with bars representing standard error of the mean (SEM). All statistical measures were calculated with InStat 3 (GraphPad, La Jolla, CA).
β-Amyloid Immunohistochemistry
Following a 24 h period after MR imaging to allow decay of radioactivity, mice were euthanized by somnotol injection, perfused transcardially with saline (25 mL, 0.9% NaCl, 0.1% NaNO3) and 50 mL of 4% paraformaldehyde in 0.1 M phosphate buffer (PB, pH 7.4), the brains removed and post-fixed for 1 h. Brains were then immersed in 30% sucrose in PB with 0.05% sodium azide for several days for cryoprotection. Brains were frozen with dry ice and cut in 40 µm serial coronal sections on a Leica SM2000R microtome with Physitemp freezing stage and BFS-30TC controller. The sections were stained, using immunohistochemical methods for Aβ. Briefly, sections were rinsed for 30 min in PB pH 7.4, 5 min in 0.05 M PB, followed by distilled water (dH2O), and then gently shaken in 90% formic acid for 2 min for antigen retrieval [28]. Sections were rinsed 5 times in dH2O for 1 min each and 2 times in PB for 15 min. Sections were then placed in 0.3% H2O2 in PB for 30 min to quench endogenous peroxidase activity and rinsed again for 30 min in PB. Sections were then incubated in PB containing 0.1% Triton X-100, normal goat serum (1:100), and a polyclonal rabbit anti-Aβ antibody (1:400; 71-5800, Invitrogen, Camarillo, CA), specific for the 4- to 5-kDa amyloid peptide [29], for approximately 16 h at room temperature. After rinsing, sections were incubated in PB with 0.1% Triton X-100, biotinylated goat anti-rabbit secondary antibody (1:500), and normal goat serum (1:1000) for 1 h. After another rinse, sections were placed in PB with 0.1% Triton X-100 and Vectastain Elite ABC kit (1:182; PK-6100, Vector Laboratories, Burlingame, CA), according to the manufacturer’s instructions, for 1 h. Sections were rinsed and developed in a solution of PB containing 1.39 mM 3,3'- diaminobenzidine tetrahydrochloride (DAB). After 5 min, 50 µL of 0.3% H2O2 in dH2O was added per mL of DAB solution, and the sections were incubated for 5 min. The reaction was stopped by rinsing the sections in 0.01 M acetate buffer (pH 3.3). Sections were mounted onto glass slides, air-dried, rehydrated in dH2O, dehydrated in a series of ethanol washes, cleared in xylene and coverslipped.
Tissue Data Analysis
The stained mouse brain sections were analyzed and photographed using a Zeiss Axioplan 2 motorized microscope with a Zeiss Axiocam HRc digital camera using AxioVision 4.6 software (Carl Zeiss Canada Ltd., Toronto, Ontario, Canada). The photographs were assembled using Adobe Photoshop and the images were contrast enhanced and the brightness adjusted to a common background level.
The distribution and quantity of Aβ-positive plaques was determined in 5XFAD mice at 2 (n=3), 5 (n=3) and 13 (n=8) months of age and on average, 8 sections per brain were analyzed for plaque load. Plaque loads were quantified using ImageJ (National Institutes of Health) and recorded as a percentage of the total area covered by pathology, as described elsewhere [30]. An intensity threshold level was set such that stained plaques, but not background, was selected. The areas of interest were parcellated according to a mouse brain atlas [31] and measured for the area covered by plaque staining. For a given area, the total area of plaque load was added from each section measured and divided by the total area of that region. The percent plaque load for each region was then averaged from all mice in a given age group and compared between the different age groups.
RESULTS
Brain 18FDG Uptake
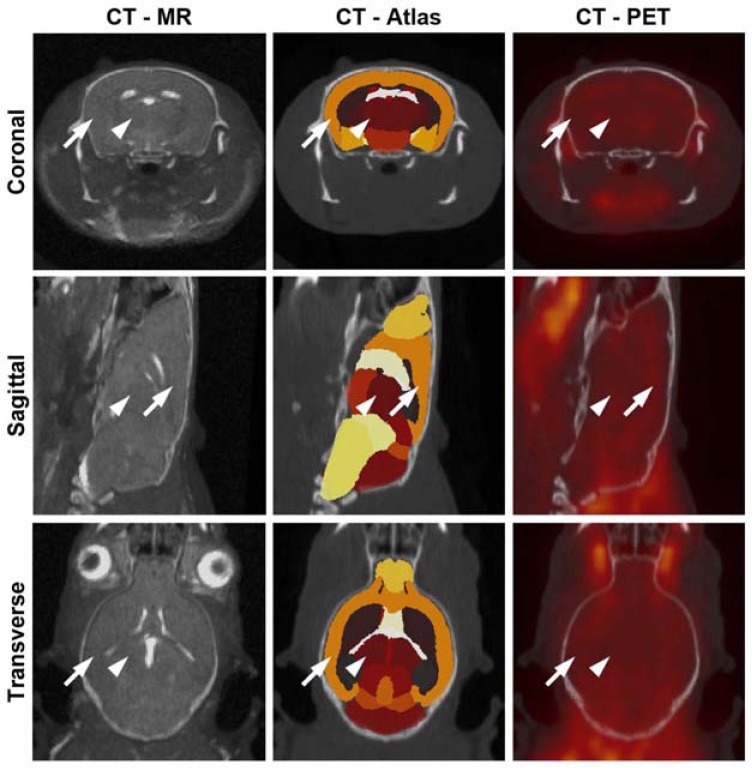
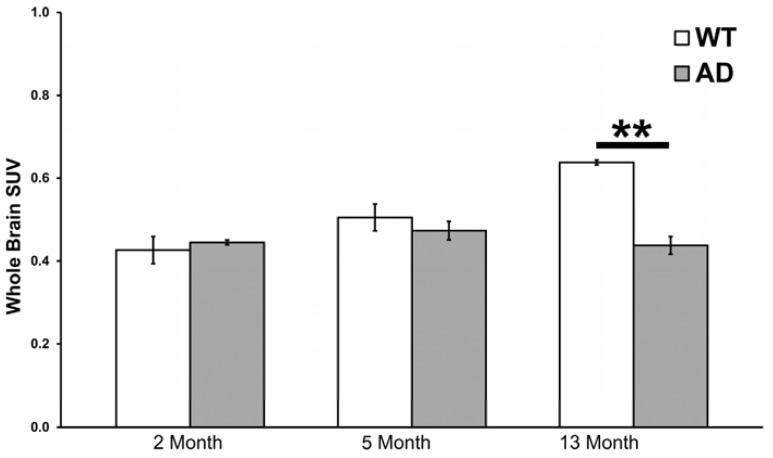
Data from CT, PET and MRI were co-registered to provide uptake of 18FDG in whole brain as well as parcellated anatomical regions (Fig. 1). Uptake of 18FDG was quantified in whole brain as SUVs (standardized uptake values, see methods) for each 5XFAD and WT mouse in the 2, 5 and 13 month age groups (Fig. 2). In this treatment, the 13 month 5XFAD animals demonstrated significantly lower 18FDG uptake than WT animals (t(11)=8.99, p< 0.0001). In the 2 and 5 month animals there was no significant difference between the 5XFAD animals and WT controls.
Fig. (1).
Trimodality mouse imaging with CT, PET and MR. An example of a 5XFAD mouse with overlay of CT with MR (left) demonstrates brain registration between these modalities. Parcellation of the brain into various regions was accomplished with MR data and aligned with the CT (middle). 18FDG-PET aligned with the CT (right) was evaluated for whole and regional brain uptake. The neocortex (arrow) and thalamus (arrowhead) are identified as examples of parcellated brain regions.
Fig. (2).
18FDG-PET whole brain uptake in wild-type (WT) and 5XFAD (AD) mice. Mean values and SEM (bars) are shown. At 13 months of age 5XFAD mice demonstrated lower uptake of 18FDG compared to WT (**, p < 0.01).
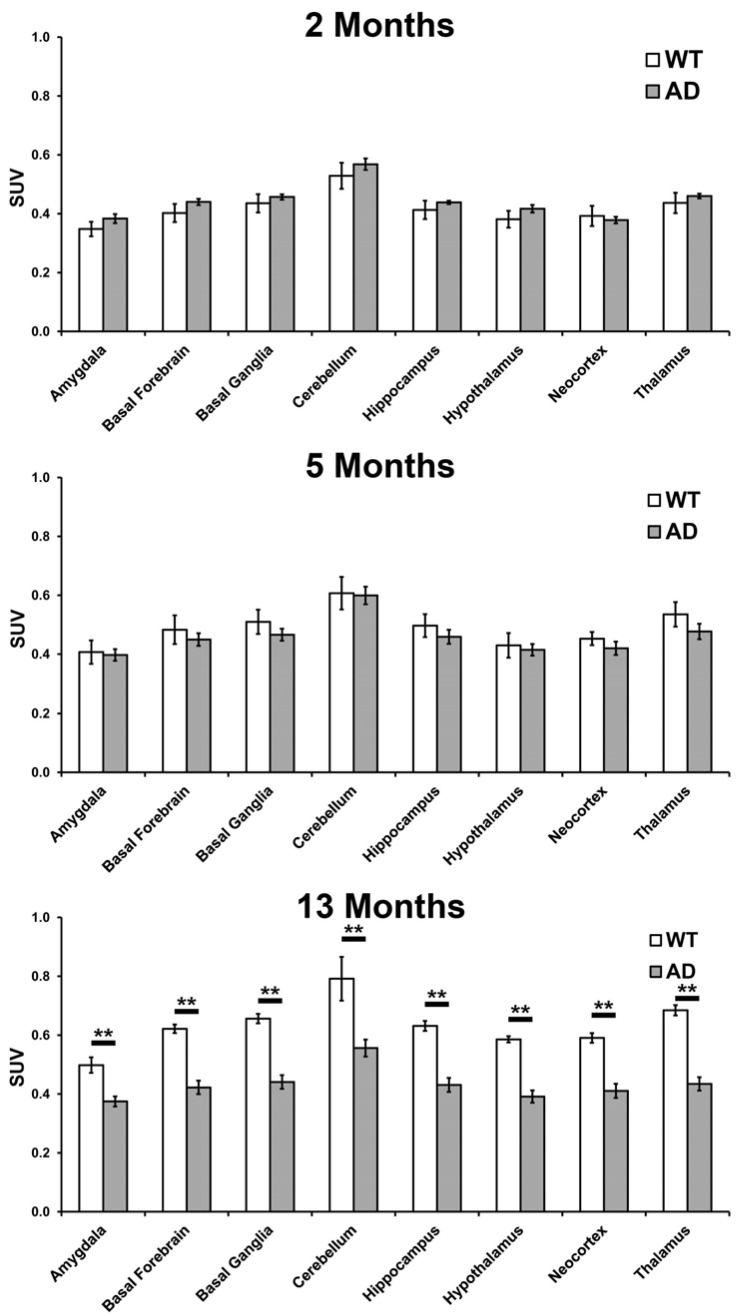
The 5XFAD and WT brains were also anatomically parcellated according to a standard atlas [24] and 18FDG uptake in each region was evaluated at the same ages as for whole brain analysis. Brain regions analyzed were the amygdala, basal forebrain, basal ganglia, cerebellum, hippocampus, hypothalamus, neocortex and thalamus (Fig. 3). Once again, the 5XFAD mice in the 13 month group exhibited significantly lower 18FDG uptake in all the areas examined; amygdala (t(13)=3.75, p=0.0024), basal forebrain (t(13)=4.96, p=0.0003), basal ganglia (t(13)=5.26, p=0.0002), cerebellum (t(13)=3.65, p=0.0029), hippocampus (t(13)=4.84, p=0.0003), hypothalamus (t(13)=5.39, p=0.0001), neocortex (t(13)=4.27, p=0.0009) and thalamus (t(13)=6.264, p=0.0001). There was no significant difference in 18FDG uptake in 2 and 5 month 5XFAD mice compared to WT mice in any of the regions examined. A 10% decrease in hippocampal volume in 5XFAD mice compared to WT at 13 months was observed (p=0.016) with no other volumetric differences.
Fig. (3).
18FDG-PET uptake in different brain regions in wild-type (WT) and 5XFAD (AD) mice. Mean values and SEM (bars) are shown. At 13 months of age 5XFAD mice exhibited a significantly lower 18FDG uptake in all brain regions examined compared to WT mice. (*, < 0.05; **, p < 0.01).
β-Amyloid Deposition
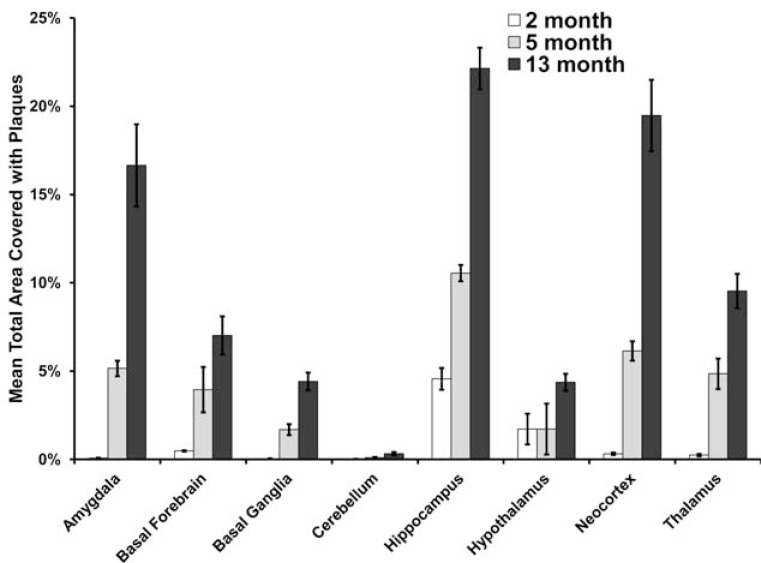
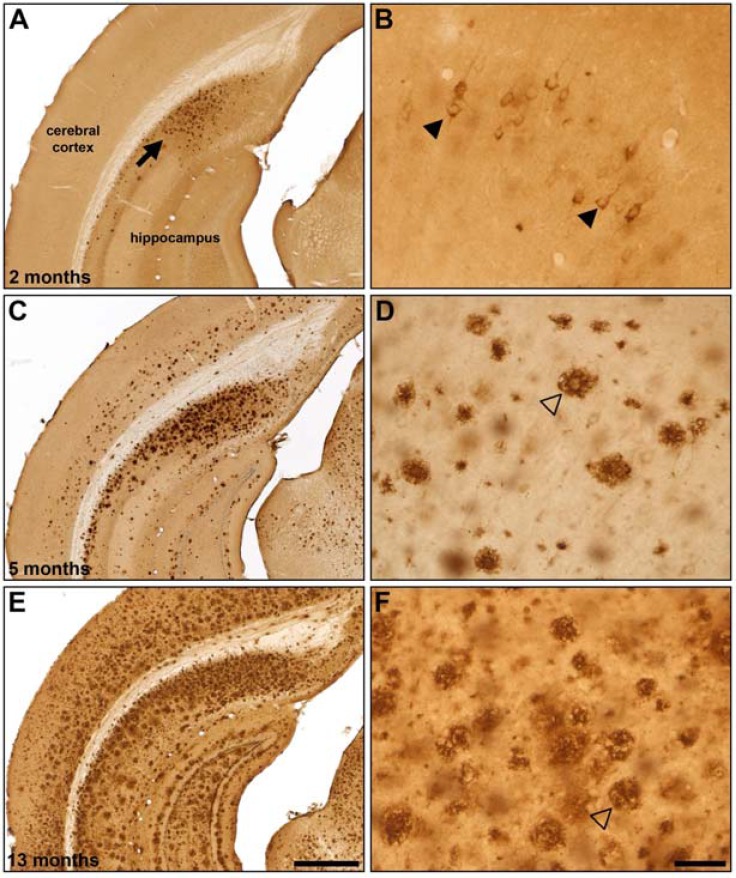
The degree of Aβ plaque deposition in 5XFAD mice was determined across the three age groups in the same parcellated brain regions (Fig. 4) evaluated for 18FDG uptake. Some regions, such as the neocortex, contained relatively high levels of plaque deposition while others, such as the cerebellum, had low plaque levels. However, all brain regions studied exhibited a linear increase in the percent area covered with Aβ plaques as the age of the animal increased. At 2 months of age, intraneuronal Aβ staining was found in the deeper layers of the cerebral cortex and the subiculum, as has been observed elsewhere [7]. Staining had a punctate appearance with small globules of various sizes located within the cytoplasm. Sporadically, proximal processes were also labelled, but staining did not have a punctate appearance. Intraneuronal Aβ staining was not observed in 5 and 13 month old 5XFAD mice. Generally, intraneuronal Aβ was found throughout the cerebral cortex. It was quite prominent in the motor, sensory and retrosplenial cortices. Other areas, such as the insular, frontal, cingulate, visual, piriform, auditory and entorhinal cortices had staining but it was much less intense. The basolateral nucleus of the amygdala had intraneuronal Aβ staining which appeared to be located in most neurons. Other regions of the amygdala did not have staining. There was no intraneuronal Aβ staining in the olfactory bulbs, striatum, hypothalamus, globus pallidus, thalamus and hippocampus (see Fig. 5). As has been reported earlier [7], there was an increase in deposition of extracellular Aβ plaques in the 5XFAD brain with increasing age.
Fig. (4).
Quantification of β-amyloid (Aβ) plaque burden in different brain regions of 5XFAD mice at 2, 5 and 13 months of age. Levels of Aβ deposition varied across brain regions. All areas had increased Aβ burden with age.
Fig. (5).
Representative β-amyloid (Aβ) immunohistochemistry in 2 (A, B), 5 (C, D) and 13 (E, F) month old 5XFAD mice. Aβ plaque deposition is present in some areas at 2 months of age (A; arrow) and increases with age (C, E). Areas such as the cingulate cortex exhibit intraneuronal Aβ accumulation at 2 months of age (B; arrowheads) which progresses to Aβ plaque deposition at later ages (D, F; open arrowheads). Scale Bars: A, C, E = 500 µm; B, D, F = 50 µm.
Comparative Evaluation of Regional Brain Glucose Uptake
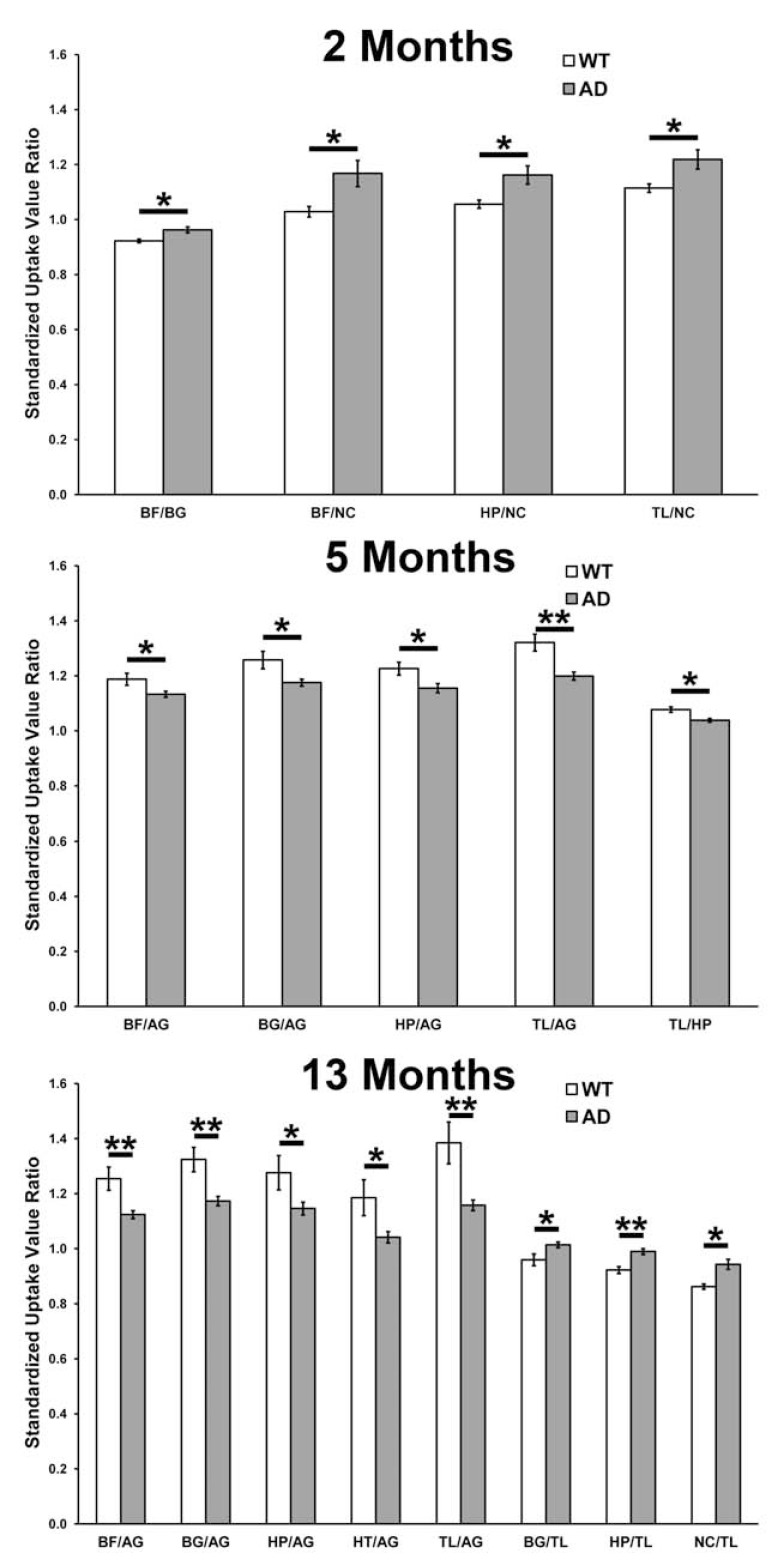
In each WT and 5XFAD mouse, a ratio was calculated for each parcellated brain region with respect to a single reference region in the same brain. This provided a series of relative SUV values (SUVR). In this approach, each parcellated brain region was individually used as the reference tissue in turn. An individual SUVR was calculated for each brain region relative to another region in the same brain. In this metric, the closer the SUVR is to one, the more comparable the 18FDG uptake is in regions being compared. At 2 months of age, 5XFAD mice exhibited a significantly higher ratio of 18FDG uptake (SUVR) in the basal forebrain relative to the basal ganglia (t(9)=3.121, p=0.012) and in the basal forebrain (t(9)=2.51, p=0.033), hippocampus (t(9)=2.73, p=0.024) and thalamus (t(9)=2.54, p=0.032) relative to the neocortex when compared to WT animals (Fig. 6). At 5 months, 5XFAD mice exhibited a significantly lower SUVR in the basal forebrain (t(8)=2.50, p=0.037), basal ganglia (t(8)=3.00, p=0.017), hippocampus (t(8)=2.37, p=0.045) and thalamus (t(8)=4.1, p=0.004) relative to the amygdala and the thalamus (t(8)=3.27, p=0.011) relative to the hippocampus. At 13 months, 5XFAD mice exhibited a significantly lower SUVR in the basal forebrain (t(13)=3.86, p=0.002), basal ganglia (t(13)=3.98, p=0.002), hippocampus (t(13)=2.46, p=0.029), hypothalamus (t(13)=2.84, p=0.014) and thalamus (t(13)=4.23, p=0.001) relative to the amygdala and the basal ganglia (t(13)=2.62, p=0.021), hippocampus (t(13)=3.55, p=0.004) and neocortex (t(13)=2.56, p=0.024) relative to thalamus. Other brain regions, across all the age groups, showed no differences in SUVRs between 5XFAD and WT animals.
Fig. (6).
18FDG-PET standardized uptake value ratios (SUVRs) in brain regions relative to various reference tissues compared between wild-type (WT) and 5XFAD (AD) mice at 2, 5 and 13 months of age. At all ages, WT and AD mice could be distinguished using SUVRs. With increasing age, a greater number of changes in various SUVRs were observed. (*, p < 0.05; **, p < 0.01). AG: amygdala; BF: basal forebrain; BG: basal ganglia; HP: hippocampus; HT: hypothalamus; NC: neocortex; TL: thalamus.
DISCUSSION
Brain 18FDG Uptake
AD is characterized by several pathological hallmarks in the brain, including the emergence of Aβ plaques. The 5XFAD mouse is an aggressive model of brain amyloidosis marked by early development of Aβ plaques and cognitive dysfunction [7]. 18FDG uptake, a surrogate marker of glucose metabolism, was used to evaluate the possible effects of Aβ accumulation on brain function in the 5XFAD mouse model compared with WT controls with respect to age. The analysis required the animals to be sacrificed following imaging to determine neuropathology for possible correlation with 18FDG uptake. Three ages were chosen as a focus for this study, a priori, based on known characteristics of this model [7]. In the 5XFAD animal, at 2 months of age, deposition of Aβ pathology is relatively low and restricted to few areas [7]. It was predicted that by 5 months of age, amyloidosis would be widespread and cover many other brain regions and thus, represent an intermediate stage of disease pathology. By 13 months of age profound behavioural changes are evident in this mouse, including motor deficits [32]. Therefore, 13 months of age was taken to represent a late stage of pathological progression in the 5XFAD mouse.
Initial measurement of whole brain 18FDG uptake utilized direct SUVs for each age group, 2, 5 and 13 months (Fig. 2). Using this approach, at 2 and 5 months, the SUVs were not significantly different for 5XFAD and WT mice. On the other hand, the 13 month age group exhibited significantly lower whole brain SUVs in the 5XFAD mice compared to WT mice. This suggests that, for 5XFAD mice, significantly reduced 18FDG uptake occurs only in older animals, despite observed abundant Aβ accumulation in younger animals.
To explore whether there might be detectable regional differences in glucose metabolism in 5XFAD mice, SUVs in different regions of the brain were also directly determined in 2, 5 and 13 month old mice and compared to WT mice. Parcellation of the brains of 5XFAD and WT animals into different regions (Fig. 3) also provided no significant differences between 5XFAD and WT SUVs for any of the brain regions for the 2 and 5 month age groups, as observed with whole brain measurements. However, as with the whole brain, the 13 month age group exhibited significantly lower SUVs for the 5XFAD animals relative to WT in all parcellated brain regions investigated (Fig. 3). These results, summarized in Figs. (2 and 3), indicate that reduced whole brain regional glucose uptake is evident only in the 13 month 5XFAD mice and represents a global decrease in glucose metabolic activity across the brain at this late stage of disease when Aβ deposition is most abundant (Fig. 4). The reduced 18FDG uptake observed in the present study, despite only 10% reduction in hippocampal volume and no volume reductions in all other structures, may be due, in part, to the neurodegeneration reported in the 5XFAD mouse [7].
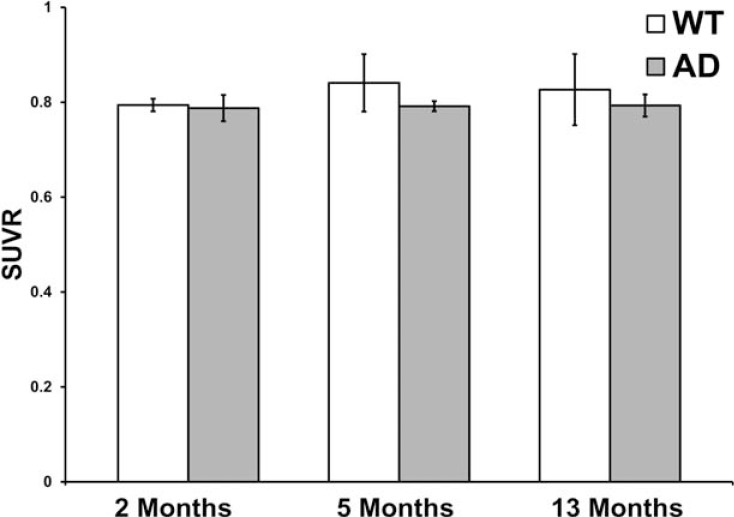
In contrast to these results, a recent study [10] found that brain 18FDG uptake increased relative to the cerebellum in older 5XFAD mice. A similar analysis in the present study demonstrated no significant difference between the whole brain relative to the cerebellum in 5XFAD and WT mice (Fig. 7). The differences in these two results may be due to variations in the control conditions employed. For example, the mice used in the present study had stimulation following 18FDG injection, uptake time prior to scanning was shorter, and finally, temperature of the animal was controlled.
Fig. (7).
Comparison of the ratio of 18FDG-PET standardized uptake value ratio (SUVR) in whole brain relative to the cerebellum between wild-type (WT) and 5XFAD (AD) mice at 2, 5 and 13 months of age. No significant differences between the SUVRs were observed between 5XFAD and WT at these age points.
β-Amyloid Deposition
As described previously [7], the 5XFAD mouse shows accumulation of Aβ in the brain by 2 months of age (Fig. 4). In the present study, Aβ, visualized with immunohistochemistry, and quantified as the area covered by pathology in each parcellated brain region, showed variability in different brain regions and the Aβ plaque burden was typically higher in areas such as the cerebral cortex and hippocampus, known to be compromised in AD and was present in substantial amounts at 2 months of age in the 5XFAD mice (Fig. 5). Despite this Aβ accumulation, whole and parcellated brain, 18FDG uptake was not found to be significantly different with direct SUV measurement in 2 and 5 months old 5XFAD mice compared to WT. This mouse model therefore also reflects the disconnection between Aβ plaque load and brain function based on 18FDG uptake observed in human AD [33]. The 5XFAD mouse model harbors several mutations found in familial Alzheimer’s disease and therefore this model may be more of a reflection of familial AD rather than sporadic AD. Nonetheless, some abnormalities seen in human AD are recapitulated in this mouse model. For example, defective glucose uptake [10], impaired mitochondrial energy metabolism and synaptic damage [34, 35] may play a significant role in the progression of AD. As in the later stages of human AD, it is not until later in the 5XFAD disease stage (13 months) that profound 18FDG uptake changes were observed in the brain using direct SUV measurements. Very modest early changes in brain glucose metabolic function are observed in human AD when a relatively large sample size is considered [36] and may also be detectable in young 5XFAD mice under similar conditions. However, such changes were not detected here, possibly due to the relatively small sample size in this preliminary study. In addition, the use of other neuroimaging biomarker targets such as β-amyloid, acetylcholinesterase [37] or butyrylcholinesterase [38] could complement these studies.
Comparison of Relative Regional Brain Glucose Uptake (SUVR Metric)
Based on whole (Fig. 2) or parcellated (Fig. 3) brain glucose uptake, young 5XFAD mice cannot be distinguished from age-matched WT mice with direct SUV measurements. Since it is of importance to detect Aβ pathology at an early stage for development of effective diagnostic and therapeutic agents, another analytical metric of brain glucose uptake was examined in an attempt to distinguish between WT and 5XFAD mice at an early stage of disease. Given that, as in human AD, there are regional differences in 5XFAD brain glucose metabolism (Fig. 3) we postulated that comparison of different regions within the same brain might identify relative regional differences in 18FDG uptake in young 5XFAD mice (Fig. 6). A similar approach has been successful for regional glucose metabolism analysis of the brain in discrimination of benign and malignant cancer lesions [39]. A typical brain reference tissue has been the cerebellum. However, glucose metabolism varied in each area of the 5XFAD brain (Fig. 3) so that no single area was identified in this study as an ideal internal reference tissue. Therefore, in analyzing a particular brain region, all other brain regions were used in turn individually as the reference tissue. The resulting relative metabolic activity was compared between WT and 5XFAD mice and significant differences in SUVRs were identified in specific brain regions especially compared to neocortex (Fig. 6). In mice at 2 month of age, the SUVR of the basal forebrain, hippocampus, hypothalamus and thalamus, relative to the neocortex in each case, was observed to be increased in 5XFAD mice compared to WT. Since the common denominator in these SUVRs is the neocortex, an interpretation of the change in this ratio is that glucose uptake in the neocortex is diminished substantially more relative to other brain regions examined here. These results suggest that SUVR analysis of 18FDG uptake in different brain areas provides an early marker of disease progression in 5XFAD mice and can distinguish young 5XFAD from WT mice.
CONCLUSIONS
The 5XFAD mouse develops aggressive brain amyloidosis early in life. As in human AD, significant decreases in brain 18FDG uptake are directly observed only in late disease stages in the 5XFAD mouse model. However, determining regional brain glucose metabolism ratios (SUVRs) in young animals can distinguish 5XFAD from WT mice. We conclude that brain 18FDG uptake could be a sensitive biomarker for early detection of brain dysfunction in mouse models when the SUVR analyses involving different regions in the same brain are utilized.
ACKNOWLEDGEMENTS
The authors would like to thank Meghan Cash, Christa Davis, Iulia Dudé, Olivia Stanley, Rachel Dingle and Erin Mazzerolle for their technical support. This work was funded by Nova Scotia Health Research Foundation (MED-MAT-2011-7512), Dalhousie Medical Research Foundation, Mrs. Sadie MacLeod through the DMRF Adopt-a-Researcher program, Canadian Institutes Health Research (RNS-117795 and MOP-119343), Dalhousie University Internal Medicine Research Fund, NSERC grant to REB (A7441) and Capital District Health Authority (#691939).
CONFLICT OF INTEREST
The authors confirm that this article content has no conflicts of interest.
REFERENCES
- 1.Huang Y, Mucke L. Alzheimer mechanisms and therapeutic strategies. Cell. 2012;148(6):1204–22. doi: 10.1016/j.cell.2012.02.040. [DOI] [PMC free article] [PubMed] [Google Scholar]
- 2.Li Y, Rinne JO, Mosconi L, Pirraglia E, Rusinek H, DeSanti S , et al. Regional analysis of FDG and PIB-PET images in normal aging. mild cognitive impairent.and Alzheimer's disease. Eur J Nucl Med Mol Imaging. 2008; 35(12):2169–81. doi: 10.1007/s00259-008-0833-y. [DOI] [PMC free article] [PubMed] [Google Scholar]
- 3.Chew J, Silverman DH. FDG-PET in early AD diagnosis. Med Clin North Am. 2013;97(3):485–94. doi: 10.1016/j.mcna.2012.12.016. [DOI] [PubMed] [Google Scholar]
- 4.Silverman DH, Small GW, Chang CY, Lu CS, Kung De Aburto MA, Chen Wetal. Positron emission tomography in evaluation of dementia. Regional brain metabolism and longterm outcome. 2001;286(17):2120–7. doi: 10.1001/jama.286.17.2120. [DOI] [PubMed] [Google Scholar]
- 5.Serrano-Pozo A, Frosch MP, Masliah E, Hyman BT. Neuropathological alterations in Alzheimer disease. Cold Spring Harb Perspect Med. 2011;1(1):a006189. doi: 10.1101/cshperspect.a006189. [DOI] [PMC free article] [PubMed] [Google Scholar]
- 6.Hardy J, Selkoe DJ. The amyloid hypothesis of Alzheimer's disease progress and problems on the road to therapeutics. Science. 2002;297(5580):353–6. doi: 10.1126/science.1072994. [DOI] [PubMed] [Google Scholar]
- 7.Oakley H, Cole SL, Logan S, Maus E, Shao P, Craft J , et al. Intraneuronal beta-amyloid aggregates neurodegeneration and neuron loss in transgenic mice with five familial Alzheimer's disease mutations potential factors in amyloid plaque formation. J Neurosci. 2006;26(40):10129–40. doi: 10.1523/JNEUROSCI.1202-06.2006. [DOI] [PMC free article] [PubMed] [Google Scholar]
- 8.Reddy PH, Beal MF. Amyloid beta. mitochondrial dysfunction and synaptic damage implications for cognitive decline in aging and Alzheimer's disease. Trends Mol Med. 2008;14(2):45–53. doi: 10.1016/j.molmed.2007.12.002. [DOI] [PMC free article] [PubMed] [Google Scholar]
- 9.Reddy PH, Manczak M, Mao P, Calkins MJ, Reddy AP, Shirendeb U. Amyloid-beta and mitochondria in aging and Alzheimer's disease: implications for synaptic damage and cognitive decline. J Alzheimers Dis. 2010;20(2):S499–512. doi: 10.3233/JAD-2010-100504. [DOI] [PMC free article] [PubMed] [Google Scholar]
- 10.Rojas S, Herance JR, Gispert JD, Abad S, Torrent E, Jimenez Xetal. In vivo evaluation of amyloid deposition and brain glucose metabolism of 5XFAD mice using positron emission tomography. Neurobiol Aging. 2013;34(7):1790–8. doi: 10.1016/j.neurobiolaging.2012.12.027. [DOI] [PubMed] [Google Scholar]
- 11.Reiman EM, Uecker A, Gonzalez-Lima F, Minear D, Chen K, Callaway NL , et al. Tracking Alzheimer's disease in transgenic mice using fluorodeoxyglucose autoradiography. Neuroreport. 2000;11(5):987–91. doi: 10.1097/00001756-200004070-00018. [DOI] [PubMed] [Google Scholar]
- 12.LaFerla FM, Green KN. Animal models of Alzheimer disease. Cold Spring Harb Perspect Med. 2012;2(11):1–13. doi: 10.1101/cshperspect.a006320. [DOI] [PMC free article] [PubMed] [Google Scholar]
- 13.Valla J, Gonzalez-Lima F, Reiman EM. FDG autoradiography reveals developmental and pathological effects of mutant amyloid in PDAPP transgenic mice. Int J Dev Neurosci. 2008;26(3-4):253–8. doi: 10.1016/j.ijdevneu.2008.02.003. [DOI] [PMC free article] [PubMed] [Google Scholar]
- 14.Valla J, Schneider L, Reiman EM. Age- and transgene-related changes in regional cerebral metabolism in PSAPP mice. Brain Res. 2006;1116(1):194–200. doi: 10.1016/j.brainres.2006.07.097. [DOI] [PMC free article] [PubMed] [Google Scholar]
- 15.Kuntner C, Kesner AL, Bauer M, Kremslehner R, Wanek T, Mandler M , et al. Limitations of small animal PET imaging with [18F]FDDNP and FDG for quantitative studies in a transgenic mouse model of Alzheimer's disease. Mol Imaging Biol. 2009;11(4):236–40. doi: 10.1007/s11307-009-0198-z. [DOI] [PubMed] [Google Scholar]
- 16.Luo F, Rustay NR, Ebert U, Hradil VP, Cole TB, Llano DA , et al. Characterization of 7- and 19-month-old Tg2576 mice using multimodal in vivo imaging: limitations as a translatable model of Alzheimer's disease. Neurobiol Aging. 2012;33(5):933–44. doi: 10.1016/j.neurobiolaging.2010.08.005. [DOI] [PubMed] [Google Scholar]
- 17.Poisnel G, Herard AS, El Tannir El, Tayara N, Bourrin E, Volk A, Kober F , et al. Increased regional cerebral glucose uptake in an APP/PS1 model of Alzheimer's disease. Neurobiol Aging. 2012;33(9):1995–2005. doi: 10.1016/j.neurobiolaging.2011.09.026. [DOI] [PMC free article] [PubMed] [Google Scholar]
- 18.Dubois A, Herard AS, Delatour B, Hantraye P, Bonvento G, Dhenain M , et al. Detection by voxel-wise statistical analysis of significant changes in regional cerebral glucose uptake in an APP/PS1 transgenic mouse model of Alzheimer's disease. Neuroimage. 2010;51(2):586–98. doi: 10.1016/j.neuroimage.2010.02.074. [DOI] [PubMed] [Google Scholar]
- 19.Girard SD, Baranger K, Gauthier C, Jacquet M, Bernard A, Escoffier G , et al. Evidence for early cognitive impairment related to frontal cortex in the 5XFAD mouse model of Alzheimer's disease. J Alzheimers Dis. 2013;33(3):781–96. doi: 10.3233/JAD-2012-120982. [DOI] [PubMed] [Google Scholar]
- 20.Eimer WA, Vassar R. Neuron loss in the 5XFAD mouse model of Alzheimer's disease correlates with intraneuronal Abeta42 accumulation and Caspase-3 activation. Mol Neurodegener. 2013;8:2. doi: 10.1186/1750-1326-8-2. [DOI] [PMC free article] [PubMed] [Google Scholar]
- 21.Macdonald IR, DeBay DR, Reid GA, O'Leary TP, Cash MK, Jollymore CT , et al., editors. Boston MA.: Alzheimer s Association International Conference; 2013. editors.Cerebral Glucose Metaboism.Pathology and Behaviour in the 5XFAD Mouse Model of Alzheimer's Disease. [Google Scholar]
- 22.Graham MM, Peterson LM, Hayward RM. Comparison of simplified quantitative analyses of FDG uptake. Nucl Med Biol. 2000;27(7):647–55. doi: 10.1016/s0969-8051(00)00143-8. [DOI] [PubMed] [Google Scholar]
- 23.Ma Y, Hof PR, Grant SC, Blackband SJ, Bennett R, Slatest L , et al. A three-dimensional digital atlas database of the adult C57BL/6J mouse brain by magnetic resonance microscopy. Neurosci. 2005;135(4):1203–15. doi: 10.1016/j.neuroscience.2005.07.014. [DOI] [PubMed] [Google Scholar]
- 24.Ma Y, Smith D, Hof PR, Foerster B, Hamilton S, Blackband SJ , et al. In vivo 3D Digital Atlas Database of the Adult C57BL/6J Mouse Brain by Magnetic Resonance Microscopy. Front Neuroanat. 2008;2:1. doi: 10.3389/neuro.05.001.2008. [DOI] [PMC free article] [PubMed] [Google Scholar]
- 25.Woods RP, Grafton ST, Holmes CJ, Cherry SR, Mazziotta JC. Automated image registration: I.General methods and intrasubect.intramodality validation. J Comput Assist Tomogr. 1998; 22(1):139–52. doi: 10.1097/00004728-199801000-00027. [DOI] [PubMed] [Google Scholar]
- 26.Studholme C, Hill DL, Hawkes DJ. Automated 3-D registration of MR and CT images of the head. Med Image Anal. 1996;1(2):163–75. doi: 10.1016/s1361-8415(96)80011-9. [DOI] [PubMed] [Google Scholar]
- 27.Loening AM, Gambhir SS. AMIDE: a free software tool for multimodality medical image analysis. Mol Imaging. 2003;2(3):131–7. doi: 10.1162/15353500200303133. [DOI] [PubMed] [Google Scholar]
- 28.Kitamoto T, Ogomori K, Tateishi J, Prusiner SB. Formic acid pretreatment enhances immunostaining of cerebral and systemic amyloids. Lab Invest. 1987;57(2):230–6. [PubMed] [Google Scholar]
- 29.Jankowsky JL, Younkin LH, Gonzales V, Fadale DJ, Slunt HH, Lester HA , et al. Rodent A beta modulates the solubility and distribution of amyloid deposits in transgenic mice. J Biol Chem. 2007;282(31):22707–20. doi: 10.1074/jbc.M611050200. [DOI] [PMC free article] [PubMed] [Google Scholar]
- 30.Shi Q, Prior M, He W, Tang X, Hu X, Yan R. Reduced amyloid deposition in mice overexpressing RTN3 is adversely affected by preformed dystrophic neurites. J Neurosci. 2009;29(29):9163–73. doi: 10.1523/JNEUROSCI.5741-08.2009. [DOI] [PMC free article] [PubMed] [Google Scholar]
- 31.Paxinos G, Franklin K, editors. 2nd ed. San Diego CA: Academic Press.; 2001. The Mouse Brain in Stereotaxic Coordinates . [Google Scholar]
- 32.Jawhar S, Trawicka A, Jenneckens C, Bayer TA, Wirths O. Motor deficits neuron loss and reduced anxiety coinciding with axonal degeneration and intraneuronal Abeta aggregation in the 5XFAD mouse model of Alzheimer's disease. Neurobiol Aging. 2012;33(1):196 e29–40. doi: 10.1016/j.neurobiolaging.2010.05.027. [DOI] [PubMed] [Google Scholar]
- 33.Mortimer JA. The Nun Study risk factors for pathology and clinical-pathologic correlations. Curr Alzheimer Res. 2012;9(6):621–7. doi: 10.2174/156720512801322546. [DOI] [PubMed] [Google Scholar]
- 34.Reddy PH, McWeeney S, Park BS, Manczak M, Gutala RV, Partovi Detal. Gene expression profiles of transcripts in amyloid precursor protein transgenic mice up-regulation of mitochondrial metabolism and apoptotic genes is an early cellular change in Alzheimer's disease. Hum Mol Genet. 2004;13(12):1225–40 . doi: 10.1093/hmg/ddh140. [DOI] [PubMed] [Google Scholar]
- 35.Manczak M, Anekonda TS, Henson E, Park BS, Quinn J, Reddy PH. Mitochondria are a direct site of A beta accumulation in Alzheimer's disease neurons: implications for free radical generation and oxidative damage in disease progression. Hum Mol Genet. 2006;15(9):1437–49. doi: 10.1093/hmg/ddl066. [DOI] [PubMed] [Google Scholar]
- 36.Bateman RJ, Xiong C, Benzinger TL, Fagan AM, Goate A, Fox NC , et al. Clinical and biomarker changes in dominantly inherited Alzheimer's disease. N Engl J Med. 2012;367(9):795–804. doi: 10.1056/NEJMoa1202753. [DOI] [PMC free article] [PubMed] [Google Scholar]
- 37.Kikuchi T, Okamura T, Zhang MR, Irie T. PET probes for imaging brain acetylcholinesterase. Labelled Compounds and Radiopharmaceuticals. 2013;56:172–9. doi: 10.1002/jlcr.3002. [DOI] [PubMed] [Google Scholar]
- 38.Darvesh S. Butyrylcholinesterase radioligands to image Alzheimer's disease brain. Chem Biol Interact. 2013;203(1):354–7. doi: 10.1016/j.cbi.2012.08.009. [DOI] [PubMed] [Google Scholar]
- 39.Britz-Cunningham SH, Millstine JW, Gerbaudo VH. Improved discrimination of benign and malignant lesions on FDG PET/CT. using comparative activity ratios to bain.basal ganglia., or cerebellum. . Clin Nucl Med . 2008;33(10):681–7. doi: 10.1097/RLU.0b013e318184b435. [DOI] [PubMed] [Google Scholar]


