

Abstract
The aim of this study is to assess the variation in voxel value distribution in volumetric data sets obtained by six cone beam CT (CBCT) units, and the effect of time between exposures. Six CBCT units [Cranex® 3D (CRAN; Soredex Oy, Tuusula, Finland), Scanora® 3D (SCAN; Soredex Oy), NewTom™ 5G (NEWT; QR Srl, Verona, Italy), Promax® Dimax 3 (Planmeca Oy, Helsinki, Finland), i-CAT (Imaging Sciences International, Hatfield, PA) and 3D Accuitomo FPD80 (Morita, Kyoto, Japan)] were tested. Two volumetric data sets of a dry human skull embedded in acrylic were acquired by each CBCT unit in two sessions on separate days. Each session consisted of 20 exposures: 10 acquired with 30 min between exposures and 10 acquired immediately one after the other. CBCT data were exported as digital imaging and communications in medicine (DICOM) files and converted to text files. The text files were re-organized to contain x-, y- and z-position and grey shade for each voxel. The files were merged to contain 1 record per voxel position, including the voxel values from the 20 exposures in a session. For each voxel, subtractions were performed between Data Set 1 and the remaining 19 data sets (1 − 2, 1 − 3, etc) in a session. Means, medians, ranges and standard deviations for grey shade variation in the subtraction data sets were calculated for each unit and session. For all CBCT units, variation in voxel values was observed throughout the 20 exposures. A “fingerprint” for the grey shade variation was observed for CRAN, SCAN and NEWT. For the other units, the variation was (apparently) randomly distributed. Large discrepancies in voxel value distribution are seen in CBCT images. This variation should be considered in studies that assess minute changes in CBCT images.
Keywords: cone beam CT, voxel value, grey shade distribution
Introduction
When three-dimensional visualization of bony structures in the head and neck region is needed, cone beam CT (CBCT) scanning is a widely used method.1–3 A major disadvantage of CBCT imaging may be the presence of visible artifacts in the final reconstructed images,4–6 together with the inaccuracy of the voxel values measured in the images.7,8
Studies evaluating an innate grey shade variation in CBCT images are currently limited. This seems illogical since for previously developed two-dimensional radiographic methods noise presence in an image has been discussed in detail.9–12 At present, studies considering the existence of a non-avoidable background “noise” that would lead to grey shade variation in CBCT-generated images have mainly focused on signal-to-noise and contrast-to-noise ratios.13,14
Other studies3,15,16 have examined the same subject, assessing the inappropriateness of using CBCT voxel values to derive Hounsfield units and thereby measure bone tissue density. In such studies, the major conclusions were that care should be taken when interpreting quantitative density measurements obtained with CBCT, but the sources of the possible voxel value discrepancies were not addressed in detail. A recent study7 found a grey shade deviation close to 6% when comparing various commercially available CBCT units to multislice CT units, and although noise was listed as one of the sources for this variation, this was not assessed. Another study17 evaluated the reliability of voxel values in CBCT and also considered the effect of surrounding objects present outside the field of view (FOV), arguing that the images were not reliable for bone density estimations.
The aim of the present study was to assess the variation in voxel value distribution in volumetric data sets obtained by six CBCT units, together with the effect of time between exposures.
Methods and materials
Acquisition of the volumetric data set
Six CBCT units were tested: Cranex® 3D (CRAN; Soredex Oy, Tuusula, Finland), Scanora® 3D (SCAN; Soredex Oy), NewTom™ 5G (NEWT; QR Srl, Verona, Italy), Promax® Dimax 3 Digital (PROM; Planmeca Oy, Helsinki, Finland), i-CAT (ICAT; Imaging Sciences International, Hatfield, PA) and 3D Accuitomo FPD80 (ACCU; Morita, Kyoto, Japan). The settings (FOV and resolution) selected for each unit were based on the default settings displayed when the machine was turned on. For those units where an FOV must be selected, the most common settings according to the oral radiology service statistics were chosen. The protocol used for each CBCT unit is shown in Table 1. Immediately after the acquisition, the data sets were exported as uncompressed digital imaging and communications in medicine multifiles.18
Table 1.
Data acquisition protocols
| Parameters | CBCT unit |
|||||
|---|---|---|---|---|---|---|
| CRAN | SCAN | NEWT | PROM | ICAT | ACCU | |
| Scan time (s) | 20.0 | 11.0 | 18.0 | 24.0 | 20.0 | 17.5 |
| Exposure time (s) | 4.9 | 2.5 | 3.1 | 3.0 | 5.0 | 17.5 |
| Field of view (cm) | 6.1 × 7.8 | 7.5 × 10 | 18 × 16 | 7.5 × 8 | 8 × 16 | 6 × 6 |
| Tube potential (kV) | 90 | 90 | 110 | 84 | 120 | 90 |
| Tube current (mA) | 12.5 | 12.5 | 7.0 | 10.0 | 18.5 | 5.0 |
| Voxel resolution (mm) | 0.300 | 0.300 | 0.360 | 0.320 | 0.400 | 0.125 |
ACCU, 3D Accuitomo FPD80 (Morita, Kyoto, Japan); CBCT, cone beam CT; CRAN, Cranex® 3D (Soredex Oy, Tuusula, Finland); ICAT, i-CAT (Imaging Sciences International, Hatfield, PA); NEWT, NewTom™ 5G (QR Srl, Verona, Italy); PROM, Promax® Dimax 3 Digital (Planmeca Oy, Helsinki, Finland); SCAN, Scanora® 3D (Soredex Oy).
Session logistics
All CBCT units were tested in two sessions. Each session consisted of 20 exposures: 10 acquired with 30 min between exposures and 10 acquired immediately one after the other. The sessions took place on separate days to guarantee that the unit had not been used 12 h prior to the first exposure in a session. A dry human skull embedded in acrylic served as the study object (Figure 1).
Figure 1.
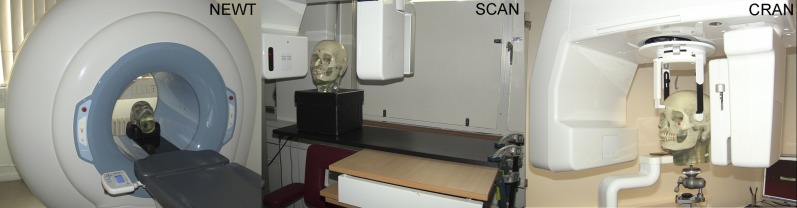
The unit's chair was not used unless its control was isolated from the cone beam CT unit [as was the case for NewTom™ 5G (NEWT; QR Srl, Verona, Italy)]. For Scanora® 3D (SCAN; Soredex Oy, Tuusula, Finland) i-CAT (Imaging Sciences International, Hatfield, PA) and 3D Accuitomo FPD80 (Morita, Kyoto, Japan) a table with adjustable height together with a wooden plate (used as an extension) served as support for the skull, whereas for Cranex® 3D (CRAN; Soredex Oy) and Promax® Dimax 3 (Planmeca Oy, Helsinki, Finland), a tripod was used to support the skull.
To assure that the position of the skull was identical for the whole session, i.e. not moving, the unit's chair was not used unless its control was isolated from the CBCT unit (as was the case for NEWT). For SCAN, ICAT and ACCU, a table with adjustable height together with a wooden plate (used as an extension) served as the support for the skull, thus even a small inconsistency in the positioning of the unit's chair from one exposure to another, caused by the unit's native software, was avoided (Figure 1). In those units, in which the patient was required to be in a standing position (CRAN and PROM), a tripod was used to support the skull. Neither the skull nor the table or the unit was touched after an exposure session had started.
Data management
CBCT data sets were exported as digital imaging and communications in medicine (DICOM) multifiles and converted to text files using ImageJ software v. 1.46 (National Institutes of Health, Bethesda, MD). A dedicated software was used to re-organize the text files to contain x-, y- and z-position and grey shade for each voxel. The files were merged using a commercially available statistical software package (SPSS® v. 13.0; Apache Software Foundation, Chicago, IL) to contain one record per voxel position, including the voxel values from the 20 exposures in a session. The size of each merged file varied according to the voxel resolution provided by each unit and the range of grey shades according to the bit depth. The size of the file and grey shade range for each unit is presented in Table 2. For each voxel in the data set, subtractions were performed between Data Set 1 and the remaining 19 data sets (1 − 2, 1 − 3, 1 − 4 etc).
Table 2.
Bit depth and grey shades of acquired data, file size and number of voxels according to the unit
| Parameter | CBCT units |
|||||
|---|---|---|---|---|---|---|
| CRAN | SCAN | NEWT | PROM | ICAT | ACCU | |
| Nominal bit depth (bits) | 12.0 | 12.0 | 16 | 12.0 | 14.0 | 13.0 |
| Real bit depth (shades of grey) | 4096.0 | 4096.0 | 32,768 | 4096.0 | 16,384.0 | 8192.0 |
| Grey shades used | 4096.0 | 4096.0 | 17,271 | 4096.0 | 4329.0 | 3667.0 |
| DICOM file (MB) | 27.9 | 54.0 | 382 | 30.2 | 46.6 | 212.5 |
| Number of voxels (million) | 14.1 | 27.7 | 201 | 15.6 | 24.3 | 111.2 |
ACCU, 3D Accuitomo FPD80 (Morita, Kyoto, Japan); CBCT, cone beam CT; CRAN, Cranex® 3D (Soredex Oy, Tuusula, Finland); DICOM, digital imaging and communications in medicine; ICAT, i-CAT (Imaging Sciences International, Hatfield, PA); NEWT, NewTom™ 5G (QR Srl, Verona, Italy); PROM, Promax® Dimax 3 Digital (Planmeca Oy, Helsinki, Finland); SCAN, Scanora® 3D (Soredex Oy).
Data treatment
Commercially available software (SPSS v. 13.0) was used for data evaluation. Owing to the rather small sample size (two sessions for each CBCT unit), only descriptive statistics of the acquired data are presented. Means, medians, ranges and standard deviations for grey shade variation in the subtraction data sets, together with the percentage of affected voxels, were calculated for each unit and for each separate session, considering the exposures made with a 30-min interval and those made immediately one after the other, respectively.
Results
For all units, variation in voxel values was observed throughout the 20 exposures. The largest grey shade difference for the same voxel, the mean grey shade difference and the percentage of voxels that changed value, are presented in Table 3. Grey shade differences among the 19 subtraction data sets for each unit in the two sessions are shown in Figure 2.
Table 3.
Range of the largest grey shade difference for the same voxel, mean grey shade difference and the percentage of voxels that changed value in the subtraction data sets according to unit
| Unit | First session (ranges) |
Second session (ranges) |
||||
|---|---|---|---|---|---|---|
| Largest grey shade difference for the same voxel | Mean grey shade difference | Percentage of voxels that changed value | Largest grey shade difference for the same voxel | Mean grey shade difference | Percentage of voxels that changed value | |
| CRAN | 2137–6069 | −0.3 to 1.0 | 64.6 to 65.1 | 2340 to 6286 | −1.6 to −0.5 | 71.6 to 71.7 |
| SCAN | 1718–2946 | −3.8 to 0.2 | 72.1 to 72.3 | 2297 to 4489 | −6.5 to −0.4 | 72.1 to 72.3 |
| NEWT | 7380–14,948 | −0.8 to 2.7 | 57.4 to 59.0 | 6425 to 8336 | −0.9 to 2.6 | 58.9 to 59.9 |
| PROM | 1237–3732 | −16.5 to −6.7 | 68.3 to 68.6 | 7930 to 8114 | 38.4 to 40.3 | 66.4 to 71.2 |
| ICAT | 2442–5059 | −2.5 to −0.4 | 99.8 to 99.8 | 6485 to 7317 | −0.4 to 45.9 | 99.8 to 99.8 |
| ACCU | 2631–3259 | −61.6 to 108.9 | 96.4 to 96.6 | 2369 to 3236 | −39.6 to 165.0 | 95.5 to 96.6 |
ACCU, 3D Accuitomo FPD80 (Morita, Kyoto, Japan); CRAN, Cranex® 3D (Soredex Oy, Tuusula, Finland); ICAT, i-CAT (Imaging Sciences International, Hatfield, PA); NEWT, NewTom™ 5G (QR Srl, Verona, Italy); PROM, Promax® Dimax 3 Digital (Planmeca Oy, Helsinki, Finland); SCAN, Scanora® 3D (Soredex Oy).
Figure 2.

Mean grey shade difference among the 19 subtraction data sets (1 − x) according to the units used [Cranex® 3D (CRAN; Soredex Oy, Tuusula, Finland); Scanora® 3D (SCAN; Soredex Oy); NewTom™ 5G (NEWT; QR Srl, Verona, Italy); Promax® Dimax 3 Digital (PROM; Planmeca Oy, Helsinki, Finland); i-CAT (ICAT; Imaging Sciences International, Hatfield, PA); 3D Accuitomo FPD80 (ACCU; Morita, Kyoto, Japan)].
The largest grey shade difference for the same voxel was seen for NEWT (14,948 shades of grey). The largest mean grey shade difference (between two exposures) was 165 shades of grey in ACCU (in data sets obtained immediately one after the other). ICAT had the largest percentage of voxels that changed value (99.8%). The largest difference between grey shades obtained in the first and second sessions was seen for PROM, and this was as high as 55 shades of grey.
A “fingerprint” of the grey shade variation (i.e. an identical behaviour in both sessions) was observed for SCAN and NEWT when considering all 20 exposures, and for CRAN when considering data sets from exposures with a 30-min interval. For SCAN, when exposures were made immediately one after the other, the data sets showed a trend to obtain higher voxel values (i.e. images would become lighter) over time. For NEWT, higher voxel values with time were observed for exposures made with a 30-min interval, and lower values (i.e. images would become darker) for exposures made immediately one after the other. For the other units, the variation was (apparently) more randomly distributed. For ICAT, two of the subtraction data sets from the second session showed very diverging characteristics with extremely outlying mean grey shades (Figure 2; abruption of dotted line for ICAT).
Discussion
One of the paramount radiographic modalities for image-based diagnosis in the past decades has been CBCT imaging. Along with the fact that CBCT clinical application is growing considerably, the drawbacks associated with this technology must be considered. A major disadvantage of CBCT imaging may be the inaccuracy of the voxel values measured in the data sets7,8 allied to the presence of visible artefacts in the final reconstructed images.4–6
In this study, we assessed the variation in voxel value distribution in volumetric data sets obtained by six CBCT units. Our main aim was to suggest a method for the assessment of the background “noise” present in CBCT images, as has been done previously for two-dimensional radiographic modalities.9–12 Up until now, studies3,15,16 supporting the existence of a grey shade variation in CBCT images have concluded that it may not be possible to work with Hounsfield units in CBCT-based data sets in the way that it is done in multislice CT. Previous studies3,15,16 have not commented on the sources of the grey shade discrepancies in detail.
The results of our study showed medium-to-large variation in voxel values for all units, when considering the 20 exposures of each session. This is in agreement with the results previously reported in the literature by Pauwels et al,7 who calculated the correlation between CBCT and multislice CT grey shades and the voxel value error. In that study, a customized polymethyl methacrylate phantom containing six different inserts [air, aluminium and hydroxyapatite in three concentrations (50, 100 and 200 mg cm−3) and polymethyl methacrylate] was used. The authors showed an average grey shade deviation among CBCT and multislice CT of 241 grey shades, corresponding to approximately 6% of the total grey shade range of a multislice CT (i.e. 12-bit or 4096 grey shades) and with a range of variation up to 1562 grey shades.7 The main difference between their study and ours is that their study measured pre-defined averaged areas within a data set, whereas we assessed the grey shades at the single voxel level.
In the present study, the percentage of voxels, which changed value among the acquired data sets within a session, ranged from 55% (NEWT) to 99% (ICAT). In these cases in which the percentage of voxels that changed value was >78% (ACCU and ICAT)—the approximate percentage of the area occupied by a circle inside a square—it is possible that, during image reconstruction, empty areas were automatically assigned values (by the unit's software) that change from one exposure to another, or that images were stretched to fit a square frame. This assumption is made based on the fact that a CBCT data set consists of several axial sections of a cylinder (circles) represented inside a square image (Figure 3).
Figure 3.
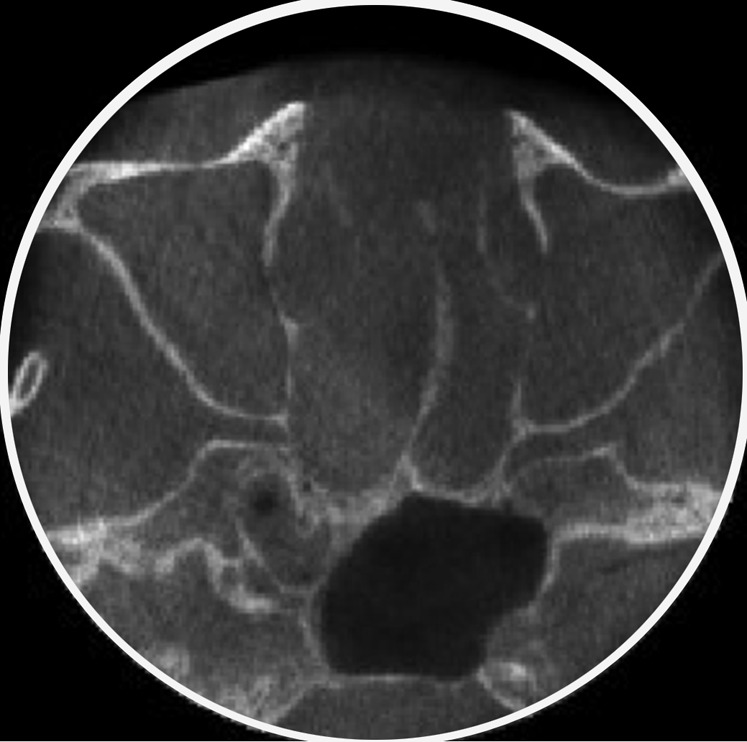
The approximate percentage of the area occupied by a circle (axial cone beam CT section) inside a square is 78% (area inside the white circle). When the percentage of voxels that changed value was >78%, it is possible that during image reconstruction, empty areas (outside the white circle) were assigned arbitrary values or that images were stretched to fit a square frame.
Special attention was given to the standardization of the acquired volume throughout one session. The fixed position of the object of interest was assured by the fact that the unit's chair was never used. This guaranteed that even a small inconsistency in the positioning of the unit's chair from one exposure to another, caused by the unit's native software, was avoided. On the other hand, the positioning and the size of the FOV varied among the units, leading to different ratios between the real bit depth and the number of grey shades actually used to build the data set. This should be considered when further studies are planned based on our methodology and the use of a standardized positioning as should size of the FOV.
The origin of the grey shade variation in CBCT data sets needs to be addressed carefully. One of the most important factors is that the exposures in CBCT imaging yield significantly smaller doses than those in multislice CT, which would theoretically increase the signal-to-noise ratio in CBCT.14 The post-processing of the images, based on the algorithms used by each unit, must also be considered as a source of grey shade variation, since these are complex mathematical interpretations of how photon absorption is interpreted by the unit receptor.5
Previous studies in the literature7,17 listed noise as one of the reasons not to derive Hounsfield units from CBCT, but no numerical expression for this variation has been reported. In our study, we have suggested a numerical representation of the grey shade variation, allowing an understanding of density variations in CBCT images and the inappropriateness of converting to Hounsfield units. Grey shade variation might influence subjective image quality assessment;3,16 however, there are no reports on an eventual impact on the diagnostic outcome, and this may be less likely.
The fact that no statistical comparison was performed within the examinations and/or between the CBCT units must be acknowledged. There was just one unit of each brand under testing, and only two sessions for each unit. We believe that the use of more than one unit of each brand would be needed to possibly confirm the results shown in the present study. We attempted to describe in detail the settings used for data generation, to enhance the reproducibility of our method and allow our results to be compared with other standardized studies.
Conclusion
Our results showed that large variation in grey shade distribution is seen in CBCT data sets. The pattern of the variation differs for some units depending on the time interval between exposures. This variation should be considered in studies that assess minute changes in CBCT images. Further studies are needed to assess the possible impact of this variation on the diagnostic outcome of CBCT imaging.
Acknowledgments
Acknowledgments
The authors would like to acknowledge Edgar Hirsch (Department of Dentomaxillofacial Radiology, Dental School, University of Leipzig, Germany) and Janne Ingerslev (Head Surgery Department, Southwestern Jutland Hospital, Esbjerg, Denmark) for their assistance in operating some of the CBCT units used in this study.
REFERENCES
- 1.Miracle AC, Mukherji SK. Conebeam CT of the head and neck, part 1: physical principles. Am J Neuroradiol 2009; 30: 1088–95. doi: 10.3174/ajnr.A1653 [DOI] [PMC free article] [PubMed] [Google Scholar]
- 2.Miracle AC, Mukherji SK. Conebeam CT of the head and neck, part 2: clinical applications. Am J Neuroradiol 2009; 30: 1285–92. doi: 10.3174/ajnr.A1654 [DOI] [PMC free article] [PubMed] [Google Scholar]
- 3.Cassetta M, Stefanelli LV, Di Carlo S, Pompa G, Barbato E. The accuracy of CBCT in measuring jaws bone density. Eur Rev Med Pharmacol Sci 2012; 16: 1425–9. [PubMed] [Google Scholar]
- 4.Hanzelka T, Foltan R, Horka E, Sedy J. Reduction of the negative influence of patient motion on quality of CBCT scan. Med Hypotheses 2010; 75: 610–12. doi: 10.1016/j.mehy.2010.07.046 [DOI] [PubMed] [Google Scholar]
- 5.Schulze R, Heil U, Grob D, Bruellmann DD, Dranischnikow E, Schwanecke U, et al. Artefacts in CBCT: a review. Dentomaxillofac Radiol 2011; 40: 265–73. doi: 10.1259/dmfr/30642039 [DOI] [PMC free article] [PubMed] [Google Scholar]
- 6.Spin-Neto R, Mudrak J, Matzen LH, Christensen J, Gotfredsen E, Wenzel A. Cone beam CT image artefacts related to head motion simulated by a robot skull: visual characteristics and impact on image quality. Dentomaxillofac Radiol 2013; 42: 32310645. doi: 10.1259/dmfr/32310645 [DOI] [PMC free article] [PubMed] [Google Scholar]
- 7.Pauwels R, Nackaerts O, Bellaiche N, Stamatakis H, Tsiklakis K, Walker A, et al. Variability of dental cone beam CT grey values for density estimations. Br J Radiol 2013; 86: 20120135. doi: 10.1259/bjr.20120135 [DOI] [PMC free article] [PubMed] [Google Scholar]
- 8.Nackaerts O, Maes F, Yan H, Couto Souza P, Pauwels R, Jacobs R. Analysis of intensity variability in multislice and cone beam computed tomography. Clin Oral Implants Res 2011; 22: 873–9. doi: 10.1111/j.1600-0501.2010.02076.x [DOI] [PubMed] [Google Scholar]
- 9.Wenzel A, Sewerin I. Sources of noise in digital subtraction radiography. Oral Surg Oral Med Oral Pathol 1991; 71: 503–8. [DOI] [PubMed] [Google Scholar]
- 10.Attaelmanan AG, Borg E, Grondahl HG. Signal-to-noise ratios of 6 intraoral digital sensors. Oral Surg Oral Med Oral Pathol Oral Radiol Endod 2001; 91: 611–15. doi: 10.1067/moe.2001.113590 [DOI] [PubMed] [Google Scholar]
- 11.Hayakawa Y, Farman AG, Kelly MS, Kuroyanagi K. Intraoral radiographic storage phosphor image mean pixel values and signal-to-noise ratio: effects of calibration. Oral Surg Oral Med Oral Pathol Oral Radiol Endod 1998; 86: 601–5. [DOI] [PubMed] [Google Scholar]
- 12.Wenzel A. Sensor noise in direct digital imaging (the RadioVisioGraphy, Sens-a-Ray, and Visualix/Vixa systems) evaluated by subtraction radiography. Oral Surg Oral Med Oral Pathol 1994; 77: 70–4. [DOI] [PubMed] [Google Scholar]
- 13.Bechara B, McMahan C, Moore WS, Noujeim M, Teixeira FB, Geha H. Cone beam CT scans with and without artefact reduction in root fracture detection of endodontically treated teeth. Dentomaxillofac Radiol 2013; 42: 20120245. doi: 10.1259/dmfr.20120245 [DOI] [PMC free article] [PubMed] [Google Scholar]
- 14.Paul J, Jacobi V, Farhang M, Bazrafshan B, Vogl TJ, Mbalisike EC. Radiation dose and image quality of X-ray volume imaging systems: cone-beam computed tomography, digital subtraction angiography and digital fluoroscopy. Eur Radiol 2013; 23: 1582–93. [DOI] [PubMed] [Google Scholar]
- 15.Molteni R. Prospects and challenges of rendering tissue density in Hounsfield units for cone beam computed tomography. Oral Surg Oral Med Oral Pathol Oral Radiol 2013; 116: 105–19. doi: 10.1016/j.oooo.2013.04.013 [DOI] [PubMed] [Google Scholar]
- 16.Cassetta M, Stefanelli LV, Pacifici A, Pacifici L, Barbato E. How accurate is CBCT in measuring bone density? A comparative CBCT-CT in vitro study. Clin Implant Dent Relat Res Jan 2013. Epub ahead of print. doi: 10.1111/cid.12027 [DOI] [PubMed]
- 17.Araki K, Okano T. The effect of surrounding conditions on pixel value of cone beam computed tomography. Clin Oral Implants Res 2013; 24: 862–5. doi: 10.1111/j.1600-0501.2011.02373.x [DOI] [PubMed] [Google Scholar]
- 18.Grauer D, Cevidanes LS, Proffit WR. Working with DICOM craniofacial images. Am J Orthod Dentofacial Orthop 2009; 136: 460–70. doi: 10.1016/j.ajodo.2009.04.016 [DOI] [PMC free article] [PubMed] [Google Scholar]