

Abstract
Objectives:
To determine the optimal kVp setting for a particular cone beam CT (CBCT) device by maximizing technical image quality at a fixed radiation dose.
Methods:
The 3D Accuitomo 170 (J. Morita Mfg. Corp., Kyoto, Japan) CBCT was used. The radiation dose as a function of kVp was measured in a cylindrical polymethyl methacrylate (PMMA) phantom using a small-volume ion chamber. Contrast-to-noise ratio (CNR) was measured using a PMMA phantom containing four materials (air, aluminium, polytetrafluoroethylene and low-density polyethylene), which was scanned using 180 combinations of kVp/mA, ranging from 60/1 to 90/8. The CNR was measured for each material using PMMA as background material. The pure effect of kVp and mAs on the CNR values was analysed. Using a polynomial fit for CNR as a function of mA for each kVp value, the optimal kVp was determined at five dose levels.
Results:
Absorbed doses ranged between 0.034 mGy mAs−1 (14 × 10 cm, 60 kVp) and 0.108 mGy mAs−1 (14 × 10 cm, 90 kVp). The relation between kVp and dose was quasilinear (R2 > 0.99). The effect of mA and kVp on CNR could be modelled using a second-degree polynomial. At a fixed dose, there was a tendency for higher CNR values at increasing kVp values, especially at low dose levels. A dose reduction through mA was more efficient than an equivalent reduction through kVp in terms of image quality deterioration.
Conclusions:
For the investigated CBCT model, the most optimal contrast at a fixed dose was found at the highest available kVp setting. There is great potential for dose reduction through mA with a minimal loss in image quality.
Keywords: cone beam computed tomography, image contrast, radiation dose, optimization
Introduction
Cone beam CT (CBCT) has been applied in dentistry for 15 years. It is commonly used for a variety of dental, maxillofacial and other head and neck applications.1 An increasing number of CBCT models are available in the market, exhibiting a wide range in exposure factors.2 Most notably, field of view (FOV) sizes range from a few cubic centimetres to a few thousand cubic centimetres and peak voltage (kVp) values vary between 60 and 120 kV. In addition, tube current–time product (mAs) values between 8 and 192 have been reported in dosimetric literature on CBCT.3,4
The effect of the FOV size on dose is well documented, and several studies have pointed out the need for FOV limitation in clinical practice.5 As for kVp and mAs, there have been several investigations on its effect on image quality in CBCT and CT.6–11 The relationship between mAs and patient dose is straightforward, as there is a 1:1 linear relation when other exposure factors are kept constant. Regarding image quality, a higher mAs decreases image noise by increasing the signal at the detector. The effect of kVp on dose and image quality is more intricate owing to a combination of several energy-dependent X-ray interactions. In addition, a higher kVp value increases not only the mean energy of the photons in an X-ray beam, but the amount of photons as well. For these reasons, it has always been a challenge to optimize kVp and mAs settings in diagnostic radiology. The effect of changing one or both exposure factors on image quality and dose is not straightforward and should be properly balanced, ensuring that an adequate image quality is achieved at the lowest possible dose level. The analysis of technical image quality (e.g. noise) provides an objective method to investigate this balance.
The objective of this study was to determine the optimal kVp setting for a particular CBCT device by maximizing technical image quality at a fixed radiation dose.
Methods and materials
Cone beam CT device
To quantify the isolated and combined effect of kVp and mAs on image quality and radiation dose, the 3D Accuitomo 170 (J. Morita Mfg. Corp., Kyoto, Japan) was selected, as it allows for the selection of a wide range of exposure parameters. Technical specifications of the 3D Accuitomo 170 are listed in Table 1.
Table 1.
Technical specifications of the 3D Accuitomo 170 (J. Morita Mfg. Corp., Kyoto, Japan) cone beam CT
| Voltage | 60–90 kVp |
| Tube current | 1–8 mA (high-dose mode) |
| 1–10 mA (low-dose mode) | |
| Exposure time | 9.0 s (high-speed mode) |
| 17.5 s (standard mode) | |
| 31.0 s (high-dose mode) | |
| Exposure type | Continuous |
| Focal spot | 0.5 mm |
| Filtration | ≥3.1 mm Al |
| Beam angle | 5° |
| Anode material | Tungsten |
| Half-value layer | 60 kVp: 1.9 mmAl |
| 70 kVp: 2.1 mmAl | |
| 80 kVp: 2.9 mmAl | |
| 90 kVp: 3.2 mmAl | |
| Field of view size | 4 × 4, 6 × 6, 8 × 8, 10 × 5, 10 × 10, 14 × 5, 14 × 10, 17 × 5 and 17 × 12 cm |
| Source-to-isocentre distance | 740–840 mm |
| Detector type | CsI-aSi flat panel detector |
| Reconstruction algorithm | Feldkamp et al12 |
Al, aluminium.
Radiation dosimetry
To evaluate the effect of kVp on the absorbed dose, the SedentexCT DI phantom (Leeds Test Objects Ltd, Boroughbridge, UK) was used. It is a phantom similar to conventional CT dose index (CTDI) phantoms used in multidetector CT (MDCT) imaging, as it is a 16-cm polymethyl methacrylate (PMMA) cylinder with central and peripheral holes allowing for the placement of an ion chamber. However, the phantom is customized towards recent evolutions in CBCT imaging. Holes at different distances from the centre are available, enabling the measurement of dose gradients along the diameter of the phantom or isocentre doses at various off-centre positions of the FOV, which is a more suitable dosimetric approach for dental CBCT.13
Dose measurements were performed for three FOV sizes (4 × 4, 8 × 8 and 14 × 10 cm). To mimic a dental CBCT scan, FOVs were positioned more centrally for larger FOVs and more peripherally for smaller FOVs, ensuring that the isocentre corresponded to the centre of one of the phantom's holes (Figure 1). All dose measurements were performed at mid-height at the isocentre with a Farmer-type ion chamber calibrated in an X-ray beam with a standard radiation quailty (RQR5). A customized PMMA insert was used to accommodate the ion chamber, as its diameter was much smaller than that of the phantom holes. Unused holes were filled up with PMMA cylinders. For each FOV, the absorbed dose was measured between 60 and 90 kVp with steps of 2 kV, fixing other exposure factors at 8 mA, 360° rotation and 31.0 s exposure time. Because of the linearity between mA and the radiation dose, the absorbed dose for all other mA values could be extrapolated.
Figure 1.

Schematic representation of SedentexCT DI phantom (top view). White circles correspond to holes available for ion chamber placement. Field of view (FOV) positions for all three FOV sizes are shown as dark grey circles. “×” marks the isocentre of the FOV and the position of the ion chamber. A, anterior; P, posterior.
Image quality evaluation
To measure the contrast-to-noise ratio (CNR), the SedentexCT IQ phantom was used. This cylindrical PMMA phantom is identical in size to the dosimetric phantom but is customized for image quality evaluation on CBCT through the use of various cylindrical inserts (34.5 mm diameter and 20 mm height), which can be placed at the centre or periphery of the phantom.14
The phantom was scanned using the 8 × 8 cm FOV, using an exposure time of 31.0 s and a voxel size of 0.16 mm. A total of 180 scans were obtained by varying both kVp and mA. For 60, 70, 80 and 90 kVp, the full available mA range (1–8 mA and step size 0.5 mA) was used. For other kVp values, step sizes of 0.5 mA were used between 1 and 3.5 mA, and step sizes of 1.5 mA between 3.5 and 8 mA. A few additional exposure settings at exposure levels close to that of 70 kVp/5 mA were included to verify whether this would improve the accuracy of the CNR/dose analysis. For 19 exposure settings with ranging radiation doses, scans were repeated to check for reproducibility.
Four materials of varying densities were used within the phantom inserts: air, low-density polyethylene (LDPE), polytetrafluoroethylene (PTFE) and aluminium (Al) (Table 2). Two types of insert designs were used (Figure 2). For air and Al, an individual insert was used, containing a central cylindrical rod (10 mm diameter). LDPE and PTFE were combined in a single insert, consisting of slabs of 25 mm diameter and 3.3 mm height. Each scan contained all materials to avoid histogram shifting, which could occur if inserts would be scanned separately.15
Table 2.
Materials used for contrast-to-noise ratio measurements
| Material | Density (103 kg m−3) |
|---|---|
| Air | 0.00 |
| Low-density polyethylene | 0.92 |
| Polytetrafluoroethylene | 2.16 |
| Aluminium | 2.70 |
| Polymethyl methacrylatea | 1.19 |
Used as background material.
Figure 2.

Four materials used for contrast-to-noise ratio measurement. Top row, 10-mm cylinders; bottom row, 20-mm cylinders. Images are not to scale. Al, aluminium; LDPE, low-density polyethylene; PTFE, polytetrafluoroethylene.
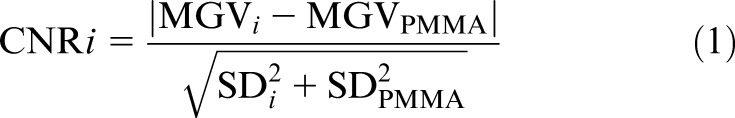
For each material, the mean grey value (MGV) and standard deviation (SD) were measured using ImageJ (US National Institutes of Health, Bethesda, MD). For the first type of insert, a region of interest (ROI) of 47 mm2 (1844 voxels) was used, and measurements were performed over 20 consecutive slices at the middle of the height of the rod. For the second type of insert, a larger ROI (304 mm2 and 11 869 voxels) was used, and measurements were done over three consecutive slices. The MGV and SD of PMMA were measured using an ROI within a homogeneous area between the inserts. PMMA values were measured for each material separately within the same axial slices, to take potential inhomogeneity of grey values along the z-axis into account. For all scans obtained in the same scanning session (i.e. without repositioning or moving the phantom), the ROI was determined on one scan and reproduced exactly for all other scans using a custom macro written for ImageJ. This allowed for measurements to be performed in batch and ensured consistency between ROI positions by eliminating operator variability. The CNR for each material i was calculated as:
 |
The absolute value was used for convenience in plotting, as CNR values for air and LDPE would otherwise be negative.
The effect of exposure parameters on CNR and its ratio to radiation dose was evaluated in three ways: (1) pure effect of mA with fixed kVp, (2) pure effect of kVp with fixed mA and (3) effect of kVp at fixed dose levels. For this third evaluation, five dose levels were determined, ranging from 3.28 to 16.38 mGy with steps of 3.28 mGy. These dose levels correspond to the absorbed doses of 90 kVp, 1–5 mA, which were linearly extrapolated from our experimentally determined dose value for 90 kVp, 8 mA and 8 × 8 cm. For each kVp value used in the dosimetry part of the study (i.e. 60–90 with 2-kV steps), the theoretical mA values required to reach each dose level were calculated. The theoretical mA values were not rounded to the nearest 0.5-mA interval. The CNRs corresponding to each theoretical mA value were estimated using the mA–CNR curves obtained from the first evaluation.
To aid the interpretation of the experimental results, the contribution of the different photon interactions (i.e. photoabsorption, Compton scatter and Rayleigh scatter) at diagnostic X-ray energies was calculated using an online tool (http://web-docs.gsi.de/∼stoe_exp/web_programs/x_ray_absorption/index.php; G Weber, GSI Helmholtzzentrum für Schwerionenforschung, Darmstadt, Germany) based on X-ray interaction data from the National Institute of Standards and Technology (Gaithersburg, MD).
Results
The relation between kVp and absorbed dose for the three included FOVs is shown in Figure 3. The dose varied between 0.034 mGy mAs−1 (14 × 10 cm and 60 kVp) and 0.108 mGy mAs−1 (14 × 10 cm and 90 kVp). Although each FOV showed a slight tendency for an exponential relation between kVp and dose, the relation was quasilinear for the kVp range used in this study, as seen by the high coefficients of determination for a linear fit (R2 = 0.994–0.996). Compared with 90 kVp, the reduction in dose per mAs was 24.6% for 80 kVp, 47.6% for 70 kVp and 66.1% for 60 kVp.
Figure 3.

Absorbed dose (mGy mAs−1) as a function of kVp for three field of view sizes.
Figure 4 illustrates the effect of varying the mA and kVp values on noise for the air insert. The relation between CNR, mA and kVp could be modelled accurately (R2 > 0.99) using a second-degree polynomial (Figures 5 and 6). The shape of the curves somewhat resembles that of a logarithmic curve and confirms visual findings from Figure 4 showing a pronounced effect of kVp/mA on CNR at low exposure levels and a subtle effect at high exposure levels. The CNR for the default exposure setting of 90 kVp/5 mA was 21.5 for Al, 6.0 for PTFE, 3.2 for LDPE and 12.2 for air. The ratio between the highest and lowest CNR values (i.e. 90 kVp/8 mA and 60 kVp/1 mA) was 7.6 for Al, 7.9 for PTFE, 7.7 for LDPE and 9.8 for air, whereas the ratio in absorbed dose between these extreme exposure settings was 23.6.
Figure 4.

Axial slice of air insert at various mA (top) and kVp (bottom) settings. CNR, contrast-to-noise ratio.
Figure 5.

Contrast-to-noise ratio (CNR) as a function of mA. Al, aluminium; LDPE, low-density polyethylene; PTFE, polytetrafluoroethylene.
Figure 6.

Contrast-to-noise ratio (CNR) as a function of kVp. Al, aluminium; LDPE, low-density polyethylene; PTFE, polytetrafluoroethylene.
Table 3 shows the dose-normalized mA for each kVp value included in this study. The mA values corresponding to the lowest of five dose levels (i.e. 90 kVp/1 mA) are shown; for the other dose levels, the normalized mA values can be calculated by multiplying the values in Table 3 by the mA of the reference levels (e.g. dose level of 90 kVp/5 mA for 80 kVp = 5 × 1.33 = 6.65 mA).
Table 3.
Dose-normalized mA for each kVp value
| kVp | mA | kVp | mA |
|---|---|---|---|
| 90 | 1.00 | 74 | 1.64 |
| 88 | 1.05 | 72 | 1.76 |
| 86 | 1.11 | 70 | 1.91 |
| 84 | 1.18 | 68 | 2.07 |
| 82 | 1.25 | 66 | 2.24 |
| 80 | 1.33 | 64 | 2.45 |
| 78 | 1.43 | 62 | 2.68 |
| 76 | 1.53 | 60 | 2.95 |
Figure 7 shows the CNR for each kVp value at the five pre-determined dose levels. CNRs at mA values >8 mA were not calculated, as the polynomial curves used for these estimations are only valid between 1 and 8 mA. As a result, for higher dose levels, CNR estimations could not be made for low kVp values. The dose-normalized CNR shows two-fold consistency. Firstly, the CNR increases with the kVp with the highest value corresponding with 90 kVp, with a few exceptions in which the CNR was relatively constant at higher kVp values. Secondly, the increase in CNR as a function of kVp is more pronounced at lower dose levels. For the lowest dose level (90 kVp/1 mA), the CNR for Al/PTFE/LDPE/air was 34%/39%/43%/57% higher at 90 kVp than at 60 kVp. For the highest dose level, only air showed a clear increase in CNR at higher kVp values, whereas Al showed a slight incremental increase up to 84 kVp, above which the values fluctuated by approximately 1%. PTFE and LDPE showed an almost constant CNR at the highest dose level.
Figure 7.

Contrast-to-noise ratio (CNR) as a function of kVp at a fixed radiation dose. The CNR for a dose-normalized mA value was calculated for each kVp using the curves in Figure 5. Five dose levels are shown with absorbed doses of 3.3–16.4 mGy. Dose(x, y): dose level for x kV, y mA. Al, aluminium; LDPE, low-density polyethylene; PTFE, polytetrafluoroethylene.
Figure 8 shows the effect of X-ray energy (30–120 keV) on the probability of interaction for a photon traversing 14 cm of PMMA (i.e. a rough estimation of the average distance of PMMA traversed for the phantom set-up used in this study). The graph shows a large decrease in photoabsorption probability at increasing X-ray energy (30 keV: 48.1%; 120 keV: 1.3%) and a corresponding increase in the probability of Compton scattering (30 keV: 38.3%; 120 keV: 86.3%). Rayleigh scattering (i.e. Thompson or coherent scattering) shows a five-fold reduction within the displayed energy range (30 keV: 13.5%; 120 keV: 2.8%). Nearly all (99.9%) photons at 30 keV are totally attenuated, whereas 90.5% of photons are attenuated at 120 keV.
Figure 8.

The effect of X-ray energy on the probability of interactions for a photon traversing 14 cm of polymethyl methacrylate.
Discussion
In this study, the effect of kVp and mA on contrast, noise and radiation dose was assessed. Two PMMA phantoms, providing similar X-ray attenuation levels to an adult human head, were used to investigate the effect of kVp on radiation dose and the effect of kVp/mA on CNR.
Dosimetric results were consistent between the three investigated FOVs, with similar mGy mAs−1 values and a quasilinear relation between kVp and dose. It is important to note that the linear fit does not intercept at zero, limiting its applicability. A quadratic fit would intercept close to zero and can be assumed to be more realistic, especially at higher kVp values. In a Monte Carlo simulation study by Zhang et al,16 the effective dose was estimated for different human phantoms using the same CBCT model as in this study, showing a quadratic relation between kVp and dose, similar to Figure 3.
To evaluate the effect of kVp and mA on image quality, CNR was used. The CNR is a widely used image quality parameter and can be easily interpreted. In CT or CBCT imaging, as grey values are relatively independent of exposure factors, only the noise varies as a function of kVp and mA. The CNR has been used in a few previous studies on dental CBCT, some of which used similar phantoms or materials.14,17–20 However, since the noise is expressed as the SD of grey values, noise values are considerably affected by the voxel size. Therefore, owing to the wide range of voxel sizes used in dental CBCT, it is not possible to compare CNR values from different studies, even if the same phantoms or materials are used. In this study, the voxel size was fixed, ensuring that fluctuations in CNR are solely an effect of changes in mA and kVp. The possibility of a correction factor for noise based on the voxel size should be further investigated, as this would broaden the applicability of CNR in dental CBCT.
The results provide valuable insights regarding the relation between dose and image quality, with several implications for dose optimization. First of all, for the CBCT device included in this study, the highest kVp value (i.e. 90 kVp) is preferred, as it results in the highest CNR at a fixed radiation dose, especially at low dose levels. This implies that low-dose protocols should consist of an mA reduction rather than a kVp reduction, as the increase in noise for a given dose reduction would be smaller for the former.
Compared with the effect of mA, the effect of kVp on radiation dose is slightly more intricate, especially in the context of CT. Higher kVp values increase the mean energy of the X-ray beam, which results in higher X-ray penetration by decreasing the probability of X-ray interactions (Figure 8). However, a higher kVp value increases the amount of X-ray photons as well. Furthermore, X-ray photons with a higher energy have more energy to deposit before their extinction. As the latter effects are predominant, dose increases with kVp when other parameters are constant, as shown in Figure 3.
The primary effect of kVp on image quality can also be explained by looking at the dominant X-ray interactions at diagnostic energies. Higher kVp values increase the signal at the X-ray detector owing to the increased photon count and a decreased absorption ratio. However, the difference in X-ray attenuation between tissues of varying densities is decreased at higher kVp values, which can lead to a decreased image contrast. This multifold effect is further complicated by the nature of CT imaging, in which contrast is determined by the complementary information of projectional data from many angles rather than the pure signal and contrast at the detector alone. The paradigm of increasing contrast at lower beam energies, while valid to some extent in two-dimensional radiography, may therefore not be fully applicable to CT. The “contrast” part of the CNR calculation can be considered as relatively fixed in CT imaging since average grey values of a given material are independent of exposure parameters, even in CBCT where calibrated grey values (i.e. HU) are generally not valid.15 In this study, because of the use of a fixed scanning set-up (i.e. phantom size, composition and position), grey values were consistent between exposure protocols, and differences in CNR were primarily caused by the “noise” part of the equation. A side effect of this is that the nature of the CNR–kVp relationship, which was evaluated in this study using four materials and PMMA as a background material, is also valid for high-contrast (i.e. air/Al) or low-contrast (e.g. air/LDPE or PTFE/Al) interfaces.
In CBCT imaging, the use of a cone- or pyramid-shaped beam in conjunction with a two-dimensional detector array leads to much higher scatter-to-primary ratios than in CT. This indicates that noise reduction by limiting the amount of scatter in CBCT can be more important than achieving a high pure contrast at the level of the detector, which would rationalize the use of relatively high kVp values as indicated by the current study. As shown in Figure 8, the probability of Compton scattering increases considerably within the range of X-ray energies used in this study. However, following the Klein–Nishina formula, there is a wide angular distribution of scattered photons at these relatively low energies, with only a small fraction (5–10%) being directed towards the detector. In addition, Figure 8 shows a three-fold decrease in Rayleigh scattering between 30 and 90 keV. Between 40 and 50 keV (i.e. the approximate mean X-ray energies at 60 and 90 kVp), the probability of Rayleigh scatter decreases from 12.4% to 10.2%. Rayleigh scattering occurs mainly in the forward direction with no loss of energy. Therefore, Rayleigh scattered photons are much more likely to reach the detector and contribute to image noise than Compton scattered photons. From the results in this study, it can be concluded that the decrease in Rayleigh scattering at higher energies leads to lower scatter-to-primary ratios at isodose levels, corresponding with a lower image noise. This effect was mainly apparent at low dose levels (i.e. high noise levels), as shown in Figure 7. At increasingly higher beam energies up to 120 keV, the probability of Compton scatter flattens, whereas Rayleigh scattering keeps steadily decreasing (Figure 8), which could result in an even higher scatter-to-primary ratio. However, the Klein–Nishina formula states that an increasingly larger fraction of Compton scatter will be directed forward at higher beam energies, implying that the increase in Compton scatter may overcompensate for the decrease in Rayleigh scatter at some point.
It remains to be seen whether these findings are consistent for other CBCT devices, and whether a true optimal kVp value can be found. It can be expected that, at some point, the flattening of the CNR–kVp curve and the exponential relation between kVp and dose would result in a kVp value at which the CNR/dose relation peaks. The results in this study and the interaction probabilities in Figure 8 indicate that this optimal value could be >90 kVp. This peak value and its consistency between CBCT devices with varying hardware and software should be investigated more deeply. However, researchers are limited by the available options on existing CBCT devices, many of which fix the kVp and allow only a few preset mA options. Monte Carlo simulations provide a possible solution for this practical limitation.16 When using Monte Carlo in this context, the entire imaging chain would have to be modelled, including the image reconstruction. Only then would it be possible to investigate whether the balance between kVp, mAs, image quality and radiation dose is robust and whether there is a “perfect” kVp value for dental CBCT imaging. Ideally, the beam filtration should be considered together with the kVp value, as it determines the X-ray energy spectrum.
Apart from determining the optimal kVp value for the investigated CBCT equipment, the current results also show the potential for mA reduction with minimal loss in image quality. The shape of the mA curve implies that the mA can be lowered up to a certain point with little increase in noise. In this study, for a voltage of 90 kVp, a reduction in mA from 5 to 4 (20% dose reduction) resulted in an 8.6% decrease in CNRAIR, whereas an mA reduction from 3 to 2 (40% and 60% dose reduction compared with 5 mA) decreased the CNRAIR by 17.5%. Although the CNR is a pure technical image quality factor, these findings can have important implications for clinical practice. Reference levels for CNR in CBCT are difficult to determine because diagnostic image quality does not only depend on contrast and noise but on spatial resolution as well. In addition, CBCT is still lacking objective criteria regarding the diagnostic acceptability of an image. Therefore, when analysing phantom images from any given CBCT device, it is not possible to distinguish between clinically acceptable and unacceptable CNR values. However, specific CNR–mA curves can be determined for each CBCT by the manufacturer or during acceptance testing, giving an indication to the clinician to which level the mA could be lowered with minimal increase in noise. Using this knowledge, the clinician can take informed decisions about the application of low-dose protocols for certain patient groups.
The effect of kVp and mA in CBCT for dental or head and neck applications has been investigated by different authors, with most studies focusing on the effect of kVp and mAs reduction on image quality. Varying results were reported, depending on a multitude of factors such as the evaluated image quality criteria, equipment, exposure factors, amount of dose reduction etc. Several studies found that CBCT exposures can be lowered considerably with diagnostic image quality remaining adequate.6–11 Combining these previous studies with the results of the current study, it can be concluded that possible dose reduction using exposure parameters below manufacturers' default setting should always be explored, particularly for children. Siegel et al21 investigated various combinations of exposure settings for paediatric CT, concluding that, for smaller phantoms or patients, the increase in noise at low-dose settings is minimal. It can be expected that this is true in CBCT as well, implying that severe dose reductions for paediatric patients can be achieved compared with standard adult clinical settings. A technical evaluation using small-size phantoms could provide a valuable addition to the current study, as it would indicate if (and by how much) the CNR–mA and CNR–kVp curves shift to the left at increasingly smaller phantom sizes.
The potential of using automatic exposure control in dental CBCT should also be further investigated. To our knowledge, there is one manufacturer (QR Srl, Verona, Italy) applying automatic exposure control on its CBCT models, varying the mAs based on the density distribution of a scout image. The use of preset angular exposure modulation, in which the exposure is varied during the rotation to obtain a constant detector signal, has also been introduced. As automatic exposure control is now widely used in CT imaging, leading to significant dose reduction for paediatric and adult patients,22,23 it can be expected that its use in CBCT will increase as well,24 avoiding the need for manual adaptation of exposure parameters based on patient size.
In conclusion, for the CBCT device included in this study, the highest selectable kVp (i.e. 90 kVp) was optimal, particularly at lower dose levels. It can be recommended that low-dose protocols should consist of an mA reduction instead of a kVp reduction, as this would result in a smaller image quality degradation.
References
- 1.Scarfe WC, Li Z, Aboelmaaty W, Scott SA, Farman AG. Maxillofacial cone beam computed tomography: essence, elements and steps to interpretation. Aust Dent J 2012; 57(Suppl. 1): 46–60. doi: 10.1111/j.1834-7819.2011.01657.x [DOI] [PubMed] [Google Scholar]
- 2.Nemtoi A, Czink C, Haba D, Gahleitner A. Cone beam CT: a current overview of devices. Dentomaxillofac Radiol 2013; 42: 20120443. doi: 10.1259/dmfr.20120443 [DOI] [PMC free article] [PubMed] [Google Scholar]
- 3.Qu XM, Li G, Ludlow JB, Zhang ZY, Ma XC. Effective radiation dose of ProMax 3D cone-beam computerized tomography scanner with different dental protocols. Oral Surg Oral Med Oral Pathol Oral Radiol Endod 2010; 110: 770–6. doi: 10.1016/j.tripleo.2010.06.013 [DOI] [PubMed] [Google Scholar]
- 4.Ludlow JB, Ivanovic M. Comparative dosimetry of dental CBCT devices and 64-slice CT for oral and maxillofacial radiology. Oral Surg Oral Med Oral Pathol Oral Radiol Endod 2008; 106: 106–14. doi: 10.1016/j.tripleo.2008.03.018 [DOI] [PubMed] [Google Scholar]
- 5.Pauwels R, Beinsberger J, Collaert B, Theodorakou C, Rogers J, Walker A, et al. Effective dose range for dental cone beam computed tomography scanners. Eur J Radiol 2012; 81: 267–71. doi: 10.1016/j.ejrad.2010.11.028 [DOI] [PubMed] [Google Scholar]
- 6.Güldner C, Ningo A, Voigt J, Diogo I, Heinrichs J, Weber R, et al. Potential of dosage reduction in cone-beam-computed tomography (CBCT) for radiological diagnostics of the paranasal sinuses. Eur Arch Otorhinolaryngol 2013; 270: 1307–15. doi: 10.1007/s00405-012-2177-2 [DOI] [PubMed] [Google Scholar]
- 7.Kwong JC, Palomo JM, Landers MA, Figueroa A, Hans MG. Image quality produced by different cone-beam computed tomography settings. Am J Orthod Dentofacial Orthop 2008; 133: 317–27. doi: 10.1016/j.ajodo.2007.02.053 [DOI] [PubMed] [Google Scholar]
- 8.Lofthag-Hansen S, Thilander-Klang A, Gröndahl K. Evaluation of subjective image quality in relation to diagnostic task for cone beam computed tomography with different fields of view. Eur J Radiol 2011; 80: 483–8. doi: 10.1016/j.ejrad.2010.09.018 [DOI] [PubMed] [Google Scholar]
- 9.Panmekiate S, Apinhasmit W, Petersson A. Effect of electric potential and current on mandibular linear measurements in cone beam CT. Dentomaxillofac Radiol 2012; 41: 578–82. doi: 10.1259/dmfr/51664704 [DOI] [PMC free article] [PubMed] [Google Scholar]
- 10.Dawood A, Brown J, Sauret-Jackson V, Purkayastha S. Optimization of cone beam CT exposure for pre-surgical evaluation of the implant site. Dentomaxillofac Radiol 2012; 41: 70–4. doi: 10.1259/dmfr/16421849 [DOI] [PMC free article] [PubMed] [Google Scholar]
- 11.Sur J, Seki K, Koizumi H, Nakajima K, Okano T. Effects of tube current on cone-beam computerized tomography image quality for presurgical implant planning in vitro. Oral Surg Oral Med Oral Pathol Oral Radiol Endod 2010; 110: e29–33. doi: 10.1016/j.tripleo.2010.03.041 [DOI] [PubMed] [Google Scholar]
- 12.Feldkamp LA, Davis LC, Kress JW. Practical cone-beam algorithm. J Opt Soc Am 1984; 1: 612–19. [Google Scholar]
- 13.Pauwels R, Theodorakou C, Walker A, Bosmans H, Jacobs R, Horner K, et al. Dose distribution for dental cone beam CT and its implication for defining a dose index. Dentomaxillofac Radiol 2012; 41: 583–93. doi: 10.1259/dmfr/20920453 [DOI] [PMC free article] [PubMed] [Google Scholar]
- 14.Pauwels R, Stamatakis H, Manousaridis G, Walker A, Michielsen K, Bosmans H, et al. Development and applicability of a quality control phantom for dental cone-beam CT. J Appl Clin Med Phys 2011; 12: 245–60. doi: 10.1120/jacmp.v12i4.3478 [DOI] [Google Scholar]
- 15.Pauwels R, Nackaerts O, Bellaiche N, Stamatakis H, Tsiklakis K, Walker A, et al. Variability of dental cone beam CT grey values for density estimations. Br J Radiol 2013; 86: 20120135. doi: 10.1259/bjr.20120135 [DOI] [PMC free article] [PubMed] [Google Scholar]
- 16.Zhang G, Marshall N, Bogaerts R, Jacobs R, Bosmans H. Monte Carlo modeling for dose assessment in cone beam CT for oral and maxillofacial applications. Med Phys 2013; 40: 072103. doi: 10.1118/1.4810967 [DOI] [PubMed] [Google Scholar]
- 17.Bamba J, Araki K, Endo A, Okano T. Image quality assessment of three cone beam CT machines using the SEDENTEXCT CT phantom. Dentomaxillofac Radiol 2013; 42: 20120445. doi: 10.1259/dmfr.20120445 [DOI] [PMC free article] [PubMed] [Google Scholar]
- 18.Ludlow JB, Walker C. Assessment of phantom dosimetry and image quality of i-CAT FLX cone-beam computed tomography. Am J Orthod Dentofacial Orthop 2013; 144: 802–17. doi: 10.1016/j.ajodo.2013.07.013 [DOI] [PMC free article] [PubMed] [Google Scholar]
- 19.Suomalainen A, Kiljunen T, Käser Y, Peltola J, Kortesniemi M. Dosimetry and image quality of four dental cone beam computed tomography scanners compared with multislice computed tomography scanners. Dentomaxillofac Radiol 2009; 38: 367–78. doi: 10.1259/dmfr/15779208 [DOI] [PubMed] [Google Scholar]
- 20.Peltonen LI, Aarnisalo AA, Käser Y, Kortesniemi MK, Robinson S, Suomalainen A, et al. Cone-beam computed tomography: a new method for imaging of the temporal bone. Acta Radiol 2009; 50: 543–8. doi: 10.1080/02841850902839700 [DOI] [PubMed] [Google Scholar]
- 21.Siegel MJ, Schmidt B, Bradley D, Suess C, Hildebolt C. Radiation dose and image quality in pediatric CT: effect of technical factors and phantom size and shape. Radiology 2004; 233: 515–22. doi: 10.1148/radiol.2332032107 [DOI] [PubMed] [Google Scholar]
- 22.Vazquez JL, Pombar MA, Pumar JM, del Campo VM. Optimised low-dose multidetector CT protocol for children with cranial deformity. Eur Radiol 2013; 23: 2279–87. doi: 10.1007/s00330-013-2806-1 [DOI] [PubMed] [Google Scholar]
- 23.Papadakis AE, Perisinakis K, Damilakis J. Automatic exposure control in pediatric and adult multidetector CT examinations: a phantom study on dose reduction and image quality. Med Phys 2008; 35: 4567–76. doi: 10.1118/1.2977535 [DOI] [PubMed] [Google Scholar]
- 24.Pauwels R, Jacobs R, Bosmans H, Schulze R. Future prospects for dental cone beam CT imaging. Imaging Med 2012; 4: 551–63. doi: 10.2217/IIM.12.45 [DOI] [Google Scholar]