Abstract
For almost a century, epidemiologists have stratified age-specific disease rates by year of birth to better understand the distribution of a disease in a population and its evolution across time. In the present article, I review the contributions of John Brownlee, Kristian Feyer Andvord, and Wade Hampton Frost and, to accentuate the similarities of their approaches, redraw their original graphs of age-specific death rates of tuberculosis organized either by year of death or year of birth. In addition, this article reports on an apparently universally forgotten publication in the American Journal of Hygiene published in 1929, which both upsets the conventional history of the earliest reports of disease rates stratified by birth cohorts and challenges the theory that Frost discovered cohort analysis independently and gave it its name.
Keywords: cohort analysis, tuberculosis, typhoid, vital statistics
Age-specific incidence or mortality rates may tell a different story if organized by year of birth or by year of death. This seems trivial, right? The notions of age, period, and cohort effects have been in textbooks of epidemiology for at least 50 years (1). However, if we move back another 50 years, say to 1910, there are no obvious traces of these concepts. What happened between 1910 and 1960? Who first analyzed the age distribution of a disease, contrasting the rate trends when organized by year of death or by year of birth? Who introduced the word “cohort” into the field of epidemiology to characterize a group of people born during a defined period and followed across time?
In the present article, I first review the existing literature to answer these questions. To accentuate the similarities and differences across the reviewed material, which were published in different languages, the original graphs for year-of-death and year-of-birth analyses have been redrawn and translated and their axes have been consistently labeled.
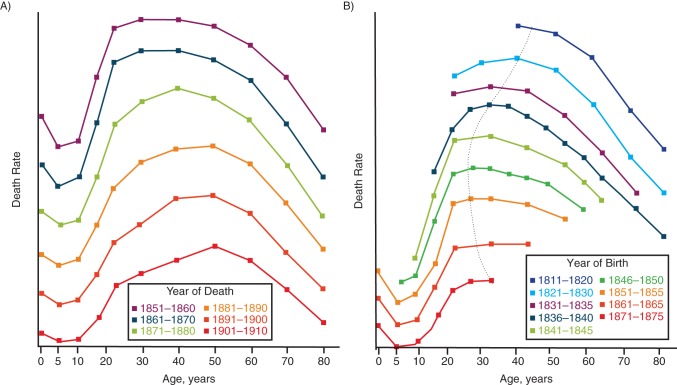
Conventional knowledge indicates that the idea of looking at mortality data longitudinally rather than cross-sectionally goes back at least to John Brownlee (1868–1927), who in 1916 reported trends in mortality from “phthisis,” an old term which had then become synonymous to pulmonary tuberculosis (2, 3). Brownlee, a doctor of medicine and the Director of the Department of Statistics of the Medical Research Council in the United Kingdom since 1914 (4), noticed that the age distribution of phthisis mortality varied across localities (e.g., London, Surrey, Lancashire, Yorkshire) and could be categorized into 3 types, which he called “pure,” “young age,” and “old age.” The pure type was symmetrical around a maximum death rate occurring in the “middle age” (47 years of age). The young age type had a peak death rate between the ages of 20 and 30 years, and in the old age type, the peak occurred at a much older age (e.g., 65 years). Brownlee's idea was that a different mix of these 3 types explained the geographic variation in the age distributions of mortality rates from phthisis. However, the mix could have potential pitfalls. For example, comparing the age distributions of mortality rates for different years of death, as in Figure 1A, suggested a decline in the amount of the young adult type and a continual shift of the peak age toward older ages. “The common explanation given,” Brownlee noted, “has been that as phthisis became less prevalent, due to whatever cause, individuals have been becoming more immune and consequently developing the disease at higher ages” (2, p. 138). The flaw in this explanation became obvious when death rates were plotted so that a “same generation of persons [was] followed out” (2, p. 138), that is, death rates from phthisis were shown by year of birth for people born in the same 5-year period (e.g., 1811–1820, 1821–1830) as they aged until 1910 (Figure 1B). For Brownlee, this “generation analysis” showed that “instead of the age of maximum susceptibility becoming later in life, it moved backwards into the earlier years for the first two-thirds of the period under observation” (2, p. 138), as indicated by the line he drew connecting the maxima of each of the generation curves (Figure 1B). Brownlee never mentioned the actual rates and their units in his article, but between 1851 and 1910, the average rates of death from phthisis in England and Wales declined from approximately 2.5 to 1 per 1,000 persons per year.
Figure 1.
Age-specific rates of death from phthisis (no unit given), London, United Kingdom. A) Rates for 6 decades of years of death in men, England, 1851–1910. B) Rates for 8 generations, by year of birth; the dotted line connects the maximum death rates across generations. Adapted from Brownlee (2).
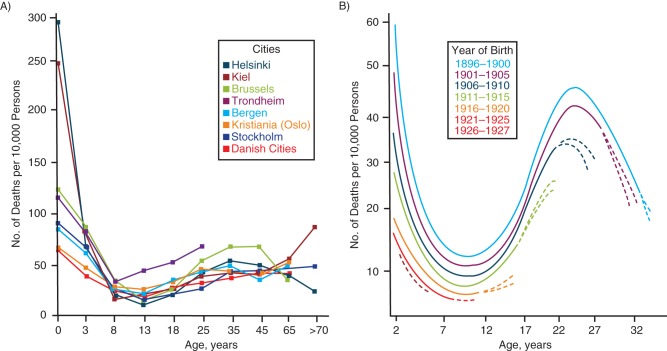
After Brownlee, literature clues indicate that the idea of generation analysis was restated and reapplied to tuberculosis mortality rates in 1930 by Kristian Feyer Andvord (1855–1934), a long-time scholar of tuberculosis (5), in an article that appeared in Norwegian and German (6) and was translated into English only 72 years later (7). As shown in Figure 2A, in 1895 Andvord continued to strictly interpret the occurrence of tuberculosis on the basis of the cross-sectional age distribution of tuberculosis mortality. In the Norwegian Journal of Medicine, Andvord stressed the “remarkable and striking consistency” of the death rates from 8 northern European cities circa 1890: “They all have an absolute maximum during the second half of the first year of life, an absolute minimum between 10 and 15 years, and a second maximum between 30 and 60 years, the latter being in general in fixed relation with the first” (8, pp. 94–95; translation by A.M.). Andvord did not mention then that these observations could be confounded by birth cohort effects. However, in 1930, Andvord submitted a paper in German in which he produced curves of tuberculosis mortality up to age 34 years for 6 “generations” born between 1896 and 1927 (Figure 2B) (6). Andvord explained that mortality rates for tuberculosis, though declining in European countries, had very regular, wave-like patterns across these generations. Mortality rates during early childhood appeared to predict mortality rates among adults 20–25 years later. His consequentialist conclusion was that reducing the mortality rate among young children would lower the whole mortality curve for that generation.
Figure 2.
Age-specific death rates from tuberculosis (per 10,000 persons), Norway. A) Rates for 8 Northern European cities, circa 1890. Adapted from Andvord (8). B) Rates for 6 generations, by year of birth between 1896 and 1927, with the dotted lines showing predicted rates. Adapted from Andvord (6).
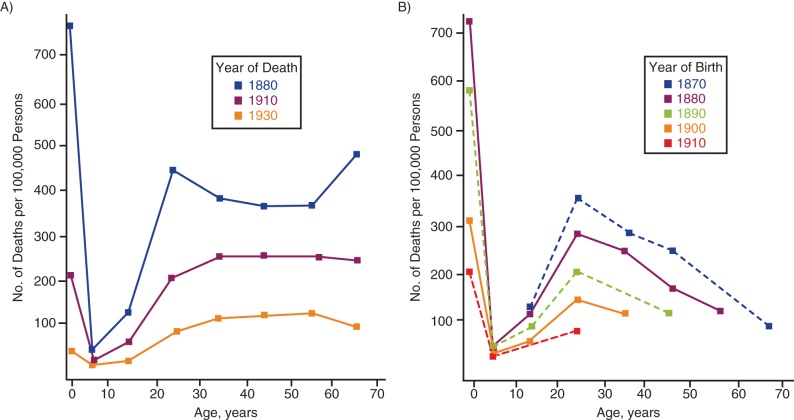
After Brownlee and Andvord, one would then—to answer my question—attribute to Wade Hampton Frost (1880–1938) the first use in epidemiology of the term “cohort” for the groups previously called “generations” by Brownlee and Andvord. In a posthumous publication of a draft (9) that was discussed in a previous article (10), Frost, the first American professor of epidemiology, came to the same conclusion that Brownlee had reached 20 years earlier: In the year-of-death graphs (Figure 3A), older age groups were shown to have higher tuberculosis mortality rates because, as revealed by birth cohort analysis (Figure 3B), they were survivors from a time when mortality rates were still high.
Figure 3.
Age-specific death rates (per 100,000 persons) from all forms of tuberculosis in men in Massachusetts. A) Rates for men who died in 1880, 1910, and 1930. B) Rates for 5 successive 10-year cohorts with years of birth between 1870 and 1910. Adapted from Frost (9).
A thorough list of pre-textbook pioneers would mention the application of cohort analysis to lung cancer by Remmelt Korteweg (1884–1961) (11). It would also highlight Morton L. Levin (1904–1995), who in 1953, under the New York State Department of Health in Albany, New York, used a graph to carefully explain the difference between “cohortal” effects and age effects and their relation to annual age-specific rates (12).
The problem is that this conventional history of the epidemiologic use of cohort analysis for studying specific diseases is incomplete. In the present article, I add a new, seemingly forgotten piece to this puzzling history: the paper entitled “Typhoid fever in Massachusetts” published by George Hoyt Bigelow (1890–ca. 1934; see Appendix 1 for details) and Carl Rupp Doering (1928–1976) in a 1929 issue of American Journal of Hygiene (13).
TYPHOID FEVER IN MASSACHUSETTS
Typhoid fever is a life-threatening gastrointestinal infection caused by the bacterium Salmonella typhi. In addition to its many nonspecific symptoms, it can cause a sustained high fever that can prostrate the patients; hence, the name of the disease was derived from the Greek τύφοσ, meaning stupor. Typhoid was the common fever of the 19th century (14). Until the mid-19th century, the occasional rash of flat, rosy spots of typhoid fever was not distinguished from the red spots of typhus; thus, rates of typhoid fever and typhus, although caused by different bacteria, could be conflated in vital statistics. In 1829 in Paris, France, Pierre Louis (1787–1872) demonstrated that they were distinct diseases (15), and 30 years later in Bristol, United Kingdom, his pupil William Budd (1811–1880) argued that typhoid fever was contagious (16, 17). In places like Hamburg, Germany (18) or London, United Kingdom (14), typhoid fever may have reached the peak of its historical evolution in the middle of the 19th century, fostered by urbanism, poverty, and a lack of hygiene, and then declined for many reasons, including cleaner drinking water, better nutrition, and improved sanitary conditions.
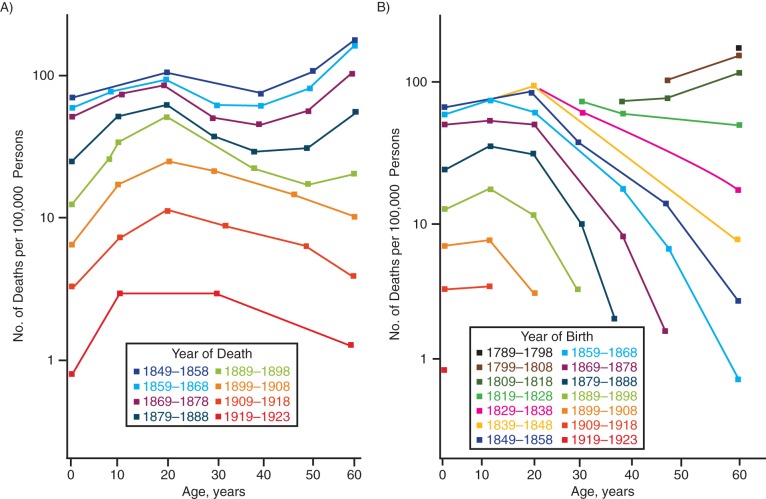
Bigelow and Doering's 1929 paper speaks directly to the historical decline of typhoid fever in Massachusetts. They had data starting from 1849, that is, approximately 10 years before it was revealed that water and food were the main modes of contamination and 40 years before the bacterium was isolated (13). Although the decline accelerated after 1910, the trends in annual age-specific mortality rates from typhoid fever were intriguing. In the 19th century, the rate of death from typhoid fever increased in older persons, but in the 20th century, this was no longer the case (Figure 4A). Considering that the tapering exposure to the bacteria across the century reflected in the curve shift, why would the elderly of earlier times be more susceptible to dying from typhoid fever than the elderly of more recent times? Using the term “cohort” and stratifying by year of birth, Bigelow and Doering showed that mortality rates did not increase with age but rather decreased in older ages, at least for cohorts born since 1818 (Figure 4B). They speculated that mortality rates in the older cohorts had begun to decline with age when typhoid fever had become so prevalent that it conferred some form of immunity to those who had survived it during earlier in their lives. The situation was different in the 1920s: Rates declined because typhoid control lowered exposure overall. There was therefore the potential threat that reduced immunity in the younger generations caused by lack of exposure could mean greater risk in the event of another major outbreak.
Figure 4.
Age-specific death rates (per 100,000 persons) from typhoid fever in Massachusetts, 1849–1923. A) Rates for 8 decades of years of death. B) Rates for 13 cohorts by decades of years of death between 1789 and 1923. Adapted from Bigelow and Doering (13).
A TALE OF HARVARD AND HOPKINS
Bigelow and Doering were 2 well-trained and prominent scientists. Bigelow trained at Harvard; Doering trained at Johns Hopkins University. Their collaboration dates from a time when both held positions in Massachusetts.
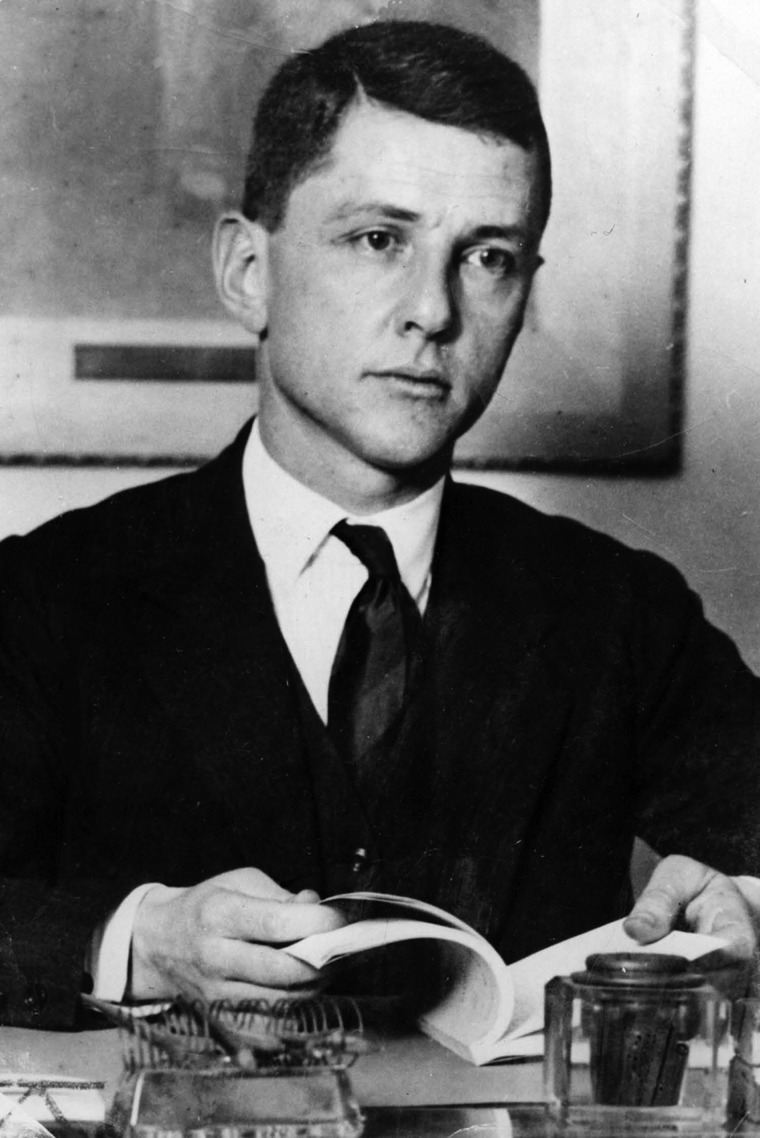
Bigelow (Figure 5), who was born in Framingham, Massachusetts, in 1890, went to Harvard University to obtain his 3 degrees: bachelor of the arts (1914), doctor of medicine, cum laude (1916), and doctor in public health (1921). He was Director of Industrial Medicine and Hygiene at Antioch College in Yellow Springs, Ohio, and of the Clinic at Cornell Medical College in New York before becoming the third Health Commissioner of the Commonwealth of Massachusetts in 1925 (19). Bigelow was a lecturer at the Harvard School of Public Health and had been directly involved in the Massachusetts Cancer Survey with Herbert L. Lombard (1889–1979) (20). In 1933, he stepped down as Health Commissioner to become the Director of the Massachusetts General Hospital, when suddenly, on Monday December 3, 1934, he disappeared (21, 22) (Appendix 1).
Figure 5.
George Hoyt Bigelow at 44 years of age. “The description of the doctor sent out by State Police states that he is six feet tall, weighs approximately 175 pounds, has deep blue eyes, a heavy shock of hair, slightly gray at the temples. He is of rangy build” (42). According to Jay R. Nash, “the photo of George H. Bigelow was taken sometime in October or November 1934; he disappeared the following December” (Jay R. Nash, personal communication, 2014). Courtesy of the Jay Robert Nash Collection.
Doering, a Philadelphian, first studied music, graduating in 1914 from the Royal Conservatory of Leipzig, Germany (Appendix 2). In 1921, he received doctor of medicine degree from Baylor Medical College in Dallas, Texas, and a certificate in public health from the Johns Hopkins School of Hygiene and Public Health in Baltimore, Maryland. In 1924, he received a doctor of science in hygiene (statistics) degree from Hopkins. Raymond Pearl (1879–1940) was the advisor for his dissertation entitled, “Some Data on the Mortality in Tuberculous Stock From Causes Other Than Tuberculosis” (23). From 1924 to 1950, Doering was with the Department of Vital Statistics (later Department of Biostatistics) at the Harvard School of Public Health, where he co-authored one of the first cancer case-control studies with Lombard (24), was an instructor of vital statistics, and eventually became an assistant professor. In 1950, Doering moved to the University of Oklahoma (Norman, Oklahoma) to be a professor of biostatistics (1950–1955) and then a professor of preventive medicine and public health (1955–1962). His picture (Figure 6) is from this later period.
Figure 6.
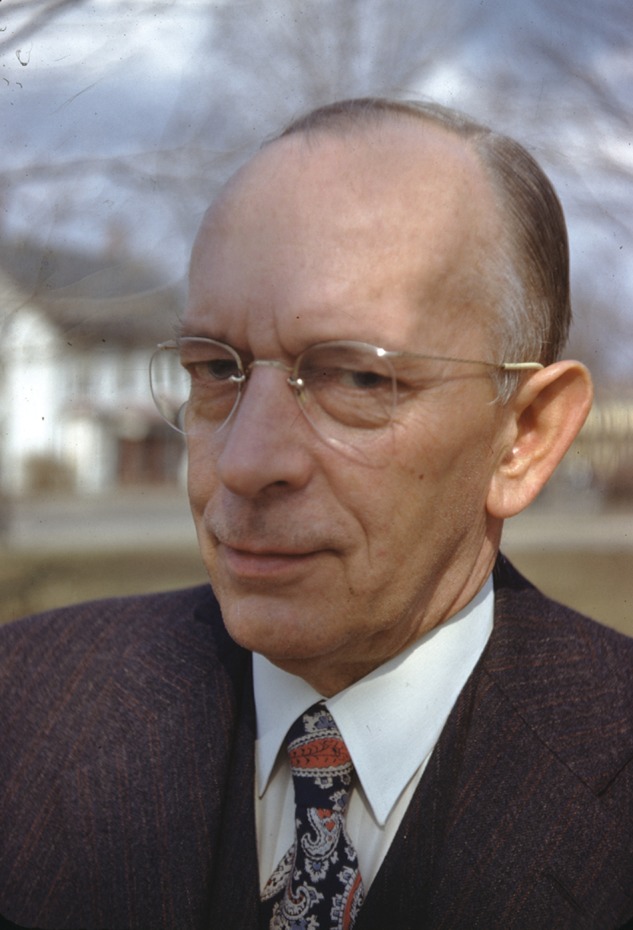
Carl R. Doering. The picture was taken between 1950 and 1956 in Katonah, New York. Courtesy of Christian and Peter Doering and Margaretta Volk.
History upset
The discovery of Bigelow and Doering's paper upsets the current knowledge about the genealogy of cohort analysis in epidemiology. Published in 1929, it ranks second among reports of birth cohort stratification, dethroning the precedence of Andvord. It ranks first for the use of the term cohort, occurring before the 1939 posthumous publication of a lecture Frost had given in 1936.
Besides Frost's citation of the Norwegian version of Andvord's 1930 article (9), there is no evidence that these scientists were familiar with each other's work. However, Bigelow and Doering's paper also challenges the theory of independent discoveries (25): A 1929 publication in the American Journal of Hygiene could hardly have escaped the notice of Frost, who was a member of the Board of Editors, was the expert in water quality for the Public Health Service, and had extensively published on typhoid fever. Moreover, the style and terminology of Bigelow and Doering's graphical representation of the typhoid fever rates are superimposable to those used by Frost for tuberculosis.
It would be tempting to consider Bigelow and Doering's paper as the missing piece that completes the epidemiologic side of the history of cohort analysis had they not used the term cohort as if it were common terminology. They did not even feel constrained to provide a reference to which the technique could be traced. This all suggests that Bigelow and Doering were familiar with a still unearthed piece (or pieces) of the puzzle. The question is with which piece(s) they were familiar. Backtracking from 1929 to the fifth edition of Milton Rosenau's textbook Preventive Medicine and Hygiene, published in 1927 (26), we see that neither the chapter on vital statistics nor Doering's chapter dedicated to statistical methods mention cohort analysis.
The Editor of the Acta—Unio Internationalis Contra Cancrum (Proceedings—International Union Against Cancer, which later became the International Journal Against Cancer) suggested in 1953 (see the note in the article by Levin (12)) that Korteweg had produced a cohort analysis in 1927. In that paper in which autopsy findings from Amsterdam, the Netherlands, Dresden, Germany, and Edinburgh, Scotland were compared, Korteweg discussed the reasons for which enteric tuberculosis at autopsy was more common in younger people, whereas tuberculous lesions in general were more common in older people. Why would the enteric lesions disappear with age for a disease that was apparently less lethal than respiratory tuberculosis? A more reasonable explanation was that rates of exposure to bovine tuberculosis had increased. Considering the calendar time corresponding to age 10 years for adults of different ages who were autopsied in 1925 (i.e., 1900 for people aged 19–30 years, 1890 for people aged 31–40 years, and so on until 1850 for people aged 66–80 years), he graphed the crossing trends of a dramatic increase over time in the rate of enteric tuberculosis among people 10 years of age and of rapidly declining death rates from pulmonary tuberculosis (27). His hypothesis was that respiratory transmission of human tuberculosis was giving way to milk transmission of—according to Korteweg, less dangerous—bovine tuberculosis. Korteweg may not claim antecedence for the analysis of cohort effects, but he might be able to for the demonstration of a period effect for a specific disease.
Here my expertise reaches its limits for 2 main reasons. The first is that some paths connect the study of specific diseases reviewed in this article to the longitudinal analysis of overall death rates by statisticians and demographers in the 1920s and 1930s (28, 29). Other paths lead beyond epidemiology. For example, statistician Ernest Charles Snow (1886–1959) used the term cohort abundantly in a 1913 paper about tuberculosis (30); in 1922, Pearl, Doering's advisor, used the term cohort to define infants born in a single year (31); and in 1924, sociologist Karl Mannheim (1893–1947) wrote an influential essay on generations (32), by which he meant cohorts (33). The second reason for circumspection is that potential troves have not yet been fully explored. It would be warranted to systematically search the American Journal of Public Health and other relevant sources before 1929, as I am doing for the American Journal of Hygiene (10, 34, 35), before jumping to the conclusion that Bigelow and Doering were the first to use the term cohort to characterize age-specific rates organized by year-of-birth. However, to the best of my knowledge, they are.
ACKNOWLEDGMENTS
Author affiliations: Barry Commoner Center for the Biology of Natural Systems, Queens College, City University of New York, New York (Alfredo Morabia); and Department of Epidemiology, Mailman School of Public Health, Columbia University, New York, New York (Alfredo Morabia).
This work was funded by grant 1G13LM010884 from the National Library of Medicine.
I thank Dr. Charles Fikar (librarian), Jessica Murphy (archivist), Dr. Karen Thomas (historian), and James Stimpert (archivist) for helping me recompose the biographies of George H. Bigelow and Carl R. Doering; Kevin Kennedy from Sudbury for checking archives for information about George H. Bigelow's death; Simone Caprifogli (designer) for helping me produce Figures 1–4; Christian and Peter Doering and Margaretta Volk, grandchildren of Carl R. Doering, for providing a curriculum vitae and a family picture of their grandfather; Professor Albert Hofman for information about the biography of Remmelt Korteweg; Professor Katherine Keyes for suggestions on how to increase the readability of the adapted graphs; Professor Marcello Pagano for bringing to my attention the work of Ernest C. Snow and Karl Mannheim; and Zoey Laskaris and Professor Michael C. Costanza for helpful comments on an earlier version of the manuscript.
Conflict of interest: none declared.
APPENDIX 1
The Mysterious Death of George H. Bigelow
George H. Bigelow left his home on the morning of Monday, December 3, 1934, entered the main gate of Massachusetts General Hospital at 8:10 am, and “at 8:20 departed, displaying obvious signs of displeasure” (36). He was scheduled to give 2 speeches in New York City, one at 8 pm the next night at the Staten Island Hospital and the second on Wednesday, December 4, at the American Society for the Control of Cancer. The police were informed that he was missing on December 6.
Several people reported having seen Bigelow by the ponds in the vicinity of the Metropolitan Reservoir in Framingham, a location near his childhood home and school, in the week after he was declared missing. An intense manhunt followed. State troopers, Framingham police, private investigators, St. Mark's schoolboys, and boy scouts all searched a 5-mile radius around the reservoir's dam that included the ponds, woods, and cottages. Shortly thereafter, a revived search led by 152 Civilian Conservation Corp members and 25 state troopers was initiated. Approximately 100,000 circulars were disseminated, and short motion picture films of Dr. Bigelow were shipped to numerous points in New England and New York. Small gum labels containing his picture and a description were plastered on the turnstiles of all trolley, subway, bus, railroad, and steamship stations. American consuls throughout Mexico, Canada, and Cuba were drawn into the search.
On December 27, more than 3 weeks later, the body of a man was found caught in a “sucker” in the canal. The body was 6 feet tall, weighed between 165 and 175 pounds, and had black hair that was graying at the temples, square shoulders, slender arms, un-calloused hands, and tapering, well-kept fingers (37). A dangerous operation to free the body ensued. Giant cranes, pneumatic drills, derricks, and slings were cautiously maneuvered to melt the 2 tons of ice in which the body was imbedded without sending ice cakes hurtling through the canal. The body was extracted from its ice coffin in front of more than 1,000 spectators who had travelled from miles around to witness the scene. The man was fingerprinted. He was not George Bigelow.
On March 24, 1935, Bigelow was found in the Sudbury reservoir in Framingham, Massachusetts, and confirmed dead. The headline of the Boston Globe said, “Dr. Bigelow Found Drawn. Death Termed Suicide by Medical Examiner. Body Taken From Reservoir at Framingham. Papers Lead to Identification. Letter to Wife Found in Coat of Victim, but Officials Silent as to Content” (38). In his pocket was a letter to his wife that read, “To Mrs. Bigelow, I can't say it, that's the trouble. I am so sorry and so ashamed of this” and was signed simply “George” (39, p. 2). The handwriting was declared to match exactly with the handwriting on Bigelow's driver's license (40). His briefcase and hat were found in good condition in the brush. The official cause of death was suicide. To this day, a question mark still tags his year of death.
APPENDIX 2
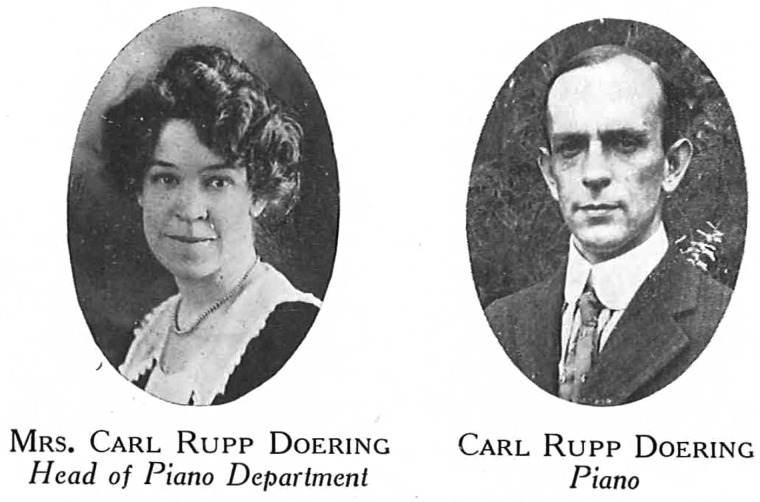
Reprinted with permission below is a section of a 1919 issue of the Texas Christian University Bulletin (T. C. U.) dedicated to the University's School of Music and Fine Arts (41).
Mrs. Carl Rupp Doering has had the finest European training. She is a Dane and was formerly the Baroness Antoinette von Egger. She was for several years the principal assistant of Professor Robert Teichmuller, the famous teacher and director of the Royal Conservatory of Music in Leipzig, Germany. She concertized with great success all over Middle Europe and enjoys a fine reputation as a teacher of advanced piano playing. Her charming sympathetic personality influences her pupils in a remarkable way. Her technique as well as musical efficiency is unexcelled. Mrs. Doering has been a member of the faculty of the T. C. U. Music Department for the past two years, and in that short time has established herself in the city of Fort Worth and the State of Texas as one of the leading concert pianists and teachers, and T. C. U. Music Department considers itself fortunate to have such an accomplished musician at the head of the piano department.
Mr. Carl Rupp Doering was born in Philadelphia and received his musical education under the celebrated pianist and pedagogue, William H. Sherwood. He entered the Sternberg School of Music in Philadelphia and studied under its director, Constantin von Sternberg. After graduating, he held a position as piano and harmony instructor for two years. He continued his studies at Leipzig under Professor Robert Teichmuller, in piano, and Professor Stephan Krehl in composition, graduating at the Conservatory in 1914. Mr. Doering returned to this country in the latter part of the year 1915 and became associated almost immediately with Texas Christian University. He, like his accomplished wife, has won an enviable position in the musical world of America. Mr. Doering will teach piano, devoting the greater part of his time to the theoretical department.
Appendix Figure 1.
Mrs. and Mr. Carl Rupp Doering. Courtesy of Christian and Peter Doering and Margaretta Volk.
REFERENCES
- 1.MacMahon B, Pugh TF, Ipsen J. Epidemiologic Methods. Boston, MA: Little, Brown and Co.; 1960. [Google Scholar]
- 2.Brownlee J. Certain considerations regarding the epidemiology of phthisis pulmonalis. Public Health. 1916;29(1):130–145. [Google Scholar]
- 3.Lancaster HO. Cohort or generation methods. A priority for John Brownlee (1868–1927) Am J Epidemiol. 1982;115(2):153–154. [Google Scholar]
- 4.Obituary: John Brownlee, MD, DSc, FRFPS, Director of the Department of Statistics, Medical Research Council. BMJ. 1927;i(3455):598. [Google Scholar]
- 5.Naess O, Schiøtz A. Commentary: Kristian Feyer Andvord's studies on the epidemiology of tuberculosis and the origin of generation cohort analysis. Int J Epidemiol. 2008;37(5):923–932. doi: 10.1093/ije/dyn107. [DOI] [PubMed] [Google Scholar]
- 6.Andvord KF. Der Verlauf der Tuberkulose durch Generationen. Beitr Klin Tuberk. 1930;75(5-6):552–563. [Google Scholar]
- 7.Andvord KF, Wijsmuller G, Blomberg B. What can we learn by following the development of tuberculosis from one generation to another? 1930. Int J Tuberc Lung Dis. 2002;6(7):562–568. [PubMed] [Google Scholar]
- 8.Andvord KF. Studier Over Tuberkulosens Forekomst I Norge. Christiania, Norway: Steen; 1895. [Google Scholar]
- 9.Frost WH. The age selection of mortality from tuberculosis in successive decades. Am J Hyg. 1939;30(3):91–96. doi: 10.1093/oxfordjournals.aje.a117343. [DOI] [PubMed] [Google Scholar]
- 10.Morabia A. Snippets from the past: the evolution of Wade Hampton Frost's epidemiology as viewed from the American Journal of Hygiene/Epidemiology. Am J Epidemiol. 2013;178(7):1013–1019. doi: 10.1093/aje/kwt199. [DOI] [PMC free article] [PubMed] [Google Scholar]
- 11.Korteweg R. The age curve in lung cancer. Br J Cancer. 1951;5(1):21–27. doi: 10.1038/bjc.1951.2. [DOI] [PMC free article] [PubMed] [Google Scholar]
- 12.Levin ML. The occurrence of lung cancer in man. Acta Unio Int Contra Cancrum. 1953;9(3):531–541. [PubMed] [Google Scholar]
- 13.Bigelow GH, Doering CR. Typhoid fever in Massachusetts. Am J Hyg. 1929;9(2):445–461. [Google Scholar]
- 14.Hardy A. The Epidemic Streets: Infectious Disease and the Rise of Preventive Medicine. 1856–1900. Oxford, UK: Clarendon Press; 1993. [Google Scholar]
- 15.Louis PCA. Recherches Anatomiques, Pathologiques et Thérapeutiques sur la Maladie Connue Sous les Noms de Gastro-Entérite, Fièvre Putride, Adynamique, Ataxique, Typhoïde, etc., Comparée Avec les Maladies Aiguës les Plus Ordinaires. 2 Volumes. Paris, France: Baillère; 1829. [Google Scholar]
- 16.Budd W. On intestinal fever: its mode of propagation. Lancet. 1856;68(1739):694–695. [Google Scholar]
- 17.Budd W. Intestinal fever essentially contagious. Lancet. 1859;2(1):4–5. 28–30, 55–56, 80–82. [Google Scholar]
- 18.Evans RJ. Death in Hamburg: Society and Politics in the Cholera Years. London, UK: Penguin Books; 2005. [Google Scholar]
- 19.McKeen Cattell J, Cattell J. American Men of Science: A Biographical Dictionary. 5th ed. New York, NY: Science Press; 1933. [Google Scholar]
- 20.Bigelow GH, Lombard HL. Experience with the program of cancer control in Massachusetts. Am J Public Health Nations Health. 1928;18(4):413–420. doi: 10.2105/ajph.18.4.413-b. [DOI] [PMC free article] [PubMed] [Google Scholar]
- 21.Obituary: George Hoyt Bigelow. N Engl J Med. 1935;212(13):589. [Google Scholar]
- 22.Editorial: Doctor George Hoyt Bigelow. N Engl J Med. 1935;212(13):582. [Google Scholar]
- 23.Doering CR. Some Data on the Mortality in Tuberculous Stock From Causes Other Than Tuberculosis. Baltimore, MD: The Johns Hopkins University; 1924. [Google Scholar]
- 24.Lombard HL, Doering CR. Cancer studies in Massachusetts. 2. Habits, characteristics and environment of individuals with and without cancer. N Engl J Med. 1928;198:481–487. doi: 10.3322/canjclin.30.2.115. [DOI] [PubMed] [Google Scholar]
- 25.Comstock GW. Cohort analysis: W.H. Frost's contributions to the epidemiology of tuberculosis and chronic disease. In: Morabia A, editor. History of Epidemiological Methods and Concepts. Basel, Switzerland: Birkhaeuser; 2004. pp. 223–231. [Google Scholar]
- 26.Rosenau MJ. Preventive Medicine and Hygiene. 5th ed. New York, NY: Appleton & Company; 1927. [Google Scholar]
- 27.Korteweg R. Ueber die Epidemiologie der Tuberkulose. Z Tuberk. 1927;49(3):176–189. [Google Scholar]
- 28.Kermack WO, Mckendrick AG, Mckinlay PL. Death-rates in Great Britain and Sweden some general regularities and their significance. Lancet. 1934;223(5770):698–703. doi: 10.1093/ije/30.4.678. [DOI] [PubMed] [Google Scholar]
- 29.Kuh D, Smith GD. When is mortality risk determined? Historical insights into a current debate. Soc Hist Med. 1993;6(1):101–123. [PubMed] [Google Scholar]
- 30.Snow EC. The mortality from phthisis: a statistical investigation having bearing upon the question of personal communicability. Proc R Soc Med. 1914;7(Sect Epidemiol State Med):21–55. [PMC free article] [PubMed] [Google Scholar]
- 31.Pearl R. The Biology of Death: Being a Series of Lectures Delivered at the Lowell Institute in Boston in December. 1920. Philadelphia, PA: Lipincott; 1922. [Google Scholar]
- 32.Mannheim K. The problem of generations [1923] In: Mannheim K, editor. Essays on the Sociology of Knowledge. London, UK: Routledge, Kegan, Paul; 1952. pp. 276–322. [Google Scholar]
- 33.Pilcher J. Mannheim's sociology of generations: an undervalued legacy. Br J Sociol. 1994;45(3):481–495. [Google Scholar]
- 34.Morabia A. Snippets from the past: is Flint, Michigan, the birthplace of the case-control study? Am J Epidemiol. 2013;178(12):1687–1690. doi: 10.1093/aje/kwt221. [DOI] [PMC free article] [PubMed] [Google Scholar]
- 35.Morabia A. The new “snippets from the past” and a new section about “epidemiology in history”. Am J Epidemiol. 2013;177(6):490–491. doi: 10.1093/aje/kwt025. [DOI] [PubMed] [Google Scholar]
- 36.Bigelow in a huff day he vanished. The Boston Globe. 1934 December 12. [Google Scholar]
- 37.Body in ice fits Bigelow details. The Boston Globe. 1934. December 28.
- 38.Dr Bigelow Found Drawn. The Boston Globe. 1935. March 24.
- 39.Reveal Bigelow planned suicide. Spartanburg Herald Journal. 1935. March 26.
- 40.Dr note hints suicide. St. Petersburg Times. 1935. March 25.
- 41.University's School of Music and Fine Arts. Texas Christian University Bulletin. Fort Worth, TX: 1919. p. 12. [Google Scholar]
- 42.Daily Boston Globe. 1934. Dr Bigelow of hospital missing. December 7. [Google Scholar]


