

Abstract
microRNAs (miRNAs) are fundamental to cellular biology. Although only approximately 22 bases long, miRNAs regulate complex processes in health and disease, including human cancer. Because miRNAs are highly stable in circulation when compared with several other classes of nucleic acids, they have generated intense interest as clinical biomarkers in diverse epidemiologic studies. As with other molecular biomarker fields, however, miRNA research has become beleaguered by pitfalls related to terminology and classification; procedural, assay, and study cohort heterogeneity; and methodological inconsistencies. Together, these issues have led to both false-positive and potentially false-negative miRNA associations. In this review, we summarize the biological rationale for studying miRNAs in human disease with a specific focus on circulating miRNAs, which highlight some of the most challenging topics in the field to date. Examples from lung cancer are used to illustrate the potential utility and some of the pitfalls in contemporary miRNA research. Although the field is in its infancy, several important lessons have been learned relating to cohort development, sample preparation, and statistical analysis that should be considered for future studies. The goal of this primer is to equip epidemiologists and clinical researchers with sound principles of study design and analysis when using miRNAs.
Keywords: blood, cancer, circulating biomarkers, lung cancer, microRNA, review
microRNAs (miRNAs) were discovered in the early 1990s during experiments interrogating the nematode model organism Caenorhabditis elegans. Lin-4 and let-7 were the first well-characterized “small” RNAs that were found to control early development (lin-4) in addition to being highly conserved across species (let-7), suggesting fundamental biological import (1, 2). This was followed in 2001 with the reporting of larger groups of small RNAs (2, 3), and the first vertebrate, mammalian (4, 5), and human studies (6) of small RNAs—now termed miRNAs—emerged shortly thereafter.
Findings in 2004 that many human miRNAs were encoded in regions of the genome associated with cancer alterations (7) led to a flurry of research in this area, facilitated by both commercially available and privately fabricated platforms to assess the human “miRnome.” Four years later, human miRNAs were found to be stable in the circulation (8, 9), leading to intense research efforts focused on blood miRNAs as noninvasive cancer biomarkers.
Over the past decade, the circulating miRNA field has burgeoned well beyond oncology, and studies focusing on nearly all aspects of clinical medicine including acute myocardial infarction (10–15), liver disease (16–19), obesity (20, 21), autoimmune disorders (22–24), critical illness (25), and even pregnancy, exist (26).
miRNA BIOLOGY
miRNAs function as repressors of gene expression by causing degradation and/or by blocking translation of specific messenger RNA target molecules with which they physically interact via partially complementary base pair interactions. From 30% to 80% of genes encoded in the human genome are believed to be regulated by just a few hundred miRNAs, with each miRNA acting on up to 100 genes and multiple miRNAs acting on 1 gene (27). miRNAs are thus thought of as master RNA regulators of gene expression, themselves subject to positive and negative feedback circuits following transcription.
miRNA biosynthesis has been well elucidated, and the reader is referred to several excellent sources on the topic (28, 29), but we briefly review the salient aspects here (Figure 1). Nuclear transcription takes place to generate a double-stranded pri-miRNA that is then processed by the Drosha-DGCR8 enzyme complex to yield a more mature pre-miRNA strand. Following transport out of the nucleus, Dicer enzyme cleavage yields an approximately 22–base pair duplex (sense and antisense) from which the single-stranded, mature miRNA strand (approximately 22 nucleotides long) is loaded into Argonaute protein(s) as part of the RNA-induced silencing complex. RNA-induced silencing complex then presents miRNA to partially complementary messenger RNA transcripts to stimulate translational blockade and/or transcript degradation.
Figure 1.

Immature, double-stranded microRNAs (miRNAs) are processed by Drosha after transcription followed by cytoplasmic processing by Dicer into separate strands. Single, mature miRNA strands are captured by the RNA-induced silencing complex (RISC) to complement messenger RNA for posttranscriptional modification. The remaining strand from the duplex is usually degraded but can be functional in some cases. In keeping with the traditions of gene nomenclature, pre-miRNAs, pri-miRNAs, and mature miRNAs from the same parent transcript have a nuanced terminology with pre/pri strands designated using a lower case r (“mir”) and the mature transcript designated using a capital “R” (“miR”).
Extracellular transport of miRNAs into the circulation is thought to be governed by Argonaute proteins, as well as extracellular vesicles (30). Exosomes, or endosome-derived membrane microvesicles, are reported to carry unique nucleic acid signatures in disease (31), and some believe that circulating miRNAs may act as remote beacons for altering cell biology, including the facilitation and/or abrogation of tumor metastasis (32, 33).
miRNA CLASSIFICATION
The miRBase registry (34–36) maintains the most up-to-date information on miRNAs for all organisms, including humans, and it is the central repository from which basic, clinical, and commercial investigators 1) expand the current encyclopedia of known miRNAs and 2) query its results to design experiments and interpret their experimental findings. Over its 10 years of existence, there have been deletions of repetitive or experimentally unproven miRNAs and revisions to an existing complex terminology that recapitulates our developing understanding of miRNA biology (Table 1) (37).
Table 1.
The miRNA Classification Schemea
| Acronym | Meaning | Examples |
|---|---|---|
| 3-Letter prefix | Species identification | hsa (Homo sapiens) |
| cel (Caenorhabditis elegans) | ||
| pri-mir (lower case “r”) | The primary miRNA transcript (see Figure 1) | pri-mir-1 |
| pre-mir (lower case “r”) | The precursor miRNA transcript resulting from processing of the primary transcript by the Drosha-DGCR8 complex (See Figure 1) | pre-mir-1 |
| miR (upper case “R”) | Mature miRNA | hsa-miR-1 |
| -3p or -5p | Mature miRNA originating from the 3′ or 5′ end of the pre-miRNA, respectively | hsa-miR-10-3p |
| hsa-miR-10-5p | ||
| a or b | Related, mature miRNA variants (i.e., differing by a nucleotide) | hsa-let 7a |
| hsa-let 7b | ||
| -1, or -2 | Identical mature miRNA sequences that originate from different genomic loci | hsa-miR-9-1 |
| hsa-miR-9-2 | ||
| miR* (miR-star) | “Passenger strand”b found at lower concentration, frequently degraded (retired after miRBase 16) | hsa-miR-9* |
| miR, miRNA, microRNA | Equivalent terms for a mature miRNA transcript used in the text of studies |
Abbreviation: miRNA, microRNA.
a Adapted from Pritchard et al. (38).
b The “*” (star) is appended to some miRNA names (e.g., miR-9*), especially in data sets generated using older miRNA profiling platforms. The designation of “*” is meant to indicate the “minor species” of the 2 mature miRNAs that are produced from the 3′ and 5′ arms of the pre-miRNA duplex (i.e., forming the miRNA:miRNA* duplex; Figure 1). It is now recognized that both the dominant (nonstar) and “star” forms can be functional (133) and, in some cases, may be present at comparable concentrations in the cell, or that the miRNA* form might even be at higher concentration depending on the precursor gene examined and the cell, tissue, or species (134) being examined. For these reasons, it is recommended that the miRNA/miRNA* nomenclature be dropped in favor of using the “-3p” or “-5p” suffix in every case.
As an example, miRNAs derived from the 2 strands of the double-stranded precursor (i.e., pre-miRNA) were once differentiated by a terminal asterisk “*,” but are currently designated as “-5p” or “-3p” status on the basis of their origin from the 5′ and 3′ ends of the pre-miRNA, respectively. Many miRNA genes have duplicated and diverged slightly to form miRNA families of very similar sequences, spawning additional annotations in the form of an appended “a” or “b” tail to the miRNA name, and sequence identical miRNAs generated from different chromosomal loci are further appended as “-1” or “-2.” Finally, in keeping with the traditions of gene nomenclature, pre-miRNAs, pri-miRNAs, and mature miRNAs from the same parent transcript have a nuanced terminology with pre/pri strands designated using a lower case r (“mir”) and the mature transcript designated using a capital “R” (“miR”). In the literature, miRNAs are usually preceded by a 3-letter organism abbreviation (i.e., hsa for Homo sapiens, cel for C. elegans, or ath for Arabidopsis thaliana). Thus, human miR-92 would be represented as hsa-miR-92.
TISSUE miRNAs
The initial miRBase registry catalogued 218 miRNAs across all species. There have been 19 iterations since, with a logarithmic growth in new annotations (Figure 2). Whereas the first miRBase registry constituted a small number of human miRNAs, the most recent edition of miRBase (accessed on November 7, 2013) contains 1,872 human precursor miRNAs whose average, unfolded, predicted length is 80 nucleotides (i.e., 40 base pairs), with a slight right-tailed distribution (i.e., longer precursor miRNAs are more common). Although mature miRNAs are typically 22 base pairs in length, a distribution exists with most miRNAs ranging in length from 18 to 25 nucleotides, although some recent deep sequencing studies have found sequences as short as 15 nucleotides to as long as 28 nucleotides for the single strand (31, 38).
Figure 2.
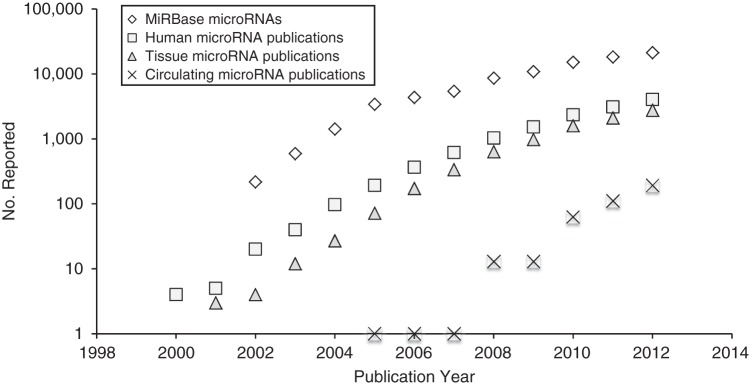
The number of precursor microRNAs (i.e., raw transcripts) for all species reported over time to miRBase, the key public repository, is displayed for all species along with microRNA publications per analyte type in humans only. Numbers are displayed on a log base 10 scale on the y-axis and with the year on the x-axis. We see here that the current logarithmic phase of discovery and publications is slowing, which is typical of biomarker fields in their infancy. Estimates of publications by microRNA publication category were extracted from GoPubMed (http://www.gopubmed.org/web/gopubmed/) using the following search terms, on January 23, 2014:For all microRNA, [Humans[MeSH] AND microRNA]; for tissue microRNA, [Humans[MeSH] AND microRNA AND (tissue OR tumor)]; and for circulating microRNA, [Humans[MeSH] AND circulating microRNA]. Numbers are reported through 2012 and are estimates only based on the search terms above.
In tissues, mature miRNAs can have a 4-fold log dynamic range of abundance from 1 to 10,000 copies per cell, with an estimated average of 500 copies per cell (38). The amount of miRNA varies considerably by cell type, with in vitro cell lines and tissues yielding approximately 100-fold more material than body fluids such as blood or urine (38, 39). This, unsurprisingly, led to an initial wave of studies that examined tissue miRNAs as biomarkers rather than fluid-based miRNAs that present a much larger “signal-to-noise” problem given their rarity.
Placental miRNAs make a particularly strong case for the idea that circulating miRNAs reflect tissue miRNA in general, because some are fairly specific to placenta and absent otherwise (40–43). There are also good data showing that other circulating, organ-specific miRNAs exist in human diseases, such as ischemic heart disease and liver cirrhosis. Some of the best evidence is for miR-122 in liver injury (44, 45) and miR-208a/b in myocardial injury (14, 46, 47).
The correlation of cancer tissue miRNAs and circulating miRNA levels is not always as strong, in part because of problems of specificity (i.e., a lack of cancer-specific miRNAs) and low tumor biomass. However, there is good evidence that tumor tissue miRNAs are released into circulation where they can be measured, with miR-660 and miR-629* being examples of this in xenografted mice (8).
NONTISSUE, CIRCULATING miRNAs
Because collection of blood samples is far more common than collection of other body fluids, the majority of noninvasive miRNA studies currently focus on circulating miRNA measurements, although studies examining miRNAs in diverse human conditions from oral secretions, cerebrospinal fluid, urine, and even breast milk are extant and emerging (48–52). Methods to determine miRNA expression in nonblood fluids are published, and we refer the reader to these for additional information (33, 49, 52–55).
The human body is composed of intracellular fluid (67%) and extracellular fluid (33%) compartments. The extracellular compartment contains the circulating blood volume (33%) of approximately 5,000 mL in an average-sized person. Clinically, we refer to components of the patient's circulating blood volume as either acellular (consisting of plasma, proteins, electrolytes and other essential nutrients (55%)) or cellular (containing the red blood cell, white blood cell, and platelet fractions (45%)). In vitro and in the laboratory, we can separate blood into the following components: the acellular fraction as serum or plasma, the buffy coat (consisting of white blood cells), and the cell fraction of platelets and red blood cells. These fractions can be easily separated from each other on the basis of density to yield the protein-rich plasma fraction, white blood cell–rich buffy coat, and platelet- and red blood cell–rich cell fraction (Web Figure 1 available at http://aje.oxfordjournals.org/). Plasma's integrity can be maintained by anticoagulants such as ethylenediaminetetraacetic acid, citrate, or heparin to prevent blood clotting. Serum, on the other hand, is a more protein-poor blood fraction that results from allowing whole blood to clot spontaneously at room temperature for 30–45 minutes, followed by removal of the clot (which contains coagulated blood proteins, as well as blood cells and platelets) by centrifugation. There are a number of commercially available blood tubes to isolate plasma or serum for clinical or research labs (56–58).
Circulating miRNAs are part of a larger group of “cell-free” nucleic acids that include circulating DNA (i.e., cell-free and circulating tumor DNA) (59) and long noncoding RNAs (defined as greater than 200 base pairs in length) (60). While in circulation, miRNAs travel in at least 2 configurations that explain their stability in blood, including ribonucleoprotein shuttles (putative major component) and membrane-bound vesicular transport (putative minor component) (61). More definitive data on the exact number of circulating miRNAs in human blood are beginning to emerge, and it is likely that only a smaller fraction of tissue miRNAs (approximately 10%–30%) are distributed and/or detectable in serum or plasma (8, 9, 62). Comprehensive next-generation sequencing (NGS) studies have reported anywhere from 100 to 500 miRNAs in the circulation of healthy controls and diseased patients (31, 43, 63–65).
By examining circulating microRNAs from the placenta (a well-perfused organ with a tissue-specific miRNA profile that receives approximately 20% of the cardiac output) and circulation of gravid women, 1 study suggests that tissue miRNAs are 8,500 times more abundant en masse than the circulating compendium of all miRNAs, and that only 2 miRNAs (miR-451 and miR-486) comprise about 60% of the circulating miRNA mass in plasma (43). These authors further suggest that if placenta kinetics translated to tumor biology, given the current state of polymerase chain reaction (PCR) technology that can detect 10 copies of miRNA per mL of plasma or serum, a tumor mass greater than 0.3 g (or diameter >1.6 mm assuming water density) is necessary to detect enough circulating miRNA. This is in line with estimates from other contemporary tumor biomarker models (66).
miRNA PREANALYTICAL ISSUES
The way blood is collected and processed for cell-free, circulating miRNA analysis is crucial and can markedly affect study results and inferences. Although phlebotomy from a patient's antecubital vein is straightforward, blood may be contaminated with epithelial cells during puncture, and plasma may be contaminated with hemolyzed red blood cells during traumatic phlebotomy. This can be avoided by discarding the first amount of blood drawn (1–2 mL) and using a large peripheral vein with a needle of adequate gauge. The current literature supports using, at minimum, a 22-gauge needle (67); however, our experience is that even large-gauge needles through large veins may result in some red blood cell hemolysis (68). Seemingly unimportant minutiae, like leaving a patient's tourniquet on during blood capture, may also increase hemolysis (69).
The effect of hemolysis on the circulating miRNA profile is dramatic and was initially underappreciated. We know now that hemolysis of red blood cells is directly linked to the release of a large number of “cellular” miRNAs found in serum or plasma, including several suggested as endogenous controls, and many of which have been touted as potential cancer biomarkers. Multiple studies have now compiled lists of miRNAs that the reader can peruse to determine whether miRNAs of interest may be affected by contamination of blood cells such as platelets or hemolysate (62, 70–73).
Centrifuge speed may alter analysis considerably (74). Inadequate speeds significantly hamper downstream analysis because of contamination from monocytes and/or platelets that have unique miRNA profiles (70–72). Many putative cancer signatures have been vulnerable to this cellular “spill-over” and may, in fact, represent cellular circulating miRNA profiles rather than cell-free, tumor-derived miRNA profiles (70–73). Currently, we recommend using at least platelet-poor plasma, which requires 2 separate spins to reduce cellular contamination by orders of magnitude (71, 74) (Appendix 1).
Plasma anticoagulants include citrate, heparin, and ethylenediaminetetraacetic acid, each of which allows for immediate processing compared with serum tubes that require a period of incubation. Whether blood should be drawn into plasma or serum tubes remains a matter of debate, and although some investigators have not found a strong reason to prefer one over the other (8), other studies have found an increased number of circulating miRNAs in serum samples compared with plasma samples, presumably because of miRNAs released during coagulation (75). In general, we and others recommend avoiding heparin, which can inhibit downstream quantitative reverse transcription (qRT)–PCR assays.
Circulating microRNA molecules are stable in circulation for up to 24 hours (8), because in a bound state they are remarkably resistant to nucleases and conditions that destroy other biomarkers in a clinical laboratory environment (9). The ability to perform large-scale, multicenter trials therefore exists for circulating miRNA work. Although most discovery studies recommend analyzing blood as quickly as possible (i.e., within 2 hours), this is not possible for multicenter efforts where the shipping of unprocessed, whole blood samples at ambient temperature may be required. Several solutions exist, including adding RNA stabilization reagents or using PAXgene RNA preservation tubes (PreAnalytiX, Hombrechtikon, Switzerland) (76). Although there is good evidence and biological rationale that miRNAs are stable over time at room temperature, contrarian evidence exists (68), and success is not guaranteed without detailed quality-control experiments to determine an optimal strategy prior to initiating enrollment with a standard operating procedure. Attention should also be paid to make sure that samples are kept in their liquid state during processing, and not frozen. This could be an issue if samples are stored on ice because this would lead to regions of localized freezing in the blood tube.
miRNA DETECTION
Tissue miRNAs of tumors have been extensively studied in human disease and cancer (77–81). Several well-established assays can be used to investigate tissue miRNA expression, and many of them have been translated to fluid analysis. These include 1) qRT-PCR arrays (e.g., those manufactured by Applied Biosystems, Inc. (Foster City, California); Exiqon A/S (Vedbaek, Denmark); Fluidigm Corp. (San Francisco, California); WaferGen Biosystems, Inc. (Fremont, California), and SABiosciences/Qiagen (Venlo, the Netherlands)); 2) commercially fabricated microarrays (e.g., those manufactured by Comprehensive Biomarker Center GmbH (Heidelberg, Germany); Affymetrix, Inc. (Santa Clara, California); GenoSensor Corp. (Tempe, Arizona); Agilent Technologies (Santa Clara, California); Exiqon A/S (Vedbaek, Denmark); Invitrogen Corp. (Carlsbad, California); NanoString Technologies (Seattle, Washington); Phalanx Biotech Group (Belmont, California); Illumina, Inc. (San Diego, California); and LC Sciences (Houston, Texas)) or academically fabricated microarrays (e.g., from the Ohio State University Comprehensive Cancer Center (Columbus, Ohio)) based on oligonucleotide chemistry; and 3) NGS (e.g., from Illumina, Inc. (San Diego, California); Applied Biosystems Inc. (Foster City, California); Invitrogen Corp. (Carlsbad, California); and Roche (Basel, Switzerland)). The reader is referred to previous reviews for details on technical aspects, strengths, and limitations of each method (38, 82).
Although microarrays are sensitive enough to detect abundant, blood cell–derived miRNAs or tissue miRNAs, they are not typically sensitive enough to detect low-abundance miRNAs, which is often required for biomarker discovery. Here, qRT-PCR, digital PCR, or NGS is preferable (38). Digital PCR, which uses limited dilutions to quantify the presence or absence of transcript in single wells compared with “analog” PCR that yields a range of expression values, has reemerged as a quantitative approach for miRNA expression given its absolute quantification with precise results (83, 84).
Regardless of array type, all are based on the miRBase registry or other databases that are continuously updated and, thus, array modification necessarily follows. Therefore, literature nomenclature can often be obsolete in short order, although as the number of discovered miRNAs tapers over time and nomenclature solidifies, this issue should become less problematic. Inevitably, this has led to a reporting bias, because miRNAs published earlier in miRBase have been studied (and thus also reported) more often.
Determining the relative importance of miRNAs given the above may seem challenging, but several points can be made. First, the miRBase repository remains the key database, and any assay used for discovery should be referenced against this. Typically, manufacturers provide these data readily to illustrate the composition of their agnostic array. Second, miRNAs with similar nomenclature have unique biological properties (i.e., -3p and -5p strands or “*” and non-“*” strands). Finally, conservation is likely to play a large role in determining whether a miRNA is an important player in a particular biological pathway, and several databases exist to explore this (85).
miRNA DATA NORMALIZATION
Data normalization is desirable for miRNA quantification, regardless of assay type. Each method of detection, be it qRT-PCR, microarray, or NGS, is subject to normalization challenges for which solutions have not yet been systematically integrated into epidemiologic and clinical studies (86). The purpose of data normalization is to correct for variation across samples that could be related to technical performance (e.g., differences in how well RNA was extracted across different samples, pipetting variation) and/or to biological factors intrinsic to the samples (e.g., variations in specimen quality).
It is common practice to “spike-in” samples with exogenous controls using nonhuman miRNAs (i.e., C. elegans or A. thaliana miRNAs) to address technical variation. The optimal approach to correct for intrinsic biological variation that is unrelated to the disease being studied, however, is more controversial. Whereas traditional qRT-PCR measurements of miRNAs in tissue have used globally expressed, so-called “housekeeping” small RNA transcripts such as small nucleolar RNAs to normalize, circulating miRNAs do not have a well-established counterpart. Thus, normalization has varied considerably across circulating miRNA studies in which amplified noise can obscure interpretation of miRNA expression. Currently, 1 of the more common approaches is to use global median normalization (i.e., the average expression of each miRNA relative to itself). This is similar to microarrays that use locally weighted regression or quantile normalization prior to analysis. NGS normalization is still plagued by the fundamental technical issue that the more common a transcript, the fewer reads there are to identify other transcripts. Exogenous spiked-in controls have been recently described as an approach for standard quality control (43).
At the current time, we suggest reporting one's methods thoroughly, regardless of type of normalization, and suggest using a spike-in strategy with synthetic miRNAs during the extraction and amplification of miRNA for qRT-PCR (i.e., cel 39) (87). It is also reasonable to supplement this with a broad normalization approach for endogenous variation, such as global median normalization. Another reasonable strategy is proffered by a well-executed lung cancer biomarker study that proposed several steps to identify endogenous circulating miRNAs by using only those candidates that were highly expressed in all samples (median qRT-PCR cycle threshold, Ct, < 30) with low variation (standard deviation, σ, < 0.9) and no differential expression (P < 0.10) between classes studied (i.e., normal vs. cancer) (88). Additionally, one can simply normalize to the plasma volume used per sample (with or without normalizing to synthetic spiked-in controls), because the use of endogenous controls in circulating miRNA studies remains controversial. Importantly, the emergence of nanofluidics PCR technologies that can quantify a large range of transcripts absolutely may obviate the need for endogenous control altogether, along with the complexity it adds to experimental interpretation (83).
miRNA STUDY DESIGN
Publication growth is currently logarithmic for both primary tissue and blood-based studies (Figure 2), but large-scale, population-based circulating miRNA discovery efforts have not been published to date. The difficulty in assembling large, multiinstitutional studies with suitably processed samples and the cost of doing miRNA research—which may range from dollars per sample for single-miRNA analysis to thousands of dollars per sample for expression or NGS analysis whether in tissue or circulation—may be responsible for this. Case-control studies are easier to execute, and the current literature is therefore composed mostly of such designs. Although useful for discovery, this study design is subject to a number of biases (89), including selection bias, confounding, and superimposed publication or other selective analysis and outcome reporting biases (90). Several opinion-based guidelines exist to help the investigator design, execute, and/or report a biomarker study in order to reduce bias and improve transparency, including the Strengthening the Reporting of Observational studies in Epidemiology statement (91) and its extension for molecular epidemiology (92), as well as the Prospective-Specimen-Collection, Retrospective-Blinded-Evaluation criteria (93).
The way in which underlying clinical phenotypes can affect the measurement of the outcome variable being studied, such as cancer, is often poorly reported but is likely to be a major issue for circulating miRNA investigations. Aging appears to confound, and potentially effect modify, the association of circulating micoRNAs with cancer diagnosis. Several reasons exist for this, including recent data that show that miRNAs in peripheral blood mononuclear cells are altered and overlap with cancer-associated miRNAs by age (94) with differences persisting in plasma (95). Additionally, it is more often the rule than the exception that cancer patients are older than normal controls in clinical studies, and miRNAs may be measuring an age effect rather than a cancer exposure as pointed out in 1 study included in our case series (96).
Smoking represents a clear and well-established effect modifier of cancer, particularly in our case study of lung cancer, and studies have established differential miRNA expression at both the tissue (97) and circulation levels (98). Although cigarette smoking is clearly established as causing cancer, not all smokers have cancer and, thus, unmatched cohorts may detect cigarette smoking–related signatures rather than cancer signatures if unbalanced. Other disease states that are often found in cancer patients, particularly those associated with end-organ damage like cirrhosis (99) and heart disease (32), have been well studied to bear unique profiles, and sex and the fasting state may also alter certain miRNA levels (9, 43, 70). Thus, one should consider either matching or adjusting for variables known to affect both miRNA expression level and risk of clinical outcome, including age, sex, smoking history, and end-stage organ dysfunction. This process should be explicitly reported in the methods section and in tables describing any potential differences between case and control groups, as well as training and validation sets.
Investigators may also want to consider the expected biological source of the cell-free miRNA signal in the study design prior to initiation. For example, if a study is aimed at identifying a circulating miRNA biomarker for cancer, and the hypothesis is that the cancer cells are shedding miRNAs into the circulation, one might want to eliminate from consideration all miRNAs expressed highly in blood cells and known to be heavily influenced by preanalytical variables (71, 72). This has the advantage of eliminating candidates that are unlikely to result in a useful diagnostic test because of limited specificity, while improving the statistical power by limiting the number of multiple comparisons.
The current literature comprises studies that are mostly underpowered to detect anything but large differences after adjustment for the typical multiplicity of comparisons involved. Although some miRNA associations may have such large effects, it is plausible that many genuine effects are smaller. Sample size/power calculations in the validation sample should also consider the possibility that the effect size estimate of an association obtained in the discovery phase from a small study may be inflated because of a “winner's curse” phenomenon (100); thus, an assumed smaller effect may be required in order to avoid false nonreplication due to lack of power during validation.
miRNA LUNG CANCER CASE STUDIES
Lung cancer is a leading cause of cancer death in US men and women (101). Early detection does not always mean cure (102), and biomarkers are therefore highly desired to help physicians refine diagnostic and prognostic acumen. Although multiple studies have examined tissue miRNAs in lung cancer tumors with some success (79, 103–105), study design and statistical challenges persist in tissue miRNA studies (106) and extend to the especially challenging, noninvasive blood miRNA space, as we shall see below.
By searching the Medline database with the query [“miRNA” AND “cancer” AND (“circulating” OR “blood”)] on November 9, 2013, we identified 19 lung cancer studies (88, 105, 107–123) from 2011 to the present that analyzed cell-free, circulating miRNAs of non–small cell lung cancer patients and cancer-free controls (Web Table 1). The median sample size of the training data set for cases and controls was 65 (interquartile range, 46–127) with a 0.58 ratio of cases to controls. Controls were heterogeneous across studies, ranging from healthy participants and age-matched smokers to those with other benign lung nodules or patients with chronic obstructive lung disease from smoking.
Four studies matched for variables known to affect miRNA profiles including age, sex, and smoking status, whereas most others accounted for this in tabulations of group characteristics to qualitatively assess for potential differences (Web Table 1). Notably, 6 studies did not report this information at all. Four studies analyzed tumors of the same histology (88, 96, 110, 116), whereas only 1 study analyzed tumors of the same stage (110). Both of these variables may be large contributors to miRNA diversity on the basis of what we know from previous genetic and genomic studies in lung cancer (124–127). None of the studies explicitly mentioned using biomarker guidelines.
Nine studies used serum for miRNA analysis, 8 used plasma, 1 used both serum and plasma, and 1 used whole blood (Web Table 1). Blood processing reporting was variable; many did not give full details of phlebotomy and centrifugation, only 4 reported “double-spun” samples to yield platelet-poor plasma, and 6 offered no information on these metrics. The 3 main platforms we described above were used, with qRT-PCR being the preferred method in the majority of cases (12 studies). Normalization for PCR to control for extraction and/or assay variation by using spiked-in or endogenous miRNAs for the 12 qRT-PCR studies was not consistent, but small nucleolar RNAs or miR-16 were the most commonly used endogenous controls (n = 4) (Web Table 1).
The average number of miRNAs analyzed for these studies was bimodal, depending on whether the study adopted a candidate-driven design (n = 10 studies) (107, 108, 111, 113, 115, 118, 119, 121–123) or preferred an agnostic approach (n = 9 studies) (88, 96, 109, 110, 112, 114, 116, 117, 120). Discovery-based studies analyzed from 328 to 1,282 miRNAs, whereas candidate-driven designs analyzed from 1 to 91 miRNAs. Two studies specifically assessed tumor case and control miRNAs in addition to circulating miRNAs (109, 123). Candidate-driven studies usually reported having used previous literature in lung cancer to select miRNAs for study. None of the agnostic, discovery-based-approach studies tried to confirm in tumor samples the importance of miRNAs that survived through to validation.
Twelve studies proceeded with a separate validation step, 11 of which performed split-sample analysis and 1 of which performed cross-validation (Web Table 2). Notably, 2 of 11 studies carried forward to validation, even though nothing formally significant had been found in the training phase (112, 120). The analysis of miRNAs that were validated alone or in composite data set analyses (n = 9) revealed few similarities in selected signatures across studies, although miR-21 was validated in 3 studies.
Some form of a Student's t test and its nonparametric equivalent (n = 12) or logistic regression (n = 6) was the most common method used for signature development (Web Table 2). Logistic regression studies often did not report differential P value or fold expression values for the miRNAs selected in the model. Seven of 14 studies requiring some sort of adjustment reported P values corrected for multiple comparisons (Web Table 2). Because a 400-miRNA assay would detect 20 miRNAs by chance at P < 0.05, the importance of multiple-comparison adjustment here cannot be overemphasized. Of note, only 2 of the lung cancer studies included in this analysis reported power calculations (119, 123), each of which aimed to identify a miRNA signature with a 0.75 predictive accuracy.
CONCLUSIONS AND FUTURE DIRECTIONS
On the basis of the above, we conclude with some suggestions on the design and analysis of circulating miRNA studies. First, accounting for multiple comparisons with validation should be the norm for all studies. There are easily implemented tools for multiple comparisons that include calculating the well-described false discovery rate (q value) with statistical packages like Significance Analysis of Microarrays (128) or Biometric Research Branch ArrayTools (129), both of which have Excel software (Microsoft Corp., Seattle, Washington) interfaces. Moreover, investigators and editors alike should resist the temptation to promote results of studies without including formal rigorous validation, because nonvalidated information may create an accumulating body of fuzzy data that will hinder future progress.
Assembling large miRNA data sets for a better and less biased understanding of their clinical import using the most current and relevant assays requires systematic efforts and collaboration among multiple investigators. This is paramount for circulating miRNAs, where signal-to-noise and preanalytical variation are far more difficult challenges than in tissue, which itself remains an imperfect medium in which to study biomarkers.
The National Institutes of Health (Bethesda, Maryland) are currently funding several umbrella programs aimed at understanding cell-free miRNAs in circulation in man and their potential role as signals for cell-to-cell communication (Appendix 2). An encyclopedia of circulating miRNAs present in the normal, healthy state and subgrouped by clinical phenotypes like age, sex, and ethnicity is required to assess the baseline distribution of human blood miRNAs and is currently under development. Building on previous work, a more comprehensive encyclopedia of miRNAs by cell type (e.g., red blood cell, platelet, monocyte), disease states like cancer (e.g., of the lung, liver, colon), and cancer subtypes (e.g., histology, stage) is required (130).
Private corporations have also accumulated large amounts of data from their services to industry and academia. As an example, Exiqon A/S (Vedbaek, Denmark) recently examined 381 nonhemolyzed serum and plasma samples to establish the 119 most commonly abundant miRNAs in circulation, albeit without telling the readership from what disease states the samples were derived (62).
The effect of how we collect and process blood specimens to detect miRNAs and other rare circulating biomarkers is more apparent with time. Although there has been some progress since initial calls to assess this topic in published data (87), much work remains in larger and collaborative groups. Specifically, the effect of patient white blood cell count, needle gauge, tourniquet use, site of venipuncture, time of venipuncture, fasting state, patient weight, patient ethnicity, centrifuge processing time, and centrifuge force are all fundamental variables that may affect miRNAs in circulation with unintended consequences as discussed above.
In the course of this review, we have learned that although some circulating miRNAs are tissue specific, they are rare and not cancer specific, and only a few may dominate the circulating “mirNome.” Therefore, the first miRNA clinical applications are likely to be for markers of end-organ damage rather than as cancer biomarkers. For cancer researchers, focusing on epithelial-restricted miRNAs such as the miR-200 family may be helpful for added specificity during the study of carcinoma, as well as the use of a candidate-driven strategy rather than agnostic approaches that are more susceptible to statistical bias.
One challenge of clinical epidemiology is finding meaning in a “new age” of personalized medicine (131). Proper attention to standard epidemiologic principles is essential for the success of any novel biomarker field. Extrapolation from case-control studies with inappropriate controls has been a common problem in molecular diagnostics (132), and clinical cohorts must be assessed in the appropriate clinical context and analyzed with this in mind.
As an example, if the aim is to develop a diagnostic tool for the early detection of lung cancer, a lung cancer patient should not be controlled against a normal healthy individual, but rather against a patient with a competing diagnosis such as an infection or benign tumor. Furthermore, investigators should examine miRNA profiles (if they survive to validation in an appropriately designed and executed study) in the context of current clinical diagnostic models of risk. How would a properly identified miRNA profile help a pulmonary physician ascertain whether a lung nodule is malignant along with other demographic, clinical, and imaging data? Answering this type of question is the next, most crucial, stage in addressing whether we can adequately translate circulating miRNA biomarkers to clinical applications.
Supplementary Material
ACKNOWLEDGMENTS
Author affiliations: Department of Medicine, Stanford University School of Medicine, Stanford, California (Viswam S. Nair); Department of Laboratory Medicine, University of Washington, Seattle, Washington (Colin C. Pritchard); Department of Internal Medicine, Hematology/Oncology Division, University of Michigan School of Medicine, Ann Arbor, Michigan (Muneesh Tewari); Department of Medicine, Stanford Prevention Research Center, Stanford University School of Medicine, Stanford, California (John P.A. Ioannidis); Department of Health Research and Policy, Stanford University School of Medicine, Stanford, California (John P. A. Ioannidis); Department of Statistics, Stanford University School of Humanities and Sciences, Stanford, California (John P. A. Ioannidis); and Meta-Research Innovation Center at Stanford (METRICS), Stanford, California (John P. A. Ioannidis).
This work was supported by a LUNGevity Career Development Award (to V.S.N.); the National Institutes of Health (grants R01DK085714 and U01 CA157703, which are part of the National Cancer Institute's Strategic Partnerships to Evaluate Cancer Signatures II program, to M.T.); the US Department of Defense Peer-Reviewed Cancer Research Program Award CA100606 to M.T.); and the Canary Foundation. METRICS is funded by a grant from the Laura and John Arnold Foundation.
Conflict of interest: none declared.
APPENDIX 1
Planning a Circulating microRNA Study
Assess a large enough sample on the basis of analysis from previous relevant/similar literature.
Use a training cohort and validate in a test cohort for discovery studies.
- Control for confounders: age, sex, smoking, comorbidities.
- Match (individual- or group-level) during study design.
- Ensure that training and test cohorts have similar disease characteristics (e.g., similar tumor sizes, tumor histology, and stage for cancer comparisons).
- Use a consistent collection protocol (e.g., standard operating procedures).
- Use the same phlebotomy tube type and manufacturer throughout study.
- Use a larger needle gauge for phlebotomy (≤22-gauge).
- For discovery studies, process blood as quickly as possible (in ≤2 hours).
- For larger, collaborative studies, test the feasibility of 24-hour processing protocols.
Use “double-spun,” platelet-poor plasma/serum prior to assaying to minimize cellular miRNA contamination. Consider removing hemolyzed samples before assaying. (This can be done visually or by using absorption measurements.) (135)
- Use a consistent platform for assay regardless of method (e.g., polymerase chain reaction, next-generation sequencing).
- Consider performing analytical replicates (i.e., duplicate wells), in addition to biological replicates (i.e., different samples).
- Design replicates to capture sources of analytical variation such as batch effects.
- For quantitative reverse transcriptase–polymerase chain reaction normalization:
- Consider using synthetic spike-ins (cel-miR-39, cel-miR-54, and cel-miR-238 are suitable) for exogenous control (85).
- Consider global median normalization or the method of Bianchi et al. (88) for endogenous control.
- Consider normalizing to plasma or serum volume analyzed, with or without the use of synthetic spike-in controls to correct for variations in RNA extraction efficiency.
Examine the effect of preanalytical variables on microRNA (miRNA) profiles, just as one would with the disease predictor of interest (e.g., How do miRNAs vary by center, processing time, hemolysis?). Consider removing hemolysis- and blood cell–related miRNAs if appropriate. Consult sources (70–73) for lists of miRNAs that are associated with cells or hemolysate.
During signature development (training phase) use appropriate false-discovery rates (e.g., q < 0.05) or appropriate correction for multiple comparisons by considering family-wise error rates or Bonferonni correction (i.e., for a 500-miRNA assay, the raw P value would be <0.0001 to claim statistical significance at an adjusted P < 0.05).
During external validation, only miRNAs passing false-discovery-rate or statistical significance screening threshold in training should be validated. If none is significant, then validation is meaningless.
If external validation holds up, how do other clinical variables add to or detract from a risk signature that includes only miRNA markers? (E.g., Do age, smoking, and tumor size add or detract from the value of the miRNA signature developed in lung cancer?)
APPENDIX 2
Suggested Resources
National Institutes of Health (Bethesda, Maryland) funding opportunities
miRBase (the key repository of microRNAs for all species)
microRNAviewer (a browser to visually analyze microRNA conservation)
Tewari Laboratory (circulating microRNA basic discovery and translation)
Pritchard Laboratory (circulating microRNA methodology and translation)
Prospective-Specimen-Collection, Retrospective-Blinded-Evaluation (PROBE) biomarker guidelines in clinical research
Strengthening the Reporting of Observational Studies in Epidemiology (STROBE) guidelines for observational studies
Minimum Information for Publication of Quantitative Real-Time Polymerase Chain Reaction Experiments (MIQE) guidelines
Mimimum Information About a Microarray Experiment (MIAME) guidelines for reporting microarray data
Miminal Information About a High-Throughput Sequencing Experiment (MINISEQE) guidelines for reporting sequence data
Significance Analysis of Microarrays (for analyzing high-dimensional data)
Biometric Research Branch ArrayTools (for analyzing high-dimensional data)
REFERENCES
- 1.Wightman B, Ha I, Ruvkun G. Posttranscriptional regulation of the heterochronic gene lin-14 by lin-4 mediates temporal pattern formation in C. elegans. Cell. 1993;75(5):855–862. [Google Scholar]
- 2.Reinhart BJ, Slack FJ, Basson M, et al. The 21-nucleotide let-7 RNA regulates developmental timing in Caenorhabditis elegans. Nature. 2000;403(6772):901–906. [Google Scholar]
- 3.Lee RC, Ambros V. An extensive class of small RNAs in Caenorhabditis elegans. Science. 2001;294(5543):862–864. [Google Scholar]
- 4.Lim LP, Glasner ME, Yekta S, et al. Vertebrate microRNA genes. Science. 2003;299(5612):1540. [Google Scholar]
- 5.Sempere LF, Freemantle S, Pitha-Rowe I, et al. Expression profiling of mammalian microRNAs uncovers a subset of brain-expressed microRNAs with possible roles in murine and human neuronal differentiation. Genome Biol. 2004;5(3):R13. [Google Scholar]
- 6.Calin GA, Dumitru CD, Shimizu M, et al. Frequent deletions and down-regulation of micro-RNA genes miR15 and miR16 at 13q14 in chronic lymphocytic leukemia. Proc Natl Acad Sci U S A. 2002;99(24):15524–15529. [Google Scholar]
- 7.Calin GA, Sevignani C, Dumitru CD, et al. Human microRNA genes are frequently located at fragile sites and genomic regions involved in cancers. Proc Natl Acad Sci U S A. 2004;101(9):2999–3004. [Google Scholar]
- 8.Mitchell PS, Parkin RK, Kroh EM, et al. Circulating microRNAs as stable blood-based markers for cancer detection. Proc Natl Acad Sci U S A. 2008;105(30):10513–10518. [Google Scholar]
- 9.Chen X, Ba Y, Ma L, et al. Characterization of microRNAs in serum: a novel class of biomarkers for diagnosis of cancer and other diseases. Cell Res. 2008;18(10):997–1006. [Google Scholar]
- 10.Gidlöf O, Andersson P, van der Pals J, et al. Cardiospecific microRNA plasma levels correlate with troponin and cardiac function in patients with ST elevation myocardial infarction, are selectively dependent on renal elimination, and can be detected in urine samples. Cardiology. 2011;118(4):217–226. [Google Scholar]
- 11.Gidlöf O, Smith JG, Miyazu K, et al. Circulating cardio-enriched microRNAs are associated with long-term prognosis following myocardial infarction. BMC Cardiovasc Disord. 2013;13:12. [Google Scholar]
- 12.Ai J, Zhang R, Li Y, et al. Circulating microRNA-1 as a potential novel biomarker for acute myocardial infarction. Biochem Biophys Res Commun. 2010;391(1):73–77. [Google Scholar]
- 13.Corsten MF, Dennert R, Jochems S, et al. Circulating MicroRNA-208b and MicroRNA-499 reflect myocardial damage in cardiovascular disease. Circ Cardiovasc Genet. 2010;3(6):499–506. [Google Scholar]
- 14.Wang GK, Zhu JQ, Zhang JT, et al. Circulating microRNA: a novel potential biomarker for early diagnosis of acute myocardial infarction in humans. Eur Heart J. 2010;31(6):659–666. [Google Scholar]
- 15.Stammet P, Goretti E, Vausort M, et al. Circulating microRNAs after cardiac arrest. Crit Care Med. 2012;40(12):3209–3214. [Google Scholar]
- 16.Bala S, Petrasek J, Mundkur S, et al. Circulating microRNAs in exosomes indicate hepatocyte injury and inflammation in alcoholic, drug-induced, and inflammatory liver diseases. Hepatology. 2012;56(5):1946–1957. [Google Scholar]
- 17.Cermelli S, Ruggieri A, Marrero JA, et al. Circulating microRNAs in patients with chronic hepatitis C and non-alcoholic fatty liver disease. PLoS One. 2011;6(8):e23937. [Google Scholar]
- 18.Zhang Y, Jia Y, Zheng R, et al. Plasma microRNA-122 as a biomarker for viral-, alcohol-, and chemical-related hepatic diseases. Clin Chem. 2010;56(12):1830–1838. [Google Scholar]
- 19.Gui J, Tian Y, Wen X, et al. Serum microRNA characterization identifies miR-885-5p as a potential marker for detecting liver pathologies. Clin Sci (Lond) 2011;120(5):183–193. [Google Scholar]
- 20.Wang YT, Tsai PC, Liao YC, et al. Circulating microRNAs have a sex-specific association with metabolic syndrome. J Biomed Sci. 2013;20(1):72. [Google Scholar]
- 21.Karolina DS, Tavintharan S, Armugam A, et al. Circulating miRNA profiles in patients with metabolic syndrome. J Clin Endocrinol Metab. 2012;97(12):E2271–E2276. [Google Scholar]
- 22.Carlsen AL, Schetter AJ, Nielsen CT, et al. Circulating microRNA expression profiles associated with systemic lupus erythematosus. Arthritis Rheum. 2013;65(5):1324–1334. [Google Scholar]
- 23.Gandhi R, Healy B, Gholipour T, et al. Circulating microRNAs as biomarkers for disease staging in multiple sclerosis. Ann Neurol. 2013;73(6):729–740. [Google Scholar]
- 24.Makino K, Jinnin M, Kajihara I, et al. Circulating miR-142-3p levels in patients with systemic sclerosis. Clin Exp Dermatol. 2012;37(1):34–39. [Google Scholar]
- 25.Roderburg C, Luedde M, Vargas Cardenas D, et al. Circulating microRNA-150 serum levels predict survival in patients with critical illness and sepsis. PLoS One. 2013;8(1):e54612. [Google Scholar]
- 26.Zhao Z, Zhao Q, Warrick J, et al. Circulating microRNA miR-323-3p as a biomarker of ectopic pregnancy. Clin Chem. 2012;58(5):896–905. [Google Scholar]
- 27.Lu J, Clark AG. Impact of microRNA regulation on variation in human gene expression. Genome Res. 2012;22(7):1243–1254. [Google Scholar]
- 28.Ambros V. The functions of animal microRNAs. Nature. 2004;431(7006):350–355. [Google Scholar]
- 29.Merritt WM, Lin YG, Han LY, et al. Dicer, Drosha, and outcomes in patients with ovarian cancer. N Engl J Med. 2008;359(25):2641–2650. [Google Scholar]
- 30.Xu L, Yang BF, Ai J. MicroRNA transport: a new way in cell communication. J Cell Physiol. 2013;228(8):1713–1719. [Google Scholar]
- 31.Huang X, Yuan T, Tschannen M, et al. Characterization of human plasma-derived exosomal RNAs by deep sequencing. BMC Genomics. 2013;14:319. [Google Scholar]
- 32.Creemers EE, Tijsen AJ, Pinto YM. Circulating microRNAs: Novel biomarkers and extracellular communicators in cardiovascular disease? Circ Res. 2012;110(3):483–495. [Google Scholar]
- 33.Cortez MA, Bueso-Ramos C, Ferdin J, et al. MicroRNAs in body fluids–the mix of hormones and biomarkers. Nat Rev Clin Oncol. 2011;8(8):467–477. [Google Scholar]
- 34.Griffiths-Jones S. The microRNA Registry. Nucleic Acids Res. 2004;32(Database issue):D109–D111. [Google Scholar]
- 35.Griffiths-Jones S. MiRBase: microRNA sequences and annotation. Curr Protoc Bioinformatics. 2010;12:12.9.1–12.9.9. [Google Scholar]
- 36.Kozomara A, Griffiths-Jones S. MiRBase: integrating microRNA annotation and deep-sequencing data. Nucleic Acids Res. 2011;39(Database issue):D152–D157. [Google Scholar]
- 37.Ambros V, Bartel B, Bartel DP, et al. A uniform system for microRNA annotation. RNA. 2003;9(3):277–279. [Google Scholar]
- 38.Pritchard CC, Cheng HH, Tewari M. MicroRNA profiling: approaches and considerations. Nat Rev Genet. 2012;13(5):358–369. [Google Scholar]
- 39.De Cecco L, Dugo M, Canevari S, et al. Measuring microRNA expression levels in oncology: from samples to data analysis. Crit Rev Oncog. 2013;18(4):273–287. [Google Scholar]
- 40.Chim SS, Shing TK, Hung EC, et al. Detection and characterization of placental microRNAs in maternal plasma. Clin Chem. 2008;54(3):482–490. [Google Scholar]
- 41.Miura K, Miura S, Yamasaki K, et al. Identification of pregnancy-associated microRNAs in maternal plasma. Clin Chem. 2010;56(11):1767–1771. [Google Scholar]
- 42.Whitehead CL, Teh WT, Walker SP, et al. Circulating MicroRNAs in maternal blood as potential biomarkers for fetal hypoxia in-utero. PLoS One. 2013;8(11):e78487. [Google Scholar]
- 43.Williams Z, Ben-Dov IZ, Elias R, et al. Comprehensive profiling of circulating microRNA via small RNA sequencing of cDNA libraries reveals biomarker potential and limitations. Proc Natl Acad Sci U S A. 2013;110(11):4255–4260. [Google Scholar]
- 44.Farid WR, Pan Q, van der Meer AJ, et al. Hepatocyte-derived microRNAs as serum biomarkers of hepatic injury and rejection after liver transplantation. Liver Transpl. 2012;18(3):290–297. [Google Scholar]
- 45.Laterza OF, Scott MG, Garrett-Engele PW, et al. Circulating miR-122 as a potential biomarker of liver disease. Biomark Med. 2013;7(2):205–210. [Google Scholar]
- 46.Wang E, Nie Y, Zhao Q, et al. Circulating miRNAs reflect early myocardial injury and recovery after heart transplantation. J Cardiothorac Surg. 2013;8:165. [Google Scholar]
- 47.Liebetrau C, Möllmann H, Dörr O, et al. Release kinetics of circulating muscle-enriched microRNAs in patients undergoing transcoronary ablation of septal hypertrophy. J Am Coll Cardiol. 2013;62(11):992–998. [Google Scholar]
- 48.Park NJ, Zhou H, Elashoff D, et al. Salivary microRNA: discovery, characterization, and clinical utility for oral cancer detection. Clin Cancer Res. 2009;15(17):5473–5477. [Google Scholar]
- 49.Weber JA, Baxter DH, Zhang S, et al. The microRNA spectrum in 12 body fluids. Clin Chem. 2010;56(11):1733–1741. [Google Scholar]
- 50.Van Pottelberge GR, Mestdagh P, Bracke KR, et al. MicroRNA expression in induced sputum of smokers and patients with chronic obstructive pulmonary disease. Am J Respir Crit Care Med. 2011;183(7):898–906. [Google Scholar]
- 51.Munch EM, Harris RA, Mohammad M, et al. Transcriptome profiling of microRNA by Next-Gen deep sequencing reveals known and novel miRNA species in the lipid fraction of human breast milk. PLoS One. 2013;8(2):e50564. [Google Scholar]
- 52.Machida A, Ohkubo T, Yokota T. Circulating microRNAs in the cerebrospinal fluid of patients with brain diseases. Methods Mol Biol. 2013;1024:203–209. [Google Scholar]
- 53.Gallo A, Alevizos I. Isolation of circulating microRNA in saliva. Methods Mol Biol. 2013;1024:183–190. [Google Scholar]
- 54.Kuner R, Brase JC, Sültmann H, et al. MicroRNA biomarkers in body fluids of prostate cancer patients. Methods. 2013;59(1):132–137. [Google Scholar]
- 55.Wang G, Szeto CC. Methods of microRNA quantification in urinary sediment. Methods Mol Biol. 2013;1024:211–220. [Google Scholar]
- 56.Banfi G, Salvagno GL, Lippi G. The role of ethylenediamine tetraacetic acid (EDTA) as in vitro anticoagulant for diagnostic purposes. Clin Chem Lab Med. 2007;45(5):565–576. [Google Scholar]
- 57.Lima-Oliveira G, Lippi G, Salvagno GL, et al. K(3)EDTA vacuum tubes validation for routine hematological testing. ISRN Hematol. 2012;2012:875357. [Google Scholar]
- 58.Lima-Oliveira G, Lippi G, Salvagno GL, et al. Brand of dipotassium EDTA vacuum tube as a new source of pre-analytical variability in routine haematology testing. Br J Biomed Sci. 2013;70(1):6–9. [Google Scholar]
- 59.Dawson SJ, Tsui DW, Murtaza M, et al. Analysis of circulating tumor DNA to monitor metastatic breast cancer. N Engl J Med. 2013;368(13):1199–1209. [Google Scholar]
- 60.Batista PJ, Chang HY. Long noncoding RNAs: cellular address codes in development and disease. Cell. 2013;152(6):1298–1307. [Google Scholar]
- 61.Arroyo JD, Chevillet JR, Kroh EM, et al. Argonaute2 complexes carry a population of circulating microRNAs independent of vesicles in human plasma. Proc Natl Acad Sci U S A. 2011;108(12):5003–5008. [Google Scholar]
- 62.Blondal T, Jensby Nielsen S, Baker A, et al. Assessing sample and miRNA profile quality in serum and plasma or other biofluids. Methods. 2013;59(1):S1–S6. [Google Scholar]
- 63.Hu Z, Chen X, Zhao Y, et al. Serum microRNA signatures identified in a genome-wide serum microRNA expression profiling predict survival of non-small-cell lung cancer. J Clin Oncol. 2010;28(10):1721–1726. [Google Scholar]
- 64.Keller A, Backes C, Leidinger P, et al. Next-generation sequencing identifies novel microRNAs in peripheral blood of lung cancer patients. Mol Biosyst. 2011;7(12):3187–3199. [Google Scholar]
- 65.Wu X, Somlo G, Yu Y, et al. De novo sequencing of circulating miRNAs identifies novel markers predicting clinical outcome of locally advanced breast cancer. J Transl Med. 2012;10:42. [Google Scholar]
- 66.Hori SS, Gambhir SS. Mathematical model identifies blood biomarker-based early cancer detection strategies and limitations. Sci Transl Med. 2011;3(109):109ra116. [Google Scholar]
- 67.Lippi G, Salvagno GL, Brocco G, et al. Preanalytical variability in laboratory testing: influence of the blood drawing technique. Clin Chem Lab Med. 2005;43(3):319–325. [Google Scholar]
- 68.Page K, Guttery DS, Zahra N, et al. Influence of plasma processing on recovery and analysis of circulating nucleic acids. PLoS One. 2013;8(10):e77963. [Google Scholar]
- 69.Connes P, Uyuklu M, Tripette J, et al. Sampling time after tourniquet removal affects erythrocyte deformability and aggregation measurements. Clin Hemorheol Microcirc. 2009;41(1):9–15. [Google Scholar]
- 70.Duttagupta R, Jiang R, Gollub J, et al. Impact of cellular miRNAs on circulating miRNA biomarker signatures. PLoS One. 2011;6(6):e20769. [Google Scholar]
- 71.Cheng HH, Yi HS, Kim Y, et al. Plasma processing conditions substantially influence circulating microRNA biomarker levels. PLoS One. 2013;8(6):e64795. [Google Scholar]
- 72.Pritchard CC, Kroh E, Wood B, et al. Blood cell origin of circulating microRNAs: a cautionary note for cancer biomarker studies. Cancer Prev Res (Phila) 2012;5(3):492–497. [Google Scholar]
- 73.Kirschner MB, Edelman JJ, Kao SC, et al. The impact of hemolysis on cell-free microRNA biomarkers. Front Genet. 2013;4:94. [Google Scholar]
- 74.Lippi G, Salvagno GL, Montagnana M, et al. Influence of the centrifuge time of primary plasma tubes on routine coagulation testing. Blood Coagul Fibrinolysis. 2007;18(5):525–528. [Google Scholar]
- 75.Wang K, Yuan Y, Cho JH, et al. Comparing the MicroRNA spectrum between serum and plasma. PLoS One. 2012;7(7):e41561. [Google Scholar]
- 76.Weber DG, Casjens S, Rozynek P, et al. Assessment of mRNA and microRNA stabilization in peripheral human blood for multicenter studies and biobanks. Biomark Insights. 2010;5:95–102. [Google Scholar]
- 77.Iorio MV, Ferracin M, Liu CG, et al. MicroRNA gene expression deregulation in human breast cancer. Cancer Res. 2005;65(16):7065–7070. [Google Scholar]
- 78.Volinia S, Calin GA, Liu CG, et al. A microRNA expression signature of human solid tumors defines cancer gene targets. Proc Natl Acad Sci U S A. 2006;103(7):2257–2261. [Google Scholar]
- 79.Yanaihara N, Caplen N, Bowman E, et al. Unique microRNA molecular profiles in lung cancer diagnosis and prognosis. Cancer Cell. 2006;9(3):189–198. [Google Scholar]
- 80.Ozen M, Creighton CJ, Ozdemir M, et al. Widespread deregulation of microRNA expression in human prostate cancer. Oncogene. 2008;27(12):1788–1793. [Google Scholar]
- 81.Cummins JM, He Y, Leary RJ, et al. The colorectal microRNAome. Proc Natl Acad Sci U S A. 2006;103(10):3687–3692. [Google Scholar]
- 82.Zampetaki A, Mayr M. Analytical challenges and technical limitations in assessing circulating miRNAs. Thromb Haemost. 2012;108(4):592–598. [Google Scholar]
- 83.Hindson CM, Chevillet JR, Briggs HA, et al. Absolute quantification by droplet digital PCR versus analog real-time PCR. Nat Methods. 2013;10(10):1003–1005. [Google Scholar]
- 84.Vogelstein B, Kinzler KW. Digital PCR. Proc Natl Acad Sci U S A. 1999;96(16):9236–9241. [Google Scholar]
- 85.Kiezun A, Artzi S, Modai S, et al. MiRviewer: a multispecies microRNA homologous viewer. BMC Res Notes. 2012;5:92. [Google Scholar]
- 86.Meyer SU, Pfaffl MW, Ulbrich SE. Normalization strategies for microRNA profiling experiments: A ‘normal’ way to a hidden layer of complexity? Biotechnol Lett. 2010;32(12):1777–1788. [Google Scholar]
- 87.Kroh EM, Parkin RK, Mitchell PS, et al. Analysis of circulating microRNA biomarkers in plasma and serum using quantitative reverse transcription-PCR (qRT-PCR) Methods. 2010;50(4):298–301. [Google Scholar]
- 88.Bianchi F, Nicassio F, Marzi M, et al. A serum circulating miRNA diagnostic test to identify asymptomatic high-risk individuals with early stage lung cancer. EMBO Mol Med. 2011;3(8):495–503. [Google Scholar]
- 89.Ioannidis JP. Why most published research findings are false. PLoS Med. 2005;2(8):e124. [Google Scholar]
- 90.Chavalarias D, Ioannidis JP. Science mapping analysis characterizes 235 biases in biomedical research. J Clin Epidemiol. 2010;63(11):1205–1215. [Google Scholar]
- 91.von Elm E, Altman DG, Egger M, et al. The Strengthening the Reporting of Observational Studies in Epidemiology (STROBE) statement: guidelines for reporting observational studies. Lancet. 2007;370(9596):1453–1457. [Google Scholar]
- 92.Gallo V, Egger M, McCormack V, et al. STrengthening the Reporting of OBservational studies in Epidemiology—Molecular Epidemiology (STROBE-ME): an extension of the STROBE Statement. PLoS Med. 2011;8(10):e1001117. [Google Scholar]
- 93.Pepe MS, Feng Z, Janes H, et al. Pivotal evaluation of the accuracy of a biomarker used for classification or prediction: standards for study design. J Natl Cancer Inst. 2008;100(20):1432–1438. [Google Scholar]
- 94.Noren Hooten N, Abdelmohsen K, Gorospe M, et al. MicroRNA expression patterns reveal differential expression of target genes with age. PLoS One. 2010;5(5):e10724. [Google Scholar]
- 95.Noren Hooten N, Fitzpatrick M, Wood WH., 3rd, et al. Age-related changes in microRNA levels in serum. Aging (Albany NY) 2013;5(10):725–740. [Google Scholar]
- 96.Patnaik SK, Yendamuri S, Kannisto E, et al. MicroRNA expression profiles of whole blood in lung adenocarcinoma. PLoS One. 2012;7(9):e46045. [Google Scholar]
- 97.Schembri F, Sridhar S, Perdomo C, et al. MicroRNAs as modulators of smoking-induced gene expression changes in human airway epithelium. Proc Natl Acad Sci U S A. 2009;106(7):2319–2324. [Google Scholar]
- 98.Takahashi K, Yokota S, Tatsumi N, et al. Cigarette smoking substantially alters plasma microRNA profiles in healthy subjects. Toxicol Appl Pharmacol. 2013;272(1):154–160. [Google Scholar]
- 99.Wang XW, Heegaard NH, Orum H. MicroRNAs in liver disease. Gastroenterology. 2012;142(7):1431–1443. [Google Scholar]
- 100.Ioannidis JP. Why most discovered true associations are inflated. Epidemiology. 2008;19(5):640–648. [Google Scholar]
- 101.Siegel R, Naishadham D, Jemal A. Cancer statistics, 2013. CA Cancer J Clin. 2013;63(1):11–30. [Google Scholar]
- 102.Rami-Porta R, Ball D, Crowley J, et al. The IASLC Lung Cancer Staging Project: proposals for the revision of the T descriptors in the forthcoming (seventh) edition of the TNM classification for lung cancer. J Thorac Oncol. 2007;2(7):593–602. [Google Scholar]
- 103.Lebanony D, Benjamin H, Gilad S, et al. Diagnostic assay based on hsa-miR-205 expression distinguishes squamous from nonsquamous non-small-cell lung carcinoma. J Clin Oncol. 2009;27(12):2030–2037. [Google Scholar]
- 104.Raponi M, Dossey L, Jatkoe T, et al. MicroRNA classifiers for predicting prognosis of squamous cell lung cancer. Cancer Res. 2009;69(14):5776–5783. [Google Scholar]
- 105.Patnaik SK, Kannisto E, Knudsen S, et al. Evaluation of microRNA expression profiles that may predict recurrence of localized stage I non-small cell lung cancer after surgical resection. Cancer Res. 2010;70(1):36–45. [Google Scholar]
- 106.Nair VS, Maeda LS, Ioannidis JP. Clinical outcome prediction by microRNAs in human cancer: a systematic review. J Natl Cancer Inst. 2012;104(7):528–540. [Google Scholar]
- 107.Abd-El-Fattah AA, Sadik NA, Shaker OG, et al. Differential microRNAs expression in serum of patients with lung cancer, pulmonary tuberculosis, and pneumonia. Cell Biochem Biophys. 2013;67(3):875–884. [Google Scholar]
- 108.Aushev VN, Zborovskaya IB, Laktionov KK, et al. Comparisons of microRNA patterns in plasma before and after tumor removal reveal new biomarkers of lung squamous cell carcinoma. PLoS One. 2013;8(10):e78649. [Google Scholar]
- 109.Boeri M, Verri C, Conte D, et al. MicroRNA signatures in tissues and plasma predict development and prognosis of computed tomography detected lung cancer. Proc Natl Acad Sci U S A. 2011;108(9):3713–3718. [Google Scholar]
- 110.Cazzoli R, Buttitta F, Di Nicola M, et al. MicroRNAs derived from circulating exosomes as noninvasive biomarkers for screening and diagnosing lung cancer. J Thorac Oncol. 2013;8(9):1156–1162. [Google Scholar]
- 111.Chen X, Hu Z, Wang W, et al. Identification of ten serum microRNAs from a genome-wide serum microRNA expression profile as novel noninvasive biomarkers for nonsmall cell lung cancer diagnosis. Int J Cancer. 2012;130(7):1620–1628. [Google Scholar]
- 112.Foss KM, Sima C, Ugolini D, et al. MiR-1254 and miR-574-5p: serum-based microRNA biomarkers for early-stage non-small cell lung cancer. J Thorac Oncol. 2011;6(3):482–488. [Google Scholar]
- 113.Heegaard NH, Schetter AJ, Welsh JA, et al. Circulating micro-RNA expression profiles in early stage nonsmall cell lung cancer. Int J Cancer. 2012;130(6):1378–1386. [Google Scholar]
- 114.Hennessey PT, Sanford T, Choudhary A, et al. Serum microRNA biomarkers for detection of non-small cell lung cancer. PLoS One. 2012;7(2):e32307. [Google Scholar]
- 115.Le HB, Zhu WY, Chen DD, et al. Evaluation of dynamic change of serum miR-21 and miR-24 in pre- and post-operative lung carcinoma patients. Med Oncol. 2012;29(5):3190–3197. [Google Scholar]
- 116.Rani S, Gately K, Crown J, et al. Global analysis of serum microRNAs as potential biomarkers for lung adenocarcinoma. Cancer Biol Ther. 2013;14(12):1104–1112. [Google Scholar]
- 117.Roth C, Stückrath I, Pantel K, et al. Low levels of cell-free circulating miR-361-3p and miR-625* as blood-based markers for discriminating malignant from benign lung tumors. PLoS One. 2012;7(6):e38248. [Google Scholar]
- 118.Sanfiorenzo C, Ilie MI, Belaid A, et al. Two panels of plasma microRNAs as non-invasive biomarkers for prediction of recurrence in resectable NSCLC. PLoS One. 2013;8(1):e54596. [Google Scholar]
- 119.Shen J, Liu Z, Todd NW, et al. Diagnosis of lung cancer in individuals with solitary pulmonary nodules by plasma microRNA biomarkers. BMC Cancer. 2011;11:374. [Google Scholar]
- 120.Silva J, Garcia V, Zaballos A, et al. Vesicle-related microRNAs in plasma of nonsmall cell lung cancer patients and correlation with survival. Eur Respir J. 2011;37(3):617–623. [Google Scholar]
- 121.Tang D, Shen Y, Wang M, et al. Identification of plasma microRNAs as novel noninvasive biomarkers for early detection of lung cancer. Eur J Cancer Prev. 2013;22(6):540–548. [Google Scholar]
- 122.Yuxia M, Zhennan T, Wei Z. Circulating miR-125b is a novel biomarker for screening non-small-cell lung cancer and predicts poor prognosis. J Cancer Res Clin Oncol. 2012;138(12):2045–2050. [Google Scholar]
- 123.Shen J, Todd NW, Zhang H, et al. Plasma microRNAs as potential biomarkers for non-small-cell lung cancer. Lab Invest. 2011;91(4):579–587. [Google Scholar]
- 124.Garber ME, Troyanskaya OG, Schluens K, et al. Diversity of gene expression in adenocarcinoma of the lung. Proc Natl Acad Sci U S A. 2001;98(24):13784–13789. [Google Scholar]
- 125.Maheswaran S, Sequist LV, Nagrath S, et al. Detection of mutations in EGFR in circulating lung-cancer cells. N Engl J Med. 2008;359(4):366–377. [Google Scholar]
- 126.Shedden K, Taylor JM, Enkemann SA, et al. Gene expression-based survival prediction in lung adenocarcinoma: a multi-site, blinded validation study. Nat Med. 2008;14(8):822–827. [Google Scholar]
- 127.Kwak EL, Bang YJ, Camidge DR, et al. Anaplastic lymphoma kinase inhibition in non-small-cell lung cancer. N Engl J Med. 2010;363(18):1693–1703. [Google Scholar]
- 128.Efron B, Tibshirani R. Empirical Bayes methods and false discovery rates for microarrays. Genet Epidemiol. 2002;23(1):70–86. [Google Scholar]
- 129.Simon R, Lam A, Li MC, et al. Analysis of gene expression data using BRB-ArrayTools. Cancer Inform. 2007;3:11–17. [Google Scholar]
- 130.Landgraf P, Rusu M, Sheridan R, et al. A mammalian microRNA expression atlas based on small RNA library sequencing. Cell. 2007;129(7):1401–1414. [Google Scholar]
- 131.Kuller LH, Bracken MB, Ogino S, et al. The role of epidemiology in the era of molecular epidemiology and genomics: summary of the 2013 AJE-sponsored Society of Epidemiologic Research Symposium. Am J Epidemiol. 2013;178(9):1350–1354. [Google Scholar]
- 132.Lumbreras B, Parker LA, Porta M, et al. Overinterpretation of clinical applicability in molecular diagnostic research. Clin Chem. 2009;55(4):786–794. [Google Scholar]
- 133.Yang JS, Phillips MD, Betel D, et al. Widespread regulatory activity of vertebrate microRNA* species. RNA. 2011;17(2):312–326. [Google Scholar]
- 134.Griffiths-Jones S, Hui JH, Marco A, et al. MicroRNA evolution by arm switching. EMBO Rep. 2011;12(2):172–177. [Google Scholar]
- 135.Kirschner MB, Kao SC, Edelman JJ, et al. Haemolysis during sample preparation alters microRNA content of plasma. PLoS One. 2011;6(9):e24145. [Google Scholar]
Associated Data
This section collects any data citations, data availability statements, or supplementary materials included in this article.