

Abstract
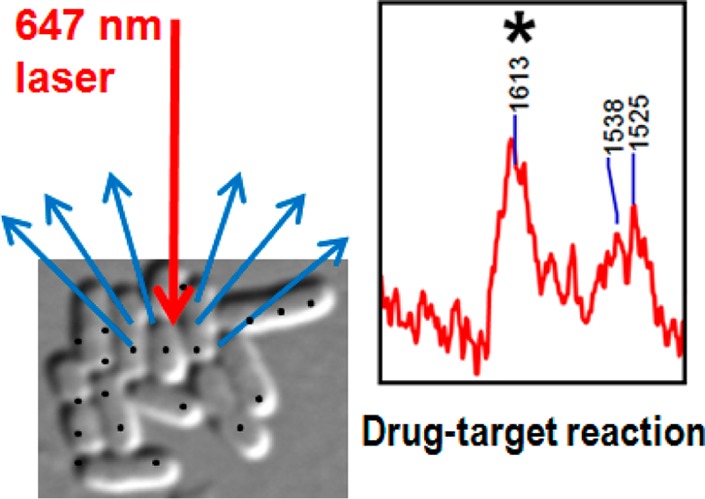
Raman microspectroscopy combined with Raman difference spectroscopy reveals the details of chemical reactions within bacterial cells. The method provides direct quantitative data on penetration of druglike molecules into Escherichia coli cells in situ along with the details of drug–target reactions. With this label-free technique, clavulanic acid and tazobactam can be observed as they penetrate into E. coli cells and subsequently inhibit β-lactamase enzymes produced within these cells. When E. coli cells contain a β-lactamase that forms a stable complex with an inhibitor, the Raman signature of the known enamine acyl–enzyme complex is detected. From Raman intensities it is facile to measure semiquantitatively the number of clavulanic acid molecules taken up by the lactamase-free cells during growth.
A central challenge in antibiotic discovery is to follow the penetration of druglike molecules into bacterial cells and monitor their interactions with the target enzymes. The need to quantitate the penetration of antibiotic-like molecules into bacterial cells remains a major barrier to this understanding.1 Previous studies on cell permeability of antibiotics were indirect and limited because the measurements relied on reconstituted proteoliposomes,2 radiolabeled compounds, or a specific enzyme reaction inside intact cells compared with the reaction of the compounds with cell lysate.3−5 However, druglike molecules have specific Raman signatures that can be used to follow directly their penetration and reactions in bacteria cells.
β-Lactam compounds are one of three major classes of antibiotics against bacterial infections. Unfortunately, β-lactamase production is the most common and important mechanism of bacterial resistance to β-lactam antibiotics among Gram-negative bacteria.6 β-Lactamase enzymes hydrolyze the lactam ring of β-lactam antibiotics, rendering them ineffective before they reach their intended target, the penicillin binding proteins (PBPs) that play critical roles in peptidoglycan synthesis and maintaining the integrity and shape of most bacterial cells.
The present work uses Raman microspectroscopy combined with Raman difference spectroscopy7−9 to follow specific changes in a very complex system. We monitor the penetration of clavulanic acid and tazobactam and their reactions with different β-lactamases inside whole bacterial cells. This report is built on a plethora of earlier studies characterizing drug:β-lactamase complexes in single crystals10,11 and more recent advances in which these complexes were trapped in dilute aqueous solutions.12 Although Raman microspectroscopy has been used for more than two decades for imaging and characterization of various cells,13−15 cell division,16 molecular composition of different part of cells,17 and studying metabolic states of bacterial cells with and without antibiotic treatment,18 our protocol is singular in at least in two aspects. First, the Raman spectra are from a group of freeze-dried bacteria that are located in the focal volume of the laser beam rather than from a single bacterial cell. Thus, we are not undertaking cell imaging per se. Second, flash freezing allows us to follow the time evolution on the subminute time scale, and using difference spectroscopy we can record specific changes (e.g., drug penetration, drug–target reactions, and associated changes in cell-wall metabolism) within cells. We present for the first time a technique that can be used to follow drug reactions occurring inside live bacterial cells.
Materials and Methods
Bacterial Strains and Cloning
The β-lactamase genes blaSHV-1, and blaKPC-2 were cloned into the pBC SK (−) and pBC SK (+) [cat] phagemid vectors (Stratagene, La Jolla, CA), respectively. These vectors were transformed into E. coli DH10B [endA1 recA1 galE15 galK16 nupG rpsL ΔlacX74 Φ80lacZΔM15 araD139 Δ(ara,leu)7697 mcrA Δ(mrr-hsdRMS-mcrBC)] cells (Invitrogen, Carlsbad, CA) as a host strain and exploited for site-directed mutagenesis using Stratagene’s Quik Change mutagenesis kit to provide blaSHV-1 E166A and blaKPC-2 E166A, respectively, as previously described.19−21E. coli DH10B cells carrying the empty pBCSK (−) vector (no bla) were used as a control.
Purification of SHV-1 β-Lactamase
E. coli DH10B cells carrying the blaSHV-1 plasmid were grown overnight with agitation at 37 °C in Lysogeny Broth (LB, no. 136) containing 20 μg/mL chloramphenicol. Cells were harvested by centrifugation, and the pellet was stored frozen at −80 °C. Cells were lysed by freezing and thawing the pellet (at −70 and 0 °C, respectively, for 20 min) three times followed by the addition of 40 mg/L lysozyme from chicken egg white (Sigma) in Tris-EDTA (10 or 1 mM) buffer (pH 7.4) and stirring for half an hour at room temperature. After centrifugation, the soluble fraction was concentrated using an ultrafiltration membrane with a molecular weight cutoff of 10 kDa (Millipore) to remove the low-molecular-weight proteins from the mixture and decrease the sample volume for the FPLC step. The concentrated fraction was loaded on a gel-filtration column (Superdex Hi Load 26/60) that had been pre-equilibrated in sodium bicarbonate buffer (10 mM, pH 8.5), and proteins were eluted in the same buffer. SHV-1-enriched fractions were next passed over an anion-exchange column [Q Sepharose Hi Load 26/10 (Pharmacia, Uppsala, Sweden)], which was developed with a 10–900 mM sodium bicarbonate (pH 8.5) gradient. SHV-1 was eluted from the column using 450 mM sodium bicarbonate. The purity of SHV-1 protein was assessed by SDS-PAGE, and the concentration was determined using a Thermo Scientific NanoDrop spectrometer.
SHV-1 Crystallization
SHV-1 was concentrated to 10 mg/mL in 2 mM HEPES buffer (pH 7.4) for crystallization by the vapor diffusion method. The 5 μL hanging drop containing 2 μL of 10 mg/mL SHV-1, 0.5 μL of Cymal-6 detergent (Hampton Research, Laguna Niguel, CA), and 2.5 μL of reservoir solution (2 M MgSO4 and 0.1 M HEPES, pH 6.5) was placed over 1 mL of reservoir solution. The enzyme crystallized in approximately 1 week.
Raman Crystallography
The Raman microscopy technique has been described previously.10,11 A SHV-1 crystal was transferred into a solution containing 20% poly(ethylene glycol) 6000 and 0.1 M Tris-HCl (pH 7) and washed several times. Then the crystal was transferred to 4 μL of the same solution on a siliconized glass coverslip and brought into a hanging drop setup. A 100 mW 647 nm Kr+ laser beam (Innova 70 C, Coherent, Palo Alto, CA) was focused into the protein crystal using an 20× objective. The Raman spectrum of an apo-crystal was acquired for 1 s and 100 accumulations. Then 1 μL of 100 mM clavulanic acid in water was added to the 4 μL hanging drop around the SHV-1 crystal. Raman spectra of the reaction of the SHV-1 crystal with clavulanic acid were acquired for 1 s, and 100 accumulations were averaged for each time point serially every 2–3 min. For each condition, one spectrum from the buffer around the crystal was also recorded and subtracted from the crystal spectrum. To acquire the Raman difference spectrum for each time point, the Raman spectrum of the SHV-1 apo-crystal was subtracted from the Raman spectrum of the crystal plus clavulanic acid at each time point.
Rapid Mix–Rapid Freeze
To trap the intermediates of the reaction between SHV-1 enzyme and clavulanic acid in solution, we used a rapid mix–rapid freeze technique combined with a freeze-drying process developed by our lab.12 Briefly, 200 μL of 5 mg/mL SHV-1 enzyme was mixed with 200 μL of 0.34 mg/mL clavulanic acid (this concentration represents about 10 molar equiv with respect to SHV-1 enzyme) in a commercial rapid mixing apparatus (KinTek RQF-3). Intermediates at different time points were trapped by freezing the reaction mixture in isopentane at −110 °C using different delay times. After freeze-drying of the frozen material, Raman spectra were taken from the freeze-dried powder on aluminum foil on the microscope stage.
Raman Spectroscopy of Bacterial Cells
E. coli DH10B cells producing one of the different β-lactamases (SHV-1, SHV-1 E166A, KPC-2, or KPC-2 E166A) were grown at 37 °C with agitation in Mueller Hinton broth (Difco) containing 20 μg/mL chloramphenicol. A clinical inhibitor [clavulanic acid (Sigma), with a final concentration of 10 μg/mL, or tazobactam (Chem-Impex International) with a final concentration of 200 μg/mL] was added to the medium when the optical density at 600 nm (OD600) was 0.1. The cells were pelleted when the OD600 was 0.8. The pellet was washed two times with buffer (dibasic potassium phosphate 0.067 M and magnesium chloride 0.01 M, pH 7)22 and then freeze-dried. A Raman microscope was used to record the spectra of freeze-dried cells grown in the presence or absence of inhibitor. Data collection and processing were performed using HoloGRAMS and GRAMS/AI7 software (ThermoGalactic, Salem, NH). To obtain Raman difference spectra, the spectrum of the freeze-dried bacterial cells grown in the absence of inhibitor was subtracted from that of the cells grown in the presence of the drug.
Measurement of the Number of Clavulanic Acid Molecules Penetrating into E. coli DH10B Cells
In the first step, a reference curve was made to correlate the Raman intensity of the 1695 cm–1 peak from intact clavulanic acid to the known concentration of clavulanic acid mixed with a known amount of cells. To generate the reference curve, 10 mL aliquots of 0.8 OD600 (3.4 × 10⁹ cfu/mL) culture of E. coli cells were distributed in nine different tubes. The cells were pelleted and washed with buffer, and 5, 10, 25, 50, 100, 250, 500, or 1000 μg of clavulanic acid dissolved in 1 mL water was used to resuspend the pellet in different tubes. For the control sample, 1 mL of water was added. The mixtures were frozen immediately by immersing the tubes in liquid nitrogen (the lag time between addition of clavulanic acid and resuspension before freezing was less than 30 s). Frozen mixtures were freeze-dried, and Raman spectra were taken from each sample. After Raman difference spectra [(cells with drug) minus (cells without drug)] were obtained, the intensity of the 1695 cm–1 peak was measured and ratioed to that of the 1450 cm–1 peak (CH2 vibrations, an internal standard, from all molecules in the cells containing −CH2 groups) from each mother spectrum. The ratio was plotted against the initial amount of clavulanic acid in each sample (see Figure 2).
Figure 2.

(a) Partial Raman spectra of (A) freeze-dried E. coli DH10B and (B) freeze-dried E. coli DH10B mixed with 500 μg of clavulanic acid and (C) the Raman difference spectrum (B minus A). (b) Reference curve for freeze-dried mixtures of clavulanic acid with E. coli DH10B cells (plotted as means with n = 3, error bars show ±SD).
To measure the amount of clavulanic acid penetrating E. coli DH10B cells, cells were grown to 0.1 OD600, and then 10 μg/mL clavulanic acid was added to the medium. Growth was continued to 0.8 OD600, and cells from 10 mL of culture were harvested by centrifugation. This normally took 6–8 h under our conditions. The cell pellet was washed with buffer and then freeze-dried. The Raman spectrum was taken from freeze-dried cells, and after the Raman difference spectrum was obtained, the intensity at 1695 cm–1 was ratioed to that at 1450 cm–1 from the original spectrum. By plotting this ratio on the reference curve, the amount of clavulanic acid present in the cell pellet was calculated. To estimate the number of clavulanic acid molecules present inside each cell, the number of cells present in the 0.8 OD600 culture was estimated by serial dilution of the culture and counting the number of colonies formed on agar plates (cfu/mL). From the amount of clavulanic acid and the number of cells present in the sample, the amount of clavulanic acid inside each cell was calculated (see the Supporting Information for details).
Immunoblotting
Quantitative immunoblotting was developed to determine the total amount of SHV-1 and KPC-2 β-lactamase present per bacterial cell using conditions comparable to those employed in the Raman spectroscopy experiments. In order to determine the total number of cells, the cultures were serially diluted and plated on agar plates containing 20 μg/mL chloramphenicol. The plates were incubated at 37 °C for 16 h, and the colonies were counted. For immunoblot analysis, 10–100 μL aliquots of culture were pelleted and frozen at −20 °C for 16 h. Pellets were resuspended in 20 μL of SDS-PAGE loading dye, separated by SDS-PAGE, and transferred to poly(vinylidene difluoride) membranes (Novex Life Technologies, Carlsbad, CA) by electroblotting. To determine the absolute amount of protein per sample, purified SHV-1 (50–200 ng) or KPC-2 (50–150 ng) β-lactamase was included on the blot. After blocking for 1 h with 5% nonfat dry milk in Tris-buffered saline (TBS) (20 or 150 mM, respectively, pH 7.4), blots were incubated overnight in TBS with 5% nonfat dry milk containing 1 μg/mL anti-SHV-1 or anti-KPC-2 polyclonal antibody, respectively. In addition, a 1:10000 dilution of anti-DnaK monoclonal antibody (Enzo Life Sciences) was used as a loading control. The membranes were washed four times for 15 min in TBS containing 0.1% Tween 20 (TBST) and subsequently incubated with a 1:10000 dilution of horseradish peroxidase (HRP)–Protein G conjugate (Bio-Rad) and HRP–goat anti-mouse antibody conjugate (Santa Cruz Biotechnology) in TBS with 5% nonfat dry milk. After four additional 15 min washes with TBST, the membranes were processed for exposure using the ECL kit (GE Healthcare) and FOTO/Analyst FX (Fotodyne, Inc.). EZQuant gel analysis software was used to measure the density of the bands from the gel images; the background density was subtracted. A standard curve was generated using the densities from the purified SHV-1 and KPC-2 bands. From the standard curve and total cell count, the amount of protein per cell was calculated. Western blotting was performed in triplicate for the SHV-1 and KPC-2 β-lactamase quantification.
Morphological Study
Live cells were observed by differential interference contrast microscopy23 to study their morphology upon growth in the presence or absence of clavulanic acid, tazobactam, or mecillinam in the culture medium. Cells were grown under the same conditions as used in the Raman spectroscopy experiments on bacterial cells and then placed on an agar pad of 1.0 or 1.2% agarose with 0.5% NaCl immediately before observation.
Results
A. Characterizing β-Lactamase and Clavulanic Acid Intermediates in a Single Crystal and in Solution
Clinically utilized β-lactamase inhibitors (clavulanic acid, sulbactam, and tazobactam) undergo complex reactions with β-lactamase enzymes.24 Figure 1a shows a partial reaction scheme of clavulanic acid with class-A β-lactamases.25 Clavulanic acid forms approximately equal amounts of imine and enamine in a reaction within a SHV-1 single crystal.26 Figure S1 in the Supporting Information shows the Raman difference spectrum of intermediates formed in the reaction between clavulanic acid and the SHV-1 β-lactamase in a single crystal. The Raman feature near 1613 cm–1 represents the O=C–C=C–NH– stretching mode of trans-enamine (Figure 1a), and the peak at 1654 cm–1 is assigned to imine intermediates.26
Figure 1.

(a) Partial reaction mechanism of clavulanic acid and class-A β-lactamase enzyme and the structure of mecillinam as an example of a specific penicillin-binding protein 2 inhibitor. (b) Partial Raman difference spectra of freeze-dried powders from the reaction of clavulanic acid with SHV-1 enzyme in solution after 25 ms, 1 s, and 5 s.
To detect the intermediates of this reaction in solution, the reaction between SHV-1 and clavulanic acid in aqueous solution was quenched by freezing the reaction mixture in liquid nitrogen.12 Subsequently, by freeze-drying the frozen mixture we obtained high-quality Raman spectra of the freeze-dried material in the presence or absence of clavulanic acid. Figure 1b shows the partial Raman difference spectra of this reaction, from freeze-dried powder derived from the rapid mix–rapid freeze approach,12 after 25 ms, 1 s, and 5 s. After 25 ms of reaction, the Raman features at 1599 and 1660 cm–1 are assigned to the enamine and imine intermediates, respectively. The peak at 1695 cm–1 corresponds to intact clavulanic acid present in the reaction mixture. After 1 s of reaction, the imine population decreases since the equilibrium in Figure 1a has shifted toward the enamine species. At 1 s, some unreacted clavulanic acid remains present in the mixture. After 5 s of reaction, there is only a trace of imine (1653 and 1647 cm–1) in the mixture. In the 5 s Raman difference spectrum, the broad peak around 1605 cm–1 is assigned to enamine intermediates and the small peak at 1692 cm–1 corresponds to a trace amount of unreacted clavulanic acid in the reaction mixture. The success of these studies depends on the fact that the reactions in crystals are up to 104 times slower than in solution.12 The agreement between the data for the crystal and solution (rapid mix–rapid freeze) reactions demonstrates that the basic mechanisms in the two phases are very similar.
B. Raman Spectroscopy of Freeze-Dried Bacterial Cells
B.1. Following the Penetration of Clavulanic Acid and Tazobactam into E. coli DH10B Cells
To follow the penetration of clavulanic acid and tazobactam into E. coli DH10B cells that were not expressing β-lactamases, cells were grown in the presence and absence of clavulanic acid and tazobactam. Following freeze-drying of a washed pellet from the culture, a Raman microscope was used to record the spectra of the freeze-dried cells. Using Raman difference spectroscopy [(cells with drug) minus (cells without drug)], we could detect Raman features related to intact clavulanic acid or tazobactam inside cells. To quantify the amount of drug penetrating into each cell, we developed an assay based on the Raman intensity of characteristic features from clavulanic acid (the 1695 cm–1 band related to the −C=C– stretching mode; Figure S2 in the Supporting Information) and tazobactam (the 626 cm–1 band assigned to the C–S stretch in the sulfone ring; Figure S3 in the Supporting Information) in their Raman difference spectra and using the 1450 cm–1 peak due to CH2 vibrations in each original spectrum as an internal standard.
Figure 2 shows a reference curve for clavulanic acid in the presence of E. coli cells. Using this assay (see the Supporting Information for details), we determined that when cells were grown in the presence of 10 μg/mL clavulanic acid, ∼ 2.2 × 10⁶ intact molecules of clavulanic acid were associated with each cell. We calculated a similar number for tazobactam, provided that it was added at 100 μg/mL to the cell-growing medium. These data suggest that clavulanic acid penetrates cells about 10 times more readily than tazobactam.
B.2. Detection of Enamine Intermediates and Metabolic Changes in Bacterial Cells Grown in the Presence of Clavulanic Acid
To capture the reaction intermediates formed in vivo, we used a similar protocol. E. coli DH10B cells containing one of the different β-lactamase enzymes [SHV-1, SHV-1 E166A (a deacylation-deficient laboratory-constructed variant), KPC-2, or KPC-2 E166A (a deacylation-deficient laboratory-constructed variant)] encoded on a pBC SK phagemid were used (see Materials and Methods for details). The cells were grown in the presence or absence of clavulanic acid (10 μg/mL) or tazobactam (200 μg/mL), spun down, washed, and freeze-dried. A Raman microscope was used to record their spectra, and difference spectra were obtained by subtraction [(cells with drug) minus (cells without drug)].
Figure 3 shows Raman spectra of freeze-dried cells containing the β-lactamase gene blaSHV-1 on a pBC SK (−) phagemid grown in the absence or presence of clavulanic acid as an inhibitor of the SHV-1 β-lactamase enzyme. Before the application of difference spectroscopy, the traces in Figure 3 appear exactly identical. The signal-to-noise ratio is approximately 55. Nearly all of the spectral features can be assigned to modes from proteins, nucleic acids, and lipids. Assignments of some of the main features are given in Figure 3.27−29
Figure 3.

Raman spectra of freeze-dried E. coli DH10B cells producing SHV-1 enzyme in the absence (top) or presence (bottom) of 10 μg/mL clavulanic acid. A, C, G, and T stand for adenine, cytosine, guanine, and thymine, respectively.
Figure 4 shows a partial Raman difference spectra of cells producing SHV-1 or KPC-2 enzyme after growing in the presence of 10 μg/mL clavulanic acid, where the parent spectra closely resemble those seen in Figure 3. In Figure 4 (upper spectrum), the peak near 1613 cm–1 is assigned to a trans-enamine mode resulting from formation of the SHV-1:clavulanic acid complex. The reaction pathway inside bacterial cells is very similar to the reaction between SHV-1 enzyme and clavulanic acid in solution after several seconds since no imine feature (∼1660 cm–1) is present in the Raman difference spectrum. The precise enamine vibrational frequency in the cell differs slightly from the aqueous solution value. This could reflect the difference in environments, as the solution spectra result from freeze-drying of dilute aqueous solution whereas the whole-cell spectra result from freeze-drying of the acyl–enzyme complex from a viscous solution in the periplasm. Crucially, in cells producing the KPC-2 enzyme, we did not observe any major feature near 1600 cm–1 in the Raman difference spectrum (Figure 4, lower spectrum). This is consistent with the notion that KPC-2 rapidly hydrolyzes the acyl–enzyme complex formed from clavulanic acid and does not form a stable enamine.30
Figure 4.

Partial Raman difference spectra of E. coli DH10B cells producing SHV-1 (top) or KPC-2 (bottom) enzyme after growing in the presence of 10 μg/mL clavulanic acid. * indicates the trans-enamine peak.
In addition to the enamine signature region near 1600 cm–1 in Figure 4, there are many other features in the Raman difference spectra. They are not Raman features of the enamine formed in the reaction or from unreacted clavulanic acid. In Figure 4, Raman difference spectra of SHV-1 and KPC-2 cell samples show similar features in the region between 1200 and 1500 cm–1. These features are assigned to fragments of cell wall, probably glycan, following partial cell lysis in these samples. During centrifugation and washing of the cells, insoluble components of the cell wall that are rich in glycan strands remain in the pellet and produce these features in the Raman difference spectra.
To estimate the enamine concentration inside bacterial cells, we measured the amount of SHV-1 or KPC-2 enzyme per cell by immunoblotting (see Materials and Methods). Our data (see Figure 5) indicate that 17 ± 10 fg of SHV-1 or 3 ± 0.7 fg of KPC-2 enzyme is present in each E. coli DH10B cell carrying the blaSHV-1 or blaKPC-2 plasmid, respectively.
Figure 5.

Quantification of the total amount of SHV-1 or KPC-2 per bacterial cell. (a) Western blot with anti-SHV-1 antibody and anti-DnaK antibody (as a loading control) using lysed E. coli DH10B SHV-1 pBC SK (−) cells and known amounts of pure SHV-1. (b) Western blot with anti-KPC-2 antibody and anti-DnaK antibody (as a loading control) using lysed E. coli DH10B KPC-2 pBC SK (+) cells and known amounts of pure KPC-2.
In the next set of experiments, cells producing SHV-1 E166A or KPC-2 E166A enzyme were used. The glutamic acid to alanine mutation renders both enzymes deacylation-deficient and should lead to the formation of a long-lived acyl–enzyme intermediate in the reaction with clavulanic acid.31 In addition, we used cells lacking a β-lactamase gene as a control. Figure 6a,b shows that the Raman difference spectra of cells producing the deacylation-deficient enzymes both display a peak near 1600 cm–1 that is assigned to the enamine intermediate. The exact position (∼1599 cm–1) is 14 cm–1 lower than the corresponding band with wild-type SHV-1 in the cell (Figure 4). This difference is similar to that for the trans-enamine formed in the single crystal of SHV-1 (the 1613 cm–1 peak in Figure S1 in the Supporting Information) and SHV-1 E166A (1602 cm–1).26 The KPC-2 E166A variant enzyme also formed enamine intermediates as predicted (Figure 6b). The very similar features in the Raman difference spectra of SHV-1 E166A and KPC-2 E166A provide evidence for similar reactions between these enzymes and clavulanic acid. In cells lacking β-lactamase (Figure 6c) there is only a weak feature at 1597 cm–1, which may be due to the reaction of clavulanic acid with PBPs.32,33 The peaks near 1690–1700 cm–1 in Figure 6a–c are assigned to unreacted clavulanic acid inside cells. The band near 1638 cm–1 is not definitively assigned but may result from changes in cell-wall synthesis induced by clavulanic acid.
Figure 6.

Raman difference spectra of E. coli DH10B cells producing (a) SHV-1 E166A, (b) KPC-2 E166A, or (c) no β-lactamase grown in the presence of 10 μg/mL clavulanic acid and (d) cells without β-lactamase grown in the presence of 10 μg/mL mecillinam. * in (a) and (b) denotes the trans-enamine peak. ▼ in (a), (b), and (c) denotes the peak due to intact clavulanic acid.
In addition to the enamine and unreacted clavulanic acid signatures in the Raman difference spectra, it is proposed that the other features are due primarily to the reaction of clavulanic acid in the cell-wall synthesis pathways in a similar manner in all three cases. Many of the negative features in the Raman difference spectra between 1200 and 1500 cm–1 (Figure 6) can be assigned to peptidoglycans, suggesting that clavulanic acid interferes with cell-wall synthesis. It has been reported that PBP2 is a major target of clavulanic acid, leading to a reduction of peptidoglycan synthesis and a change in cell morphology where cells become spherical.34−36 For comparison, cells without a β-lactamase gene were grown in the presence of 10 μg/mL mecillinam, which is known to bind PBP2 with a high affinity.32 The Raman difference spectrum from this experiment is presented in Figure 6d. It is strikingly similar to those in Figure 6a–c, supporting the interference of clavulanic acid with PBP2 activity.
In general, the Raman difference spectra from different batches of the same cell/compound, recorded on different dates, were highly reproducible.
B.3. Detection of Enamine Intermediates and Metabolic Changes in Bacterial Cells Grown in the Presence of Tazobactam
Clavulanic acid was chosen for this study because this compound is known to more readily enter the periplasmic space than other β-lactamase inhibitors such as tazobactam.22 Still, we found that useful results could be obtained by growing cells in the presence of the latter at concentrations of 100–200 μg/mL. The Raman difference spectrum from E. coli DH10B cells producing SHV-1 is shown in Figure 7. The presence of unreacted tazobactam is indicated by the characteristic tazobactam peaks near 1785 cm–1 (C=O mode of the lactam ring) and 627 cm–1 (C–S mode).37 The peak for the enamine acyl–enzyme complex at 1597 cm–1 is the same value as that for the enamine in solution and single crystals.12,26 SHV-1 can be inhibited by tazobactam with much lower turnover number (∼5) compared with clavulanic acid (∼40).38 Turnover number, put simply, is the number of inhibitor molecules needed to block the enzyme. This predicts that there will be a significant amount of intact inhibitor (tazobactam) present in the periplasmic area of cells producing SHV-1 enzyme, which is confirmed by the presence of the lactam C=O mode near 1785 cm–1 and the C–S mode at 627 cm–1.
Figure 7.
Partial Raman difference spectrum of E. coli DH10B cells producing SHV-1 grown in the presence of 200 μg/mL tazobactam. The peaks at 1789 and 627 cm–1 represent unreacted tazobactam, and the peak at 1597 cm–1 is assigned to enamine intermediates.
The overall Raman difference spectrum of cells containing SHV-1 enzyme grown in the presence of tazobactam (Figure 7) is remarkably similar to those seen in Figure 6a–c, which strongly indicates that tazobactam can inhibit PBPs in a similar manner as clavulanic acid.36 In addition, a morphological study of cells grown in the presence of tazobactam showed a loss of rod shape similar to the effects of clavulanic acid (data not shown).
The strong parallel between the results for clavulanic acid and tazobactam provides additional evidence for the formation of enamine species inside the cells and for the action of different inhibitors on the same PBPs in the cell-wall synthesis pathway.
Discussion
We have shown that Raman microspectroscopy can be used to detect both unreacted druglike molecules and the Raman signature of the corresponding drug–target (acyl–enzyme) complex within whole bacterial cells. In the case of bacterial cells, we selected strains that express one of two β-lactamases (SHV-1 or KPC-2) or one of their variants, each of which has different reaction profiles toward clavulanic acid and tazobactam. Interestingly, enamine-like intermediates were detected in the cells producing deacylation-deficient β-lactamases but not in cells producing KPC-2 enzyme, which readily hydrolyzes clavulanic acid. The results are summarized in Table 1. Expectations based on other parameters measured in vitro were also met. To illustrate, cells producing SHV-1, an enzyme with a low turnover number for clavulanate, also appeared to contain a population of enamine-like acyl–enzyme complex. Overall, the in vitro properties of the β-lactamases were predictive of their in vivo states, at least in an E. coli experimental background. More generally, our results provide a “proof of principle” that Raman microspectroscopy is a viable and unique approach to characterize specific enzyme properties in their highly complex and physiologically relevant cellular habitat. Increasing sensitivity will result from higher laser exposure time.
Table 1. Summary of Corresponding Raman Features of Intermediates Formed by Reaction with Clavulanic Acid under Different Reaction Conditions.
| wavenumber
(cm–1) |
||
|---|---|---|
| substrate | trans-enamine O=C–C=C–NH– | protonated imine –C=NH+– |
| SHV-1 single crystal | 1613 | 1654 |
| SHV-1 in solution | 1605 | small trace at 1654 |
| SHV-1 in E. coli DH10B | 1613 | no peak |
| KPC-2 in E. coli DH10B | no peak | no peak |
| SHV-1E166A single crystal | 1602 | no peak |
| SHV-1E166A in E. coli DH10B | 1599 | no peak |
| KPC-2E166A in E. coli DH10B | 1598 | no peak |
| E. coli DH10B without β-lactamase gene | small trace at 1597 | no peak |
The assignment of the enamine species inside the cells is bolstered by an in-depth Raman analysis of the reaction in single crystals11 and in solution.12 However, we are only beginning to assign features in the difference spectra due to changes in cell component populations. It will be of interest to expand the analyses by testing the effects of defined mutations in metabolic pathways on the cellular Raman spectra. This, and when possible the insertion of stable isotopes at key locations in the cell, should enable the interpretation of whole-cell Raman data with increasing certainty. Indeed, the protocol described here should be readily adaptable to the study of metabolic changes at the molecular level in other areas of cell biology.
An immediate application stems from the demonstration that the intensity of Raman peaks can be used to measure, at least at the semiquantitative level, the concentration of inhibitor/antibiotic compounds entering bacterial cells. We measured about 2.2 × 10⁶ unreacted clavulanic acid molecules per cell (see the Supporting Information) compared with 3 × 10⁵ molecules of SHV-1 enzyme per cell as revealed by immunoblotting. We note that this makes it the second-most-abundant protein in the cell next to Braun’s lipoprotein. The slight excess of compound over enzyme is confirmed by the results with tazobactam. In Figure 7 it appears that an enamine complex has been formed between tazobactam and SHV-1. This is moderately stable since the turnover number is about 5.38 Thus, in Figure 7 we see an excess of unreacted tazobactam coexisting with the stable enamine. The similarity in the numbers of enzymes and inhibitors explains why we can detect intermediates. It must be emphasized that since we are not employing imaging as such, we are measuring the total population of cell-associated species. We cannot identify their location inside the cells. Obtaining a population estimate of a compound inside cells by the Raman protocol is highly reproducible and relatively facile. It does not require labeling or any cell treatment apart from freeze-drying.
As new β-lactamase inhibitors are being developed, we will have an opportunity to study the in-cell reactions as inhibitors are partnered with β-lactams. The reader must keep in mind that we have intentionally chosen to initiate a study using two common class-A β-lactamases (SHV and KPC) with compounds that inhibit these enzymes but also mimic β-lactam substrates. Our choice here was based upon our ability to interpret the reaction chemistry in vivo. As we extend our studies to β-lactamases that defy inhibition (class-D oxacarbapenemases, class-C cephalosporinases, and even metallo-β-lactamase enzymes), we will enjoy the opportunity to correlate the whole-cell inhibition chemistry with in vitro results. These insights will add significantly to the knowledge available to the medicinal chemist as both β-lactam-based and non-β-lactam-based inhibitors or fragments are designed. Moreover, the reactions observed at the cell-wall interface also have implications for host response. Our approach opens up a “new window” in β-lactam and β-lactamase inhibitor medicinal chemistry.
Acknowledgments
We thank Dr. Brian A. Cobb for the gift of polysaccharide A from Bacteroides fragilis and Logan Persons for technical assistance in bacterial microscopy.
Supporting Information Available
Raman difference spectra of intermediates from clavulanic acid with an SHV-1 single crystal, Raman spectra of unreacted clavulanic acid and tazobactam, details of sample requirements, and calculation of clavulanic acid and tazobactam penetration inside the bacterial cell. This material is available free of charge via the Internet at http://pubs.acs.org.
This work was supported by NIH GM54072 to P.R.C. and NIH GM57059 to P.A.J.d.B. R.A.B. acknowledges support from NIH under Awards R01AI072219, R01AI063517, and R01AI100560 and by funds and/or facilities provided by the Louis Stokes Cleveland Department of Veterans Affairs Medical Center and the VISN 10 Geriatric Research, Education and Clinical Care Center of the Department of Veterans Affairs.
The authors declare no competing financial interest.
Funding Statement
National Institutes of Health, United States
Supplementary Material
References
- Lewis K. (2013) Platforms for antibiotic discovery. Nat. Rev. Drug Discovery 12, 371–387. [DOI] [PubMed] [Google Scholar]
- Yoshimura F.; Nikaido H. (1985) Diffusion of β-Lactam Antibiotics through the Porin Channels of Escherichia coli K-12. Antimicrob. Agents Chemother. 27, 84–92. [DOI] [PMC free article] [PubMed] [Google Scholar]
- Zimmermann W.; Rosselet A. (1977) Function of Outer Membrane of Escherichia coli as a Permeability Barrier to β-Lactam Antibiotics. Antimicrob. Agents Chemother. 12, 368–372. [DOI] [PMC free article] [PubMed] [Google Scholar]
- Lakaye B.; Dubus A.; Joris B.; Frere J. M. (2002) Method for estimation of low outer membrane permeability to β-lactam antibiotics. Antimicrob. Agents Chemother. 46, 2901–2907. [DOI] [PMC free article] [PubMed] [Google Scholar]
- Zimmermann W. (1980) Penetration of β-Lactam Antibiotics into Their Target Enzymes in Pseudomonas aeruginosa—Comparison of a Highly Sensitive Mutant with Its Parent Strain. Antimicrob. Agents Chemother. 18, 94–100. [DOI] [PMC free article] [PubMed] [Google Scholar]
- Bradford P. A. (2001) Extended-spectrum β-lactamases in the 21st century: Characterization, epidemiology, and detection of this important resistance threat. Clin. Microbiol. Rev. 14, 933–951. [DOI] [PMC free article] [PubMed] [Google Scholar]
- Rousseau D. L. (1981) Raman Difference Spectroscopy as a Probe of Biological Molecules. J. Raman Spectrosc. 10, 94–99. [Google Scholar]
- Callender R.; Deng H. (1994) Nonresonance Raman Difference Spectroscopy—A General Probe of Protein Structure, Ligand Binding, Enzymatic Catalysis, and the Structures of Other Biomacromolecules. Annu. Rev. Biophys. Biomol. Struct. 23, 215–245. [DOI] [PubMed] [Google Scholar]
- Thomas G. J. (1999) Raman spectroscopy of protein and nucleic acid assemblies. Annu. Rev. Biophys. Biomol. Struct. 28, 1–27. [DOI] [PubMed] [Google Scholar]
- Carey P. R. (2006) Raman crystallography and other biochemical applications of Raman microscopy. Annu. Rev. Phys. Chem. 57, 527–554. [DOI] [PubMed] [Google Scholar]
- Carey P. R.; Chen Y. Y.; Gong B.; Kalp M. (2011) Kinetic crystallography by Raman microscopy. Biochim. Biophys. Acta 1814, 742–749. [DOI] [PMC free article] [PubMed] [Google Scholar]
- Heidari Torkabadi H.; Che T.; Shou J.; Shanmugam S.; Crowder M. W.; Bonomo R. A.; Pusztai-Carey M.; Carey P. R. (2013) Raman spectra of interchanging β-lactamase inhibitor intermediates on the millisecond time scale. J. Am. Chem. Soc. 135, 2895–2898. [DOI] [PMC free article] [PubMed] [Google Scholar]
- Puppels G. J.; Demul F. F. M.; Otto C.; Greve J.; Robertnicoud M.; Arndtjovin D. J.; Jovin T. M. (1990) Studying Single Living Cells and Chromosomes by Confocal Raman Microspectroscopy. Nature 347, 301–303. [DOI] [PubMed] [Google Scholar]
- Stockel S.; Meisel S.; Elschner M.; Rosch P.; Popp J. (2012) Identification of Bacillus anthracis via Raman Spectroscopy and Chemometric Approaches. Anal. Chem. 84, 9873–9880. [DOI] [PubMed] [Google Scholar]
- Premasiri W. R.; Gebregziabher Y.; Ziegler L. D. (2011) On the Difference between Surface-Enhanced Raman Scattering (SERS) Spectra of Cell Growth Media and Whole Bacterial Cells. Appl. Spectrosc. 65, 493–499. [DOI] [PMC free article] [PubMed] [Google Scholar]
- Huang Y. S.; Karashima T.; Yamamoto M.; Hamaguchii H. (2003) Molecular-level pursuit of yeast mitosis by time- and space-resolved Raman spectroscopy. J. Raman Spectrosc. 34, 1–3. [Google Scholar]
- Kaliaperumal V.; Hamaguchi H. (2012) Casting New Physicochemical Light on the Fundamental Biological Processes in Single Living Cells by Using Raman Microspectroscopy. Chem. Rec. 12, 567–580. [DOI] [PubMed] [Google Scholar]
- Moritz T. J.; Taylor D. S.; Polage C. R.; Krol D. M.; Lane S. M.; Chan J. W. (2010) Effect of Cefazolin Treatment on the Nonresonant Raman Signatures of the Metabolic State of Individual Escherichia coli Cells. Anal. Chem. 82, 2703–2710. [DOI] [PubMed] [Google Scholar]
- Rice L. B.; Carias L. L.; Hujer A. M.; Bonafede M.; Hutton R.; Hoyen C.; Bonomo R. A. (2000) High-level expression of chromosomally encoded SHV-1 β-lactamase and an outer membrane protein change confer resistance to ceftazidime and piperacillin-tazobactam in a clinical isolate of Klebsiella pneumoniae. Antimicrob. Agents Chemother. 44, 362–367. [DOI] [PMC free article] [PubMed] [Google Scholar]
- Hujer A. M.; Hujer K. M.; Bonomo R. A. (2001) Mutagenesis of amino acid residues in the SHV-1 β-lactamase: The premier role of Gly238Ser in penicillin and cephalosporin resistance. Biochim. Biophys. Acta 1547, 37–50. [DOI] [PubMed] [Google Scholar]
- Papp-Wallace K. M.; Taracila M.; Hornick J. M.; Hujer A. M.; Hujer K. M.; Distler A. M.; Endimiani A.; Bonomo R. A. (2010) Substrate Selectivity and a Novel Role in Inhibitor Discrimination by Residue 237 in the KPC-2 β-Lactamase. Antimicrob. Agents Chemother. 54, 2867–2877. [DOI] [PMC free article] [PubMed] [Google Scholar]
- Farmer T. H.; Degnan B. A.; Payne D. J. (1999) Penetration of β-lactamase inhibitors into the periplasm of Gram-negative bacteria. FEMS Microbiol. Lett. 176, 11–15. [DOI] [PubMed] [Google Scholar]
- Johnson J. E.; Lackner L. L.; de Boer P. A. (2002) Targeting of (D)MinC/MinD and (D)MinC/DicB complexes to septal rings in Escherichia coli suggests a multistep mechanism for MinC-mediated destruction of nascent FtsZ rings. J. Bacteriol. 184, 2951–2962. [DOI] [PMC free article] [PubMed] [Google Scholar]
- Drawz S. M.; Bonomo R. A. (2010) Three decades of β-lactamase inhibitors. Clin. Microbiol. Rev. 23, 160–201. [DOI] [PMC free article] [PubMed] [Google Scholar]
- Sulton D.; Pagan-Rodriguez D.; Zhou X.; Liu Y. D.; Hujer A. M.; Bethel C. R.; Helfand M. S.; Thomson J. M.; Anderson V. E.; Buynak J. D.; Ng L. M.; Bonomo R. A. (2005) Clavulanic acid inactivation of SHV-1 and the inhibitor-resistant S130G SHV-1 β-lactamase—Insights into the mechanism of inhibition. J. Biol. Chem. 280, 35528–35536. [DOI] [PubMed] [Google Scholar]
- Kalp M.; Totir M. A.; Buynak J. D.; Carey P. R. (2009) Different Intermediate Populations Formed by Tazobactam, Sulbactam, and Clavulanate Reacting with SHV-1 β-Lactamases: Raman Crystallographic Evidence. J. Am. Chem. Soc. 131, 2338–2347. [DOI] [PMC free article] [PubMed] [Google Scholar]
- Carey P. R. (1982) Biochemical Applications of Raman and Resonance Raman Spectroscopies, Academic Press, New York. [Google Scholar]
- Deng H.; Bloomfield V. A.; Benevides J. M.; Thomas G. J. (1999) Dependence of the Raman signature of genomic B-DNA on nucleotide base sequence. Biopolymers 50, 656–666. [DOI] [PubMed] [Google Scholar]
- Harada I., and Takeuchi H. (1986) Raman and Ultraviolet Resonance Raman Spectra of Proteins and Related Compounds, in Spectroscopy of Biological Systems (Clark R. J. H., Hester R. E., Eds.), pp 113–175, John Wiley & Sons, Chichester, U.K. [Google Scholar]
- Papp-Wallace K. M.; Bethel C. R.; Distler A. M.; Kasuboski C.; Taracila M.; Bonomo R. A. (2010) Inhibitor Resistance in the KPC-2 β-Lactamase, a Preeminent Property of This Class A β-Lactamase. Antimicrob. Agents Chemother. 54, 890–897. [DOI] [PMC free article] [PubMed] [Google Scholar]
- Padayatti P. S.; Helfand M. S.; Totir M. A.; Carey M. P.; Carey P. R.; Bonomo R. A.; van den Akker F. (2005) High resolution crystal structures of the trans-enamine intermediates formed by sulbactam and clavulanic acid and E166A SHV-1 β-lactamase. J. Biol. Chem. 280, 34900–34907. [DOI] [PubMed] [Google Scholar]
- Spratt B. G. (1975) Distinct Penicillin Binding-Proteins Involved in Division, Elongation, and Shape of Escherichia coli K12. Proc. Natl. Acad. Sci. U.S.A. 72, 2999–3003. [DOI] [PMC free article] [PubMed] [Google Scholar]
- Spratt B. G.; Jobanputra V.; Zimmerman W. (1977) Binding of Thienamycin and Clavulanic Acid to Penicillin-Binding Proteins of Escherichia coli K-12. Antimicrob. Agents Chemother. 12, 406–409. [DOI] [PMC free article] [PubMed] [Google Scholar]
- de la Rosa E. J.; de Pedro M. A.; Vazquez D. (1985) Penicillin binding proteins: Role in initiation of murein synthesis in Escherichia coli. Proc. Natl. Acad. Sci. U.S.A. 82, 5632–5635. [DOI] [PMC free article] [PubMed] [Google Scholar]
- Wientjes F. B.; Nanninga N. (1991) On the role of the high molecular weight penicillin-binding proteins in the cell cycle of Escherichia coli. Res. Microbiol. 142, 333–344. [DOI] [PubMed] [Google Scholar]
- Moosdeen F.; Williams J. D.; Yamabe S. (1988) Antibacterial Characteristics of Ytr-830, a Sulfone β-Lactamase Inhibitor, Compared with Those of Clavulanic Acid and Sulbactam. Antimicrob. Agents Chemother. 32, 925–927. [DOI] [PMC free article] [PubMed] [Google Scholar]
- Helfand K. S.; Totir M. A.; Carey M. P.; Hujer A. M.; Bonomo R. A.; Carey P. R. (2003) Following the reactions of mechanism-based inhibitors with β-lactamase by Raman crystallography (vol 42, p 13386, 2003). Biochemistry 42, 15398. [DOI] [PubMed] [Google Scholar]
- Helfand M. S.; Bethel C. R.; Hujer A. M.; Hujer K. M.; Anderson V. E.; Bonomo R. A. (2003) Understanding resistance to β-lactams and β-lactamase inhibitors in the SHV β-lactamase—Lessons from the mutagenesis of Ser-130. J. Biol. Chem. 278, 52724–52729. [DOI] [PubMed] [Google Scholar]
Associated Data
This section collects any data citations, data availability statements, or supplementary materials included in this article.