Abstract

Quantitative polymerase chain reaction is the current “golden standard” for quantification of nucleic acids; however, its utility is constrained by an inability to easily and reliably detect multiple targets in a single reaction. We have successfully overcome this problem with a novel combination of two widely used approaches: target-specific multiplex amplification with 15 cycles of polymerase chain reaction (PCR), followed by single-molecule detection of amplicons with atomic force microscopy (AFM). In test experiments comparing the relative expression of ten transcripts in two different human total RNA samples, we find good agreement between our single reaction, multiplexed PCR/AFM data, and data from 20 individual singleplex quantitative PCR reactions. This technique can be applied to virtually any analytical problem requiring sensitive measurement concentrations of multiple nucleic acid targets.
High-throughput transcriptomic assays, such as microarrays or RNA-Seq, allow identification of gene expression signatures consisting of hundreds-to-thousands of genes. However, these high-throughput techniques are costly and time-consuming (turnaround time one-to-several days), need centralized processing in many cases, and are not very sensitive in terms of the amount of input material.1,2 For example, the hybridization-based, nCounter System requires ∼100 ng of input total RNA for gene expression studies, with a typical assay time of 16 h.3 In particular, assay sensitivity is becoming an important figure of merit as interest grows in studying minute quantity samples, such as needle biopsies, aspirates, and circulating tumor cells (CTCs),4 rather than bulk tissue.5−7 At the same time, there is no need to use cost- and time-intensive high-throughput techniques in many situations where an assay of several-to-tens of genes will suffice, such as in the case of established biomarker panels.8−11
Real time-polymerase chain reaction (qPCR) is the golden standard for gene expression-based biomarker assays, due to its sensitivity (single-molecule in the ideal case) and broad dynamic range. However, traditional qPCR is difficult to multiplex, and as a result, multitarget experiments require many single reactions to be conducted in parallel, either in microplate format or in the case of limited-quantity samples, using preamplification and proprietary microfluidic platforms; both approaches which add substantial cost, time, and complexity to the analysis.12,13 Multiplexing standard PCR is problematic because target sequences are typically amplified nonuniformly, which results in misrepresentation of low-abundance and/or “difficult” amplicons due to the depletion of reagents (dNTP and primers) and inhibition of polymerase by amplicons;14 another problem is off-target primer binding and primer dimer formation, for which the probability grows as the number of primer pairs in multiplex increases; note that both these effects accumulate over a reaction time course and result in artifacts at a high number of cycles.
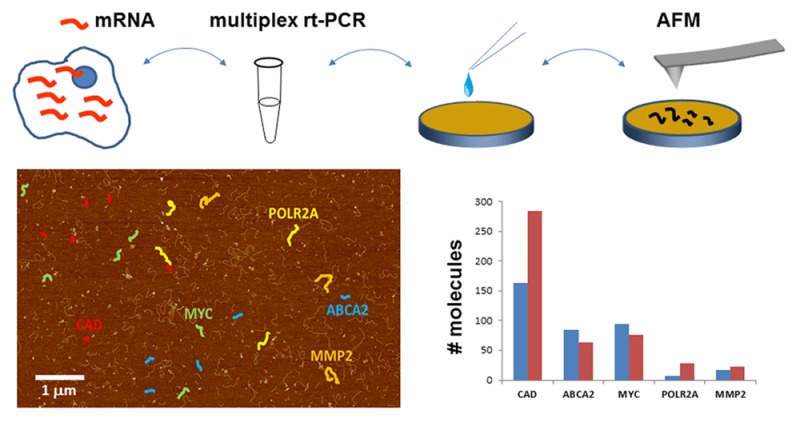
To achieve simple and effective multiplexing of targets in one qPCR reaction, we have combined low-cycle-number (<15 cycles), target-specific multiplex amplification with single-molecule amplicon detection using atomic force microscopy (AFM). By limiting the number of PCR cycles, we seek to avoid the differential amplification distortion present in normal qPCR, which in most cases requires 30+ amplification cycles. We distinguish amplicons by their sizes, and given the high sizing precision achievable with AFM, typically <3% CV,15,16 up to tens of targets can be discriminated simultaneously. Because individual amplicons are easily detected by AFM, our approach has orders of magnitude higher sensitivity (1000×) compared to bulk fluorescent techniques such as microarray and capillary electrophoresis; further, no fluorescent dyes or any other types of labeling are used, thus reducing the complexity and cost of the analysis.
We demonstrate the technique by measuring the relative expression level of ten human genes in two different total RNA samples and find a high concordance between single-reaction multiplex PCR/AFM data and data obtained from a panel of 20 independent singleplex qPCR assays. Aside from transcriptional profiling, this technique could be used to quantify multiple nucleic acids targets in other assays where molecular concentration is relevant, such as in studies of genomic copy number variation, mRNA isoform detection, and analysis of chromosomal translocations.
Results and Discussion
Multiplex PCR
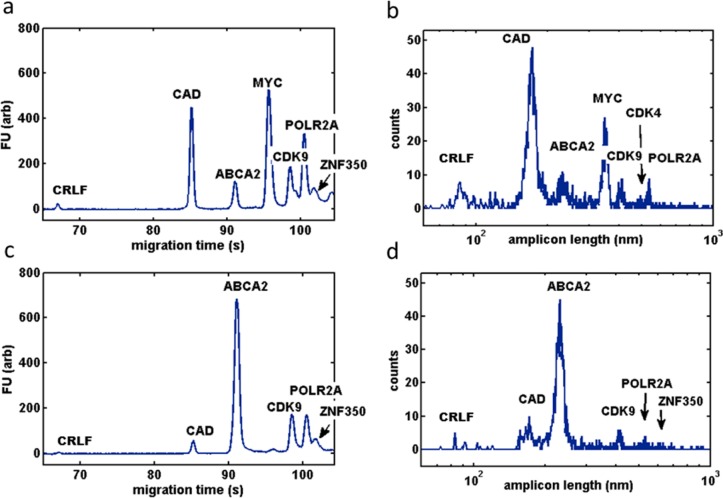
Ten human genes (see Table S1, Supporting Information) were chosen as a model biomarker panel; we measured the difference in expression of transcripts in this panel between two commercially available total RNA samples: Universal Total Human Reference RNA (Stratagene) and FirstChoice Human Brain Reference RNA (Life Technologies). To verify that all ten genes could be coamplified in the same reaction, 30 cycles of multiplex RT-PCR were conducted at primer concentrations listed in Table S1, Supporting Information, using both total RNA samples, and separated in 1% agarose gel (Figure S1, Supporting Information). The Agilent Bioanalyzer DNA high-sensitivity kit was used to quantify the multiplex PCR after 15 amplification cycles (Figure 1).
Figure 1.
(a) Bioanalyzer chromatogram of human reference total RNA 10-plex amplicons (1 μL, conc. 800 pg/μL) compared to (b) size distribution of amplicons measured with AFM (est. ∼1 μL, conc. 10 pg/μL; 2500 molecules). Note that the AFM-determined amplicon sizes are plotted on a logarithmic scale for comparison purposes. Human brain total RNA 10-plex measured by (c) a bioanalyzer (800 pg/μL) and (d) AFM (10 pg/μL; 1500 molecules).
AFM Imaging
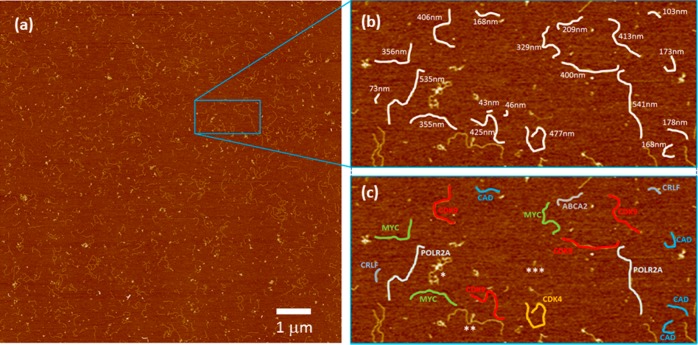
We used APS-treated mica surfaces to bind DNA molecules for AFM imaging.17 Note that we did not purify mRNA from total RNA and used oligo(dT) reverse transcription primers for simplicity, so the solution after PCR contains, in addition to amplicons, genomic DNA contamination, rRNA, all mRNAs, and cDNAs. However, as it can be seen on the AFM image depicted in Figure 2, the most abundant species on mica surface are amplicon molecules, distinguishable from the other reaction constituents by length, height, and persistence length.
Figure 2.
(a) 10 × 10 μm AFM image of 10plex RT-PCR products (15 amplification cycles) produced using Universal Total Human Reference RNA as a template. (b) First inset shows various PCR amplicons highlighted in white with their associated backbone contour measurements. (c) Second inset shows individual amplicons classified by species. Note that background objects are not identified as amplicons due to their nonlinear shape (∗ and ∗∗) or because they were shorter than the smallest expected amplicon (∗∗∗).
Using PCR/AFM, we were able to reliably detect amplicons after 15 cycles (Figure 3), which is lower than qPCR Ct values at comparable amounts of initial cDNA (see qPCR data in Table S2, Supporting Information). In fact, there is a balance in choosing the number of PCR cycles: too few may result in decreased specificity and insufficient amount of amplicons, while too many will distort the initial distribution of nucleic acid targets; so, the number of cycles should be optimized for each assay. Here, we used unmodified primers and amplicons. Labeling of primers at their 5′-end with AFM-detectable labels, such as streptavaidin or other proteins, or nanoparticles, can increase the level of multiplexing at least by a factor of 2-fold (20 targets). Previously, we have shown that sequence-specific labeling can be used to identify individual transcripts in a complex mixture containing several thousand distinct species.15 Sequence-specific labeling of amplicons could not only increase the level of multiplexing but also allow for detection of genetic variations within the amplicons in cases where the amplicon length is detectably altered. In order to minimize the number of steps of our protocol, we used total RNA without enzymatic digestion of remaining genomic DNA and purification of mRNA. Although silica column-based purification allows for specific purification of dsDNA amplicons and elimination of almost all of the ssRNA and ssDNA, the elution volume for a typical column is 6–10 μL. However, 0.1 μL or even less is required for deposition on the mica surface. Using advanced DNA purification techniques, such as purification by electric field,18−21 we can potentially increase the sensitivity of this assay by 100×.
Figure 3.

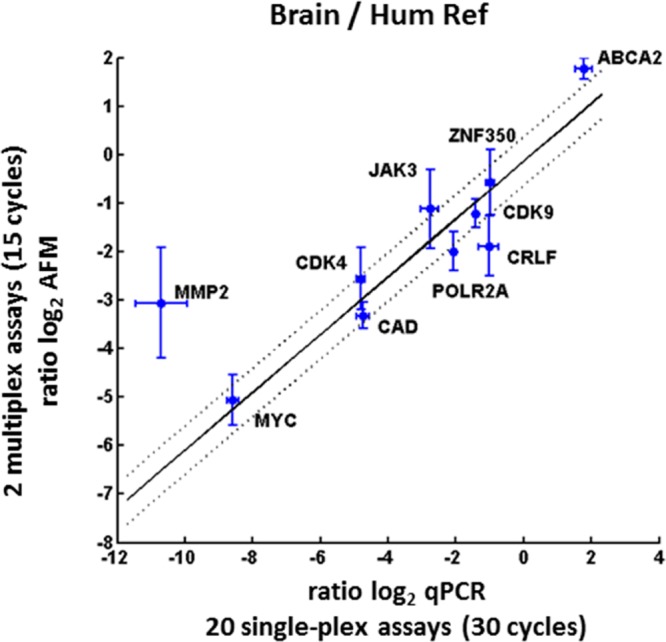
Relative expression of target mRNAs in brain vs human reference total RNA. The relative abundance of each target is determined by AFM (y-axis) vs qPCR (x-axis). Error bars represent the estimated standard error of measurement for qPCR and PCR + AFM. The robust linear least-squares fit is indicated by the solid black line, y = −0.14 + 0.60x, and the dotted black lines represent ±0.5 log2 from the fit. The linear model fits the data well (R2 of the fit is 0.87), indicating that the AFM data is a good predictor of the qPCR measurements. Dispersion of the data about the fit vs qPCR, given by the root mean squared error (RMSE), is 0.87 log2 units. Note that MMP2 is the only gene where the difference in Ct value for Human Reference and Brain sample is more than 10 log2 units at 60 °C (see Table S2, Supporting Information). This fact can be an indicator for the limits of dynamic range for AFM-based PCR using 1000–2000 molecules; increasing the number of analyzed molecules will improve the dynamic range at the expense of throughput.
To determine the repeatability of the PCR + AFM measurement, we separately repeated the 10-plex measurements of Human Reference total RNA, de novo, in triplicate (see Table S6, Supporting Information). The median coefficient of variation (standard error/mean) for the abundances of the ten targets was 0.25 (range of 0.17–0.81). This compares to a median estimated lower limit of error due to statistical counting noise of 0.18 (range of 0.05–0.38). The counting error is a function of the sampling depth (number of molecules counted per sample), and this type of error can be arbitrarily reduced by collecting more molecule counts at the expense of throughput. Note that qPCR itself has been shown to have a relative error (CV) in the range of 0.10–0.25 across most of its dynamic range (Ct values of 18–30; the majority of our qPCR measurements had Ct values in this range). This data indicates that a 2-fold change in gene expression would be detected in a single experiment in most cases where the total number of molecule counts per species is similar to that reported here. (See Supporting Information for further discussion of repeatability.)
This is an initial study of applicability of PCR/AFM to analyze “real” biological material derived from human cells. We restricted ourselves to gene expression profiling of ten genes. Undoubtedly, this technique can be applied to virtually any genetic variation or a combination of genetic variation assayed in the same tube. While the slow imaging rate of our general purpose AFM was a practical constraint (∼25 h imaging time for 2 samples), if a commercially available high scan rate AFM had been used (e.g., Bruker FastScan or Asylum Cypher), the assay time would have been considerably reduced, to 1.4 h or less, which is of similar duration as regular 30–35 cycle qPCR, and significantly more rapid than existing hybridization-based detection schemes (14–16 h).1,3 We note that automated sample handling and image analysis can be easily implemented using standard methods, as we and others have shown previously,16,22 and that AFM technology has progressed to the point that image capture rates can approach that of optical microscopy.23−27 General purpose AFM instruments are commonly available in universities and other research institutions. High scan speed (imaging rate approaching 1 frame per second) AFMs have been commercially available for several years, are beginning to replace “standard” AFMs in the installed base, and are often available in shared core facilities as are quantitative PCR machines and DNA sequencing instruments; the approximate retail price of a state of the art general purpose high speed AFM is on the order of the former and much less than the latter. However, the AFM + PCR method does not require many of the features present in a general purpose AFM, such as complex z-axis feedback control and electronics supporting multiple imaging modes (surface elasticity mapping, electric and magnetic imaging, etc.); a suitable system can be assembled from commercially available components for approximately $30,000.
Acknowledgments
Funding for this work was provided by National Institutes of Health grant R01GM094388 to J.R., B.M., and J.K.G.
Supporting Information Available
Additional information as noted in text. This material is available free of charge via the Internet at http://pubs.acs.org/.
The authors declare no competing financial interest.
Funding Statement
National Institutes of Health, United States
Supplementary Material
References
- Katagiri F.; Glazebrook J. Curr. Protoc. Mol. Biol. 2009, 85, 22.5.1–22.5.15. [DOI] [PubMed] [Google Scholar]
- Nagalakshmi U.; Waern K.; Snyder M. Curr. Protoc. Mol. Biol. 2010, 89, 4.11.1–4.11.13. [DOI] [PubMed] [Google Scholar]
- Kulkarni M. M. Curr. Protoc. Mol. Biol. 2011, 94, 25B.10.1–25B.10.17. [DOI] [PubMed] [Google Scholar]
- Powell A. A.; Talasaz A. H.; Zhang H.; Coram M. A.; Reddy A.; Deng G.; Telli M. L.; Advani R. H.; Carlson R. W.; Mollick J. A.; Sheth S.; Kurian A. W.; Ford J. M.; Stockdale F. E.; Quake S. R.; Pease R. F.; Mindrinos M. N.; Bhanot G.; Dairkee S. H.; Davis R. W.; Jeffrey S. S. PLoS One 2012, 7, e33788. [DOI] [PMC free article] [PubMed] [Google Scholar]
- Eberwine J.; Lovatt D.; Buckley P.; Dueck H.; Francis C.; Kim T. K.; Lee J.; Lee M.; Miyashiro K.; Morris J.; Peritz T.; Schochet T.; Spaethling J.; Sul J. Y.; Kim J. J. R. Soc. Interface 2012, 9, 3165–3183. [DOI] [PMC free article] [PubMed] [Google Scholar]
- Dalerba P.; Kalisky T.; Sahoo D.; Rajendran P. S.; Rothenberg M. E.; Leyrat A. A.; Sim S.; Okamoto J.; Johnston D. M.; Qian D.; Zabala M.; Bueno J.; Neff N. F.; Wang J.; Shelton A. A.; Visser B.; Hisamori S.; Shimono Y.; van de Wetering M.; Clevers H.; Clarke M. F.; Quake S. R. Nat. Biotechnol. 2011, 29, 1120–1127. [DOI] [PMC free article] [PubMed] [Google Scholar]
- Bendall S. C.; Nolan G. P. Nat. Biotechnol. 2012, 30, 639–647. [DOI] [PubMed] [Google Scholar]
- Habel L. A.; Shak S.; Jacobs M. K.; Capra A.; Alexander C.; Pho M.; Baker J.; Walker M.; Watson D.; Hackett J.; Blick N. T.; Greenberg D.; Fehrenbacher L.; Langholz B.; Quesenberry C. P. Breast Cancer Res. 2006, 8, R25. [DOI] [PMC free article] [PubMed] [Google Scholar]
- Colman H.; Zhang L.; Sulman E. P.; McDonald J. M.; Shooshtari N. L.; Rivera A.; Popoff S.; Nutt C. L.; Louis D. N.; Cairncross J. G.; Gilbert M. R.; Phillips H. S.; Mehta M. P.; Chakravarti A.; Pelloski C. E.; Bhat K.; Feuerstein B. G.; Jenkins R. B.; Aldape K. Neuro-Oncology 2010, 12, 49–57. [DOI] [PMC free article] [PubMed] [Google Scholar]
- Garcia-Bilbao A.; Armananzas R.; Ispizua Z.; Calvo B.; Alonso-Varona A.; Inza I.; Larranaga P.; Lopez-Vivanco G.; Suarez-Merino B.; Betanzos M. BMC Cancer 2012, 12, 43. [DOI] [PMC free article] [PubMed] [Google Scholar]
- Mizuarai S.; Irie H.; Kotani H. Curr. Mol. Med. 2010, 10, 596–607. [DOI] [PubMed] [Google Scholar]
- Stahlberg A.; Kubista M.; Aman P. Expert Rev. Mol. Diagn. 2011, 11, 735–740. [DOI] [PubMed] [Google Scholar]
- Sanchez-Freire V.; Ebert A. D.; Kalisky T.; Quake S. R.; Wu J. C. Nat. Protoc. 2012, 7, 829–838. [DOI] [PMC free article] [PubMed] [Google Scholar]
- Santa Lucia J. Jr. Methods Mol. Biol. 2007, 402, 3–34. [DOI] [PubMed] [Google Scholar]
- Reed J.; Hsueh C.; Lam M. L.; Kjolby R.; Sundstrom A.; Mishra B.; Gimzewski J. K. J. R. Soc. Interface 2012, 9, 2341–2350. [DOI] [PMC free article] [PubMed] [Google Scholar]
- Sundstrom A.; Cirrone S.; Paxia S.; Hsueh C.; Kjolby R.; Gimzewski J. K.; Reed J.; Mishra B. IEEE Trans. Inf. Technol. Biomed. 2012, 16, 1200–1207. [DOI] [PMC free article] [PubMed] [Google Scholar]
- Shlyakhtenko L. S.; Gall A. A.; Filonov A.; Cerovac Z.; Lushnikov A.; Lyubchenko Y. L. Ultramicroscopy 2003, 97, 279–287. [DOI] [PubMed] [Google Scholar]
- Kalyanasundaram D.; Kim J. H.; Fotouhi G.; Lee H. B.; Hiraiwa M.; Oh K.; Lee K. H.; Chung J. H. Analyst 2013, 138, 3135–3138. [DOI] [PubMed] [Google Scholar]
- Zheng L.; Brody J. P.; Burke P. J. Biosens. Bioelectron. 2004, 20, 606–619. [DOI] [PubMed] [Google Scholar]
- Yeo W. H.; Chung J. H.; Liu Y.; Lee K. H. J. Phys. Chem. B 2009, 113, 10849–10858. [DOI] [PubMed] [Google Scholar]
- Kalyanasundaram D.; Inoue S.; Kim J. H.; Lee H. B.; Kawabata Z.; Yeo W. H.; Cangelosi G. A.; Oh K.; Gao D.; Lee K. H.; Chung J. H. Microfluid. Nanofluid. 2012, 13, 217–225. [Google Scholar]
- Fang Y.; Spisz T. S.; Wiltshire T.; D’Costa N. P.; Bankman I. N.; Reeves R. H.; Hoh J. H. Anal. Chem. 1998, 70, 2123–2129. [DOI] [PubMed] [Google Scholar]
- Kodera N.; Yamamoto D.; Ishikawa R.; Ando T. Nature 2011, 468, 72–76. [DOI] [PubMed] [Google Scholar]
- Carberry D. M.; Picco L.; Dunton P. G.; Miles M. J. Nanotechnology 2009, 20, 434018. [DOI] [PubMed] [Google Scholar]
- Picco L. M.; Dunton P. G.; Ulcinas A.; Engledew D. J.; Hoshi O.; Ushiki T.; Miles M. J. Nanotechnology 2008, 19, 384018. [DOI] [PubMed] [Google Scholar]
- Hansma P. K.; Schitter G.; Fantner G. E.; Prater C. Science 2006, 314, 601–602. [DOI] [PubMed] [Google Scholar]
- Humphris A. D. L.; Miles M. J.; Hobbs J. K. Appl. Phys. Lett. 2005, 86, 043106. [Google Scholar]
Associated Data
This section collects any data citations, data availability statements, or supplementary materials included in this article.


