Abstract
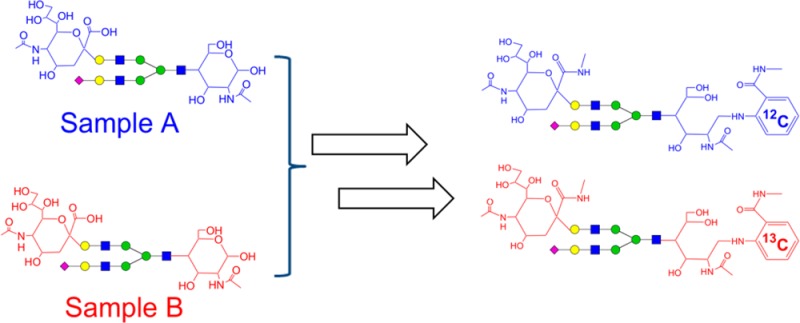
Differences in ionization efficiency among neutral and sialylated glycans prevent direct quantitative comparison by their respective mass spectrometric signals. To overcome this challenge, we developed an integrated chemical strategy, Dual Reactions for Analytical Glycomics (DRAG), to quantitatively compare neutral and sialylated glycans simultaneously by MALDI-MS. Initially, two glycan samples to be compared undergo reductive amination with 2-aminobenzoic acid and 2-13[C6]-aminobenzoic acid, respectively. The different isotope-incorporated glycans are then combined and subjected to the methylamidation of the sialic acid residues in one mixture, homogenizing the ionization responses for all neutral and sialylated glycans. By this approach, the expression change of relevant glycans between two samples is proportional to the ratios of doublet signals with a static 6 Da mass difference in MALDI-MS and the change in relative abundance of any glycan within samples can also be determined. The strategy was chemically validated using well-characterized N-glycans from bovine fetuin and IgG from human serum. By comparing the N-glycomes from a first morning (AM) versus an afternoon (PM) urine sample obtained from a single donor, we further demonstrated the ability of DRAG strategy to measure subtle quantitative differences in numerous urinary N-glycans.
Glycans are a group of carbohydrate side chains covalently linked to the asparagine residues (N-linked) and serine or threonine residues (O-linked) of proteins, which are involved in numerous biological functions such as cell–cell signaling and interactions, structural modulation of glycoproteins and pathogen-host recognition.1 Changes in glycosylation have long been known to be associated with a wide range of diseases, including the genetic congenital disorders of glycosylation (CDG) syndrome,2 diabetes,3 virus infection,4 and tumor progression.5 Furthermore, consistent glycosylation is a critical aspect of quality control in the production of therapeutic glycoproteins, because glycosylation significantly affects the overall efficiency, efficacy, and safety of therapeutic glycoproteins.6 Therefore, the development of a mass spectrometry (MS)-based strategy to measure quantitative changes of protein glycosylation is desired for academic, biotechnological, and pharmaceutical laboratories.
Several MS-based quantitative strategies exist utilizing common chemical modifications of glycans such as permethylation,7,8 reductive amination,9−12 and hydrazone formation.13 All of these strategies employ chemically similar but isotopically differentiated tags to derivatize glycan samples, so that they can be distinguished and quantitatively compared by MS.14 Most current strategies are effective in various ways, but each has deficiencies.
Permethylation is a classic strategy to modify nearly all functional groups within glycans,15 including hydroxyl groups, carboxylic acid groups, N-actylamide groups, and the hemiacetal group (often referred to as the reducing end). By coupling to the stable isotope-incorporated reagents,8,16 permethylation has been applied to measure the quantitative changes of relevant glycans from biological samples.14 However, two technical issues are often associated with this approach. First of all, the numbers of functional groups within an individual glycan are proportional to its size, resulting in variable mass differences between “light” and “heavy”-isotope-incorporated glycans. Given the remarkable heterogeneity of glycans from biological samples, the variable differences create the challenge to locate the pairs of relevant glycans from two respective samples. Second, the complete permethylation of all types of glycans from a biological sample is often problematic because different glycans may have different reaction efficiencies.13,15 Even though the side products can be minimized by the solid-phase protocol,7,8 they are impossible to fully avoid.13 In fact, these side products are often highly similar to real glycans; even a subsequent MS/MS fragmentation might present characteristic fragments of glycans.
The reductive amination and hydrazone formation only derivatize the reducing end within glycans. Bowman and Zaia have reported a set of tetraplex amination tags (+0, +4, +8, +12) to compare four respective samples in parallel.12 Other approaches using some commercially available reagents have also been reported.9−11 More recently, the labile hydrazone product was also employed to incorporate stable-isotopes into glycans,13 permitting direct LC-MS analysis without any postderivatization purification step. However, neither reductive amination nor hydrazone will affect the carboxylic acid groups within sialic acid residues, one of common monosaccharides in mammalian glycans,17 preventing the direct comparison of neutral and acidic glycans within one sample due to their dramatically different ionization efficiencies. Particularly with MALDI-MS, the nonderivatized sialic acid residues are often lost due to in- and postsource decay.18,19 Although the negative ion mode MS might be an alternative option for acidic glycans,20 it is impractical for a biological sample that often contains a vast number of neutral and acidic glycans with variable sialic acid residues.
An ideal MS-based quantitative strategy should not only measure the expression differences of an individual or a group of glycans between samples, but determine the relative abundances of them within samples. Herein we report an integrated chemical strategy, Dual Reactions for Analytical Glycomics (DRAG), to quantify both neutral and sialylated glycans simultaneously and comparatively. In this approach, the reducing end and the sialic acid residues are separately modified in two respective steps (Figure 1). The “light” and “heavy” isotope-incorporated tags, 2-AA and 2-13[C6]-AA, are incorporated into the glycans during the initial reductive amination step, and the sialic acid residues are converted into their methylamidated derivatives during the second step. Similar to other approaches, the expression difference of the same glycan between samples can be deduced from their MS signals.14 In addition, because all sialylated glycans are neutralized, DRAG permits simultaneous quantification of neutral and sialylated glycans within one sample, enabling the determination of the relative distribution of each glycan within a single sample.
Figure 1.
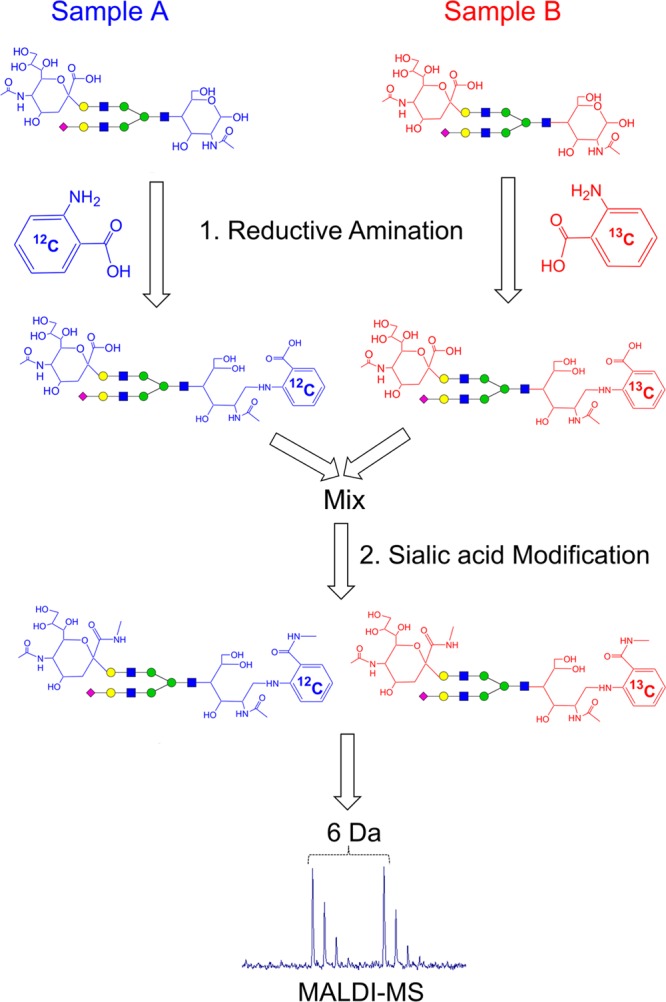
Workflow of the Dual Reactions for Analytical Glycome (DRAG). The released N-glycans from two respective samples are initially aminated with the pair of 2-AA and 2-13[C6]-AA, respectively. The aminated glycans are then mixed together and subjected to the methylamidation of sialic acid residues. After the dual reactions, all glycans are converted to neutral molecules, minimizing the drastic ionization differences often existing among neutral and nonmodified sialylated glycans. This permitted the quantitative analysis of both neutral and acidic glycans simultaneously by positive ion MS. The relative change of a glycan’s abundance between two samples can be readily measured from the corresponding MS doublet signals with a 6 Da mass difference.
Experimental Section
Chemicals and Materials
Human IgG from serum, bovine fetuin, 2-aminobenzamide (2-AB), 2-aminobenzoic acid (2-AA), 2-13[C6]-aminobenzoic acid, iodoacetamide, dithiothreitol, dimethyl sulfoxide (DMSO), methylamine hydrochloride, (7-azabenzotriazol-1-yloxy)trispyrrolidinophosphonium hexafluorophosphate (PyAOP), 4-methylmorpholine, sodium hydroxide, cellulose (medium fibrous), iodomethane, and 2,5-dihydroxybenzoic acid (DHB) were purchased from Sigma (St. Louis, MO). N-Glycosidase F (PNGase F) was obtained from New England Biolabs (Ipswich, MA). The Viva Spin series of spin filters (10K and 30K MWCO) were purchased from Sartorius Stedium Biotech (Aubagne, France).
Human Urine Specimens
Human urine specimens were obtained from one male healthy donor under an institutional review board-approved protocol. Two urine samples were collected, one in the morning as the first morning void (AM) and one in the afternoon (PM) of the same day. Urine samples were initially passed through a 0.22 μm PVDF syringe filter (Fisher Scientific, Pittsburgh, PA) to remove particles and cell debris, further concentrated by a VIVA SPIN filter (5K MWCO), and stored at −80 °C for later use. Protein concentrations were measured in triplicate by the Bradford assay.
N-Glycan Sample Preparation
All N-glycan samples were obtained according to the GlycoFilter protocol.21 Typically, 100–150 μg of glycoprotein samples was de-N-glycosylated by PNGase F in a single filter device via domestic microwave procedure.22 The released N-glycans were eluted into the collecting chamber of the filter by repeated centrifugation. All the flow-through fractions were combined and dried completely. Without further purification, the dried glycans underwent subsequent derivatization.
Derivatization with 2-AB
The glycans were derivatized with 2-AB using a DMSO/acetic acid procedure.10 The derivatized glycans were purified by a hand-packed cellulose cartridge in an organic solution (1-butanol/ethanol/water, 4:1:1, v/v/v).23 The reaction mixtures were diluted with 1 mL of the organic solution, and applied to the cartridge. After washing the cartridge with 3 mL of organic solution, the derivatized glycans were eluted with 2 mL of an aqueous solution (ethanol/water, 1:1, v/v) and dried completely in a speed vacuum.
Derivatization with 2-AA or 2-13[C6]-AA
The glycans were derivatized with 2-AA (or 2-13[C6]-AA) using a methanol-based condition.24 After reactions, the respective 2-AA and 2-13[C6]-AA derivatized samples were pooled and subjected to the cellulose-cartridge purification as described as above.
Methylamidation of Sialic Acid Residues
The 2-AA or 2-AB derivatized glycan samples were further methylamidated according to a previous report.25,36 Briefly, the dried glycan samples were dissolved in 10 μL of DMSO solution containing 5 M methylamine hydrochloride, followed by the addition of 10 μL of PyAOP (250 mM in 30% 4-methylmorpholine/DMSO). The reaction proceeded at room temperature with constant shaking for 45 min. The final products were purified by a second cellulose cartridge. It is also noteworthy that fresh and anhydrous reagents should be used for this reaction because the presence of trace amount of water may significantly affect the efficiency of this modification.
Permethylation of Glycans
Glycans were permethylated according to the solid phase protocol.8
Analyzing Glycans by MALDI-MS
MALDI-MS was carried out on a MDS SCIEX 4800 (Applied Biosystems, Carlsbad, CA) equipped with an Nd:YAG laser with 355 nm wavelength of <500 ps pulse and 200 Hz repetition rate. The spectrometer was operated in the positive ion reflectron mode. External calibration was performed using the ProteoMass Peptide MALDI-MS calibration kit (Sigma-Aldrich, St. Louis, MO). The matrix solution was prepared by dissolving 10 mg of DHB in a volume of 1 mL of 50% acetonitrile containing 8 mM sodium acetate. Glycans were spotted directly onto a stainless steel MALDI plate and mixed with an equal volume of matrix solution (0.5–1 μL) until air-dry. The MS data were initially processed and exported using Data Explorer 4.9 (Applied Biosystems, Carlsbad, CA).
Automated Analysis of MALDI-MS Quantitative Spectra
To facilitate the quantitative analysis, an R-language pipeline for postprocessing and quantifying MALDI-MS data was developed in house. In brief, the R-pipeline reads in spectral data from the Data Explorer 4.9 output, and performs regional baseline removal and peak picking using modules from MALDIquant Bioconductor R package, version 1.526 plus custom modules. The detected peak centers, combined with the expected masses of all possible urinary glycans from a previous report,21 were mined for any peak cluster patterns that correspond to a “light” cluster for one glycan and the associated “heavy” cluster of the same glycan from a different sample, separated by a static 6 Da mass difference. When at least three isotopic peak pairs 6 Da apart were identified within a 12 Da peak window, a related glycan doublet was declared and manually checked. The defined peak clusters were then quantified and compared using either peak height (intensity) or peak area (trapezoidal rule) as outlined in the Results and Discussion.
Results and Discussion
Selection of Dual Reactions
In theory, all reductive amination reagents can be applied to derivatize the reducing end of a glycan, even including the synthetic hydrazine reagent.13 2-AA was selected as the best option because of several practical considerations (Figure 1): (1) the conditions to completely modify glycans with 2-AA have been well established;24 (2) its stable-isotopic analogues are commercial available; in fact, 2-13[C6]-AA and 2-13[C7]-AA have already been applied for the quantitative glycomic comparison of different samples;10,11 and (3) 2-AA is a sensitive fluorescent reagent, enabling subsequent separation and detection by liquid chromatography if needed.27
The neutralization of sialic acid residues has been performed by various chemical methods including permethylation,7 methyl esterification,18 lactone formation,28 perbenzoylation,29 and amidation.30 To be compatible for a quantitative strategy, the ideal modification should derivatize all sialic acid residues completely without any side products. In N-glycans, there are two types of sialic acid to Gal linkages (α2,3 and α2,6), and it was well-known that the α2,3-linkage favors the formation of a lactone between sialic acid and Gal residues by the loss of a molecule of H2O.28 However, recent reports have demonstrated that both linkages could be activated by PyAOP and quantitatively converted into the methylamidated derivatives under very mild conditions.25,36 Furthermore, the product of methylamidation of carboxylic acid (Figure 1) was much more stable as compared to other types of modifications such as methyl ester or lactone. Therefore, the PyAOP activated methylamidation was chosen for the DRAG strategy (Figure 1).
After DRAG, all sialylated glycans were converted into neutral molecules that can be readily analyzed by positive mode MS. In this proof-of-concept report, MALDI-MS was chosen due to its simple procedure, strong tolerance to impurities, and single sodium-adduct ion species for each glycan, which simplifies the quantitative comparison.19
Validating the Chemical Feasibility of the DRAG Strategy
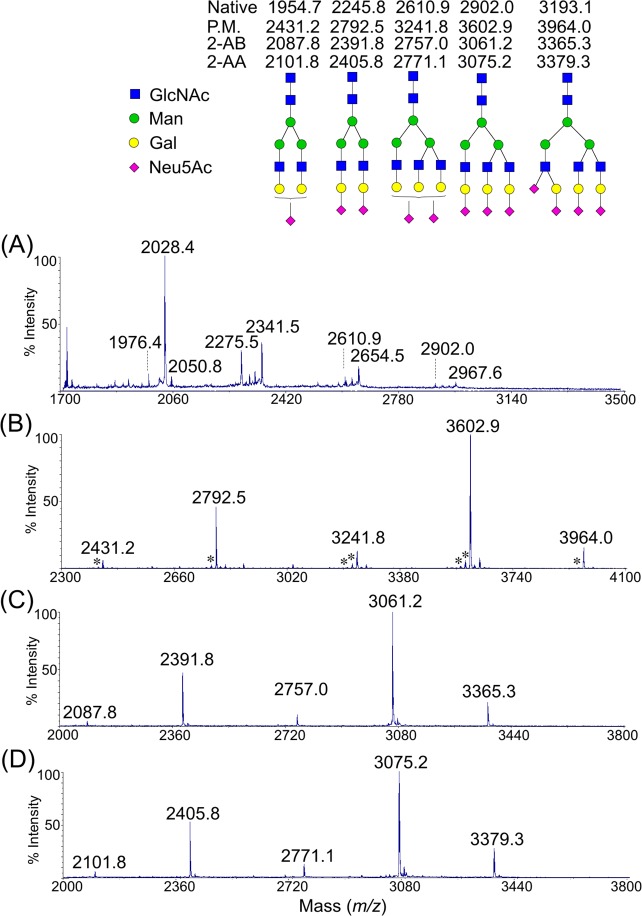
The feasibility of DRAG was validated using the N-glycans released from a well-studied glycoprotein, bovine fetuin, that carries a series of multiantennary glycans with sialic acid residues.31 Three aliquots of fetuin N-glycans were derivatized, in parallel, by permethylation (Figure 2B), reductive amination with 2-AB and neutralization (Figure 2C), and reductive amination with 2-AA and neutralization (Figure 2D). The nonderivatized glycans were also profiled by (+) MALDI-MS (Figure 2A). As expected, the profile of nonderivatized glycans was dominated by many side products (m/z 2028.4, 2275.5, 2341.5, 2654.5, and 2967.6) due to possible in- and postsource side reactions.20,21 Two molecular ions were observed with near baseline signals (m/z 2610.9 and 2902.0). Further indicating that positive mode of MALDI-MS was not sensitive to detect non-modified sialic acid residue. Permethylation stabilized the sialic acid residues and homogenized the ionization efficiency among glycans with different sialic acid residues (Figure 2B). Although the possible in- and postsource side products were minimized, the permethylation brought in unwanted others such as under-permethylated and oxidized side products ([M-nX14] + and [M-nX16]+, n = integral). Both DRAG approaches provided much cleaner spectra without any evident side products by MALDI-MS (Figures 2C,D), and all the peaks were the expected products of corresponding sialylated glycans, indicating that both modifications were processed. Interestingly, the same glycans aminated by the respective 2-AB and 2-AA had a 14 Da mass difference in the products, suggesting that the endogenous carboxylic acid group of 2-AA was also derivatized with methylamide. To evaluate the reproducibility of the DRAG strategy, additional replicates were undertaken on fetuin N-glycans (Supporting Information, Figure S1). As expected, the standard deviations from the permethylation were much wider than those from DRAG, presumably caused by side reactions associated the permethylation reaction. The slight differences on the relative abundance of the same glycan between the permethylation and DRAG strategies may reflect slight difference in ionization efficiencies between two approaches, and may also relate to the side reactions with the permethylation reaction. This experiment demonstrated that it was feasible to perform DRAG on sialylated glycans and to homogenize the ionization efficiency with variable numbers of sialic acid residues.
Figure 2.
Feasibility of DRAG strategy was chemically validated using modular N-glycans released from bovine fetuin. The (+) MALDI-MS spectra were obtained from the nonderivatized (A), and the permethylated (B), the aminated with 2-AB followed by methylamidation (C), and the aminated with 2-AA followed by methylamidation (D). Most peaks in the nonderivatized profile (A) were side products due to possible in and postsource reactions, which could not be fully explained. The evident side products ([M-nX14] + and [M-nX16]+, n = integral) of the permethylation reaction were annotated as (*). All peaks were single sodium adducts.
Comparative Testing on Standard N-Glycans
To demonstrate the quantitative capability of DRAG, a pair of “light” and “heavy” 2-AA reagents was used to derivatize N-glycans in parallel. The N-glycans from serum IgG was tested for this purpose because they have been well characterized and primarily consist of complex-type neutral glycans with a small amount of sialylated glycans.32,33 The evaluation on IgG N-glycans also determined whether there was any potential artificial effect on neutral glycans that do not carry any sialic acid residues.
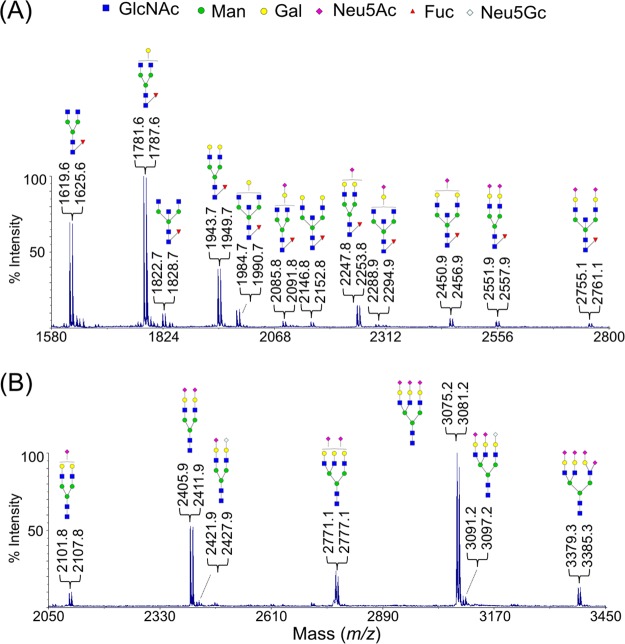
Two equivalent aliquots were reacted separately with 2-12[C6]-AA and 2-13[C6]-AA and followed by the neutralization in a mixture. As shown in Figure 3A, a total of 12 pairs of N-glycan compositions were detected, in which six of them contained one or two sialic acid residues in the high mass region (2000–2800 Da). Similar to its permethylated profile,22 the spectrum obtained from the DRAG strategy was dominated by the common IgG-type compositions: G0F (m/z: 1619.6 vs 1625.6), G1F (m/z: 1781.6 vs 1787.6), and G2F (m/z: 1943.7 vs 1949.7),32 suggesting that the ionization responses of neutral glycans were less likely to be altered by the methylamidated sialoglycans. The same approach was further tested on the equal molar mixtures of fetuin N-glycans (Figure 3B), yielding the expected pairs of 6 Da-separated doublet signals (m/z: 2101.8 vs 2107.8; 2405.9 vs 2411.9; 2771.1 vs 2777.1; 3075.2 vs 3081.2; and 3379.3 vs 3385.3).
Figure 3.
MALDI-MS spectra of N-glycans from human serum IgG (A) and from bovine fetuin (B) after processed by the DRAG strategy with a predetermined ratio at 1:1.The most plausible structure for each individual composition was shown according to previous reports; no further effort has been carried out to fully examine the structural details. All peaks were single sodium adducts.
Dynamic Range of Comparative Quantification
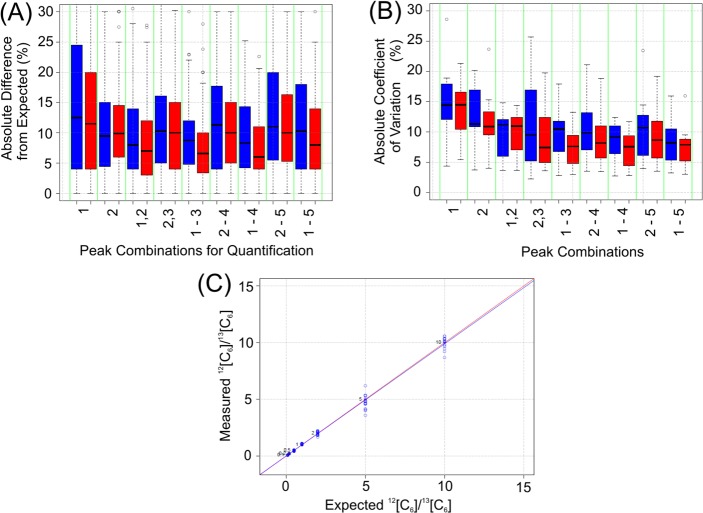
Previous reports have demonstrated that the stable isotope-incorporated strategies had a 10-fold dynamic range for relative comparison when analyzed by MALDI-MS.9,11 Accordingly, the proper aliquots of fetuin N-glycans were obtained and separately derivatized with either 2-AA or 2-13[C6]-AA. After the reaction, the aminated aliquots were mixed in a series of predetermined ratios (10:1, 5:1, 2:1, 1:1, 1:2, 1:5, and 1:10) with triplicates, followed by methylamidation. Although both areas and heights of the monoisotopic peaks yielded similar ratios when the expected ratios were close to 1:1, significant deviations were found for larger ratios such as 10:1 and 1:10 (Figure 4A), suggesting the low abundant species of a large ratio were more likely to be severely affected by MS instrument (for instance, the raised background or local noise). To find the best quantitation parameters for the pipeline, we systematically investigated a series of isotopic peak combinations (either peak area or height) of three abundant pairs of sialylated glycans (m/z: 2405.9 vs 2411.9, 3075.2 vs 3081.2, and 3379.3 vs 3385.3, Figure 3B) from all spectra. As shown in Figure 4A, the monoisotopic peak alone (peak 1) generated the widest deviations to the expected ratio for both peak area (blue bar) and peak height (red bar). After evaluating several approaches, it was determined that the summing of multiple isotopic peaks, and the use of peak height rather than area, was the most effective strategy to minimize these variations and to maximize ratio accuracy, such as the peak height combination of 1–3 or 1–4 (Figure 4A). The combination of multiple isotopic peaks also improved precision, as measured by lower CVs (coefficient of variation; Figure 4B). Therefore, the height combination of peaks 1–3 was chosen as the signals for the quantitative calculation, rather than a single monoisotopic peak as previous approaches.9 As shown in Figure 4C, the calculated standard curve from three pairs of sialylated glycans had a nearly linear relationship (R2 = 0.9893) over the full range (10:1 to 1:10) by the height combination of peaks 1–3, indicating that the DRAG strategy had a similar 10-fold dynamic range, comparable to other single-modification strategies while analyzed by MALDI-MS.9,11
Figure 4.
Selection of best MS signals for the quantification. All the MS signals were obtained from the MALDI-MS spectra of three pairs of fetuin N-glycans (m/z: 2405.9 vs 2411.9, 3075.2 vs 3081.2, and 3379.3 vs 3385.3, Figure 3B) with a series of premixed ratios (10:1, 5:1, 2:1, 1:1, 1:2, 1:5, and 1:10). The % absolute difference from expected ratios (A) and the absolute coefficient of variation (CV) among all measurements (B) were shown as boxplot diagrams, employing the different combinations of various isotopic peaks (peak area, blue; and peak height, red). The height combination of first three peaks (1–3) was chosen as the best MS signals for the quantification calculation. This combination yielded the standard curve plot (C), including all three pairs of sialylated glycans (blue trend line), showing a nearly exact fit to the theoretical trend line (red) in a range from (10:1 to 1:10) when analyzed by MALDI-MS.
Quantitative Comparison of Two Urinary N-Glycomes
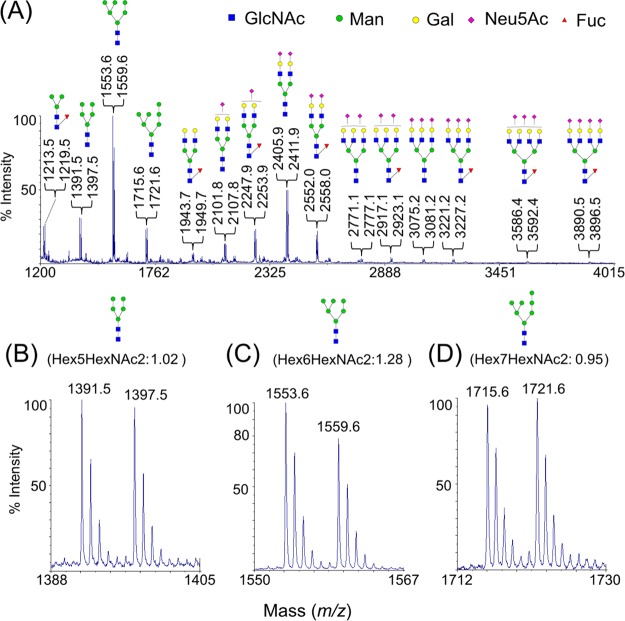
To further test this strategy on complex biological samples, two urine specimens were obtained from a single adult donor. One specimen was collected in the early morning (i.e., AM) and the other in the late afternoon (i.e., PM). In both AM and PM samples, N-glycans were released from the same amount of urinary protein, and processed by the DRAG approach with 2-12[C6]-AA (AM) and 2-13[C6]-AA (PM), respectively. As shown in Figure 5A, a highly heterogeneous profile was obtained, ranging from a small fucosylated core structure (m/z: 1213.5 vs 1219.5) to large complex-type N-glycan with four sialic acid residues (m/z: 3890.5 vs 3896.5). A total of 34 pairs of N-glycan compositions were identified based on their m/z values and the plausible biosynthetic pathway (Supporting Information, Table S1). Using the summed heights of peaks 1–3, both urinary N-glycomes appear quantitatively similar to each other because almost one-third of the ratios were close to 1 (from 0.9 to 1.1, Supporting Information, Table S1). However, subtle differences were detected in these two-related urine specimens. For instance, among the three most abundant high-mannose type glycans, the ratios for Hex5HexNAc2 (1.02, Figure 5B) and Hex7HexNAc2 (0.95, Figure 5D) were nearly 1. However, the ratio for Hex6HexNAc2 was as large as 1.28 (Figure 5C), suggesting that Hex6HexNAc2 might be produced much less in the PM. In contrast to high-mannose type glycans, the ratios for the two most abundant sialylated glycans, Hex5HexNAc4SA2 and Hex5HexNAc4SA2Fuc, were both smaller than 1 (Supporting Information, Table S1), suggesting that those sialylated glycans might be produced slightly more in the PM urine.
Figure 5.
Quantitative comparison of two urinary N-glycomes (AM vs PM). Both N-glycomes were labeled with 2-AA (AM) and 2-13[C6]-AA (PM), respectively, and measured by MALDI-MS (A). Three zoom-in spectra of three high-mannose type compositions: Hex5HexNAc2 (Man-5, B), Hex6HexNAc2 (Man-6, C), and Hex7HexNAc2 (Man-7, D). All quantitative ratios were calculated using the sums of the first three peak heights (Supporting Information, Table S1). All peaks were single sodium adducts.
Furthermore, it was also feasible to calculate the relative distribution of an individual glycan within the same sample, if the subtle ionization differences were not considered between hydroxyl group and methylamidated carboxylic acid group. Employing this concept, the sample-specific relative distribution of each glycan was obtained (Supporting Information, Table S1). According to these ratios, it further indicated that both urinary N-glycomes were highly similar to each other because the majority of glycans had the same kind of sample-specific relative distribution. For instance, Hex6HexNAc2 (Man-6) was still the most abundant composition in both samples (29.00% of AM vs 22.69% of PM, Figure 5C); even the absolute amount of Man-6 appeared less in PM urine. Whereas for the three most abundant sialylated glycans, Hex5HexNAc4Neu5AcFuc, Hex5HexNAc4Neu5Ac2, and Hex5HexNAc4Neu5Ac2Fuc, there were slight increases of sample-specific relative distribution along with three comparative ratios less than 1, implying more expression of sialylated glycans in PM urine sample. To our surprise, the summed MS signals of all detected glycans were nearly identical between AM and PM samples (the last row, Supporting Information, Table S1), suggesting the absolute amount of N-glycans in urines from morning to afternoon was relatively stable. In order to evaluate the reproducibility of the measurements, two additional replicates were identically processed for the same pair of urinary specimens (Supporting Information, Table S2). The relative ratios from these replicates were near identical with a relative standard deviation of less than 5%.
Based on this proof-of principle experiment by MALDI-MS, we are currently performing a large-scale comparative quantitative glycomics experiment utilizing DRAG to identify glycan specific differences in the urinary glycome for various diseases. DRAG allows both the comparison of absolute expression change of each individual glycan between two samples, but also the change in sample-specific relative abundances.
Since an individual composition may contain numerous isomers which differ in branching pattern, inter-residue linkage, or even anomeric configuration (α or β),34,35 it was not clear whether the quantitative changes of one composition between AM and PM urines were caused by one or several structural isomers. Certainly, the quantitative comparison on the compositional level may be practical for an initial screen because it often takes significant effort to characterize full structural details of a single glycan.10,35 Those compositions with distinguished quantitative ratios might provide the best candidates for further validation, a critical step in the discovery of glycan-based biomarkers.
Conclusion
In this proof of principle report, we described DRAG, an integrated strategy to modify the reducing end and the sialic acid residues of a glycan sequentially. The modification chemistries were carefully chosen to avoid potential side reactions and also to minimize the ionization efficiency differences between the modified sialic acid residues and other monosaccharides within glycans. After the dual modifications, all glycans had been shifted to neutral molecules, permitting a quantitative analysis of both types of glycans simultaneously. As this work has demonstrated, if two samples are separately aminated with different stable isotope-incorporated reagents, the absolute changes of an individual glycan between samples can be obtained by distinguished doublet peaks with 6 Da mass differences in MALDI-MS. The feasibility has also been demonstrated to track the changes in sample-specific relative abundance of an individual glycan, a concept often employed by the permethylation strategy. Considering these valuable benefits, the DRAG strategy provides a unique approach to perform quantitative comparisons on the N-glycome, with demonstrated improvements over existing methods.
Acknowledgments
U.S. National Institutes of Health Grants DK077836 (R.S.L.) and DK077836S1 (R.S.L.) supported this work. We thank Drs. Judith Steen and Hanno Steen for their assistance on this project and Mr. Andrew Briscoe and Mr. Nino Esile for their technical assistance. We also thank the Department of Urology, Boston Children’s Hospital, for their continued support.
Supporting Information Available
Additional information as noted in the text. This material is available free of charge via the Internet at http://pubs.acs.org.
The authors declare no competing financial interest.
Funding Statement
National Institutes of Health, United States
Supplementary Material
References
- Varki A.; Sharon N. In Essentials of Glycobiology; Varki A., Cummings R. D., Esko J. D., Freeze H. H., Stanley P., Bertozzi C. R., Hart G. W., Etzler M. E., Eds.; Cold Spring Harbor: NY, 2009. [PubMed] [Google Scholar]; Marino K.; Bones J.; Kattla J. J.; Rudd P. M. Nat. Chem. Biol. 2010, 6, 713–23. [DOI] [PubMed] [Google Scholar]
- Freeze H. H. Curr. Mol. Med. 2007, 7, 389–96. [DOI] [PubMed] [Google Scholar]
- Lee C. L.; Chiu P. C.; Pang P. C.; Chu I. K.; Lee K. F.; Koistinen R.; Koistinen H.; Seppala M.; Morris H. R.; Tissot B.; Panico M.; Dell A.; Yeung W. S. Diabetes 2011, 60, 909–17. [DOI] [PMC free article] [PubMed] [Google Scholar]
- Russell C. A.; Fonville J. M.; Brown A. E.; Burke D. F.; Smith D. L.; James S. L.; Herfst S.; van Boheemen S.; Linster M.; Schrauwen E. J.; Katzelnick L.; Mosterin A.; Kuiken T.; Maher E.; Neumann G.; Osterhaus A. D.; Kawaoka Y.; Fouchier R. A.; Smith D. J. Science 2012, 336, 1541–7. [DOI] [PMC free article] [PubMed] [Google Scholar]
- Mechref Y.; Hu Y.; Garcia A.; Hussein A. Electrophoresis 2012, 33, 1755–67. [DOI] [PMC free article] [PubMed] [Google Scholar]
- Walsh G.; Jefferis R. Nat. Biotechnol. 2006, 24, 1241–52. [DOI] [PubMed] [Google Scholar]
- Kang P.; Mechref Y.; Klouckova I.; Novotny M. V. Rapid Commun. Mass Spectrom. 2005, 19, 3421–8. [DOI] [PMC free article] [PubMed] [Google Scholar]
- Kang P.; Mechref Y.; Kyselova Z.; Goetz J. A.; Novotny M. V. Anal. Chem. 2007, 79, 6064–73. [DOI] [PubMed] [Google Scholar]
- Xia B.; Feasley C. L.; Sachdev G. P.; Smith D. F.; Cummings R. D. Anal. Biochem. 2009, 387, 162–70. [DOI] [PMC free article] [PubMed] [Google Scholar]
- Prien J. M.; Prater B. D.; Qin Q.; Cockrill S. L. Anal. Chem. 2010, 82, 1498–508. [DOI] [PubMed] [Google Scholar]
- Tep S.; Hincapie M.; Hancock W. S. Anal. Bioanal. Chem. 2012, 402, 2687–700. [DOI] [PubMed] [Google Scholar]
- Bowman M. J.; Zaia J. Anal. Chem. 2010, 82, 3023–31. [DOI] [PMC free article] [PubMed] [Google Scholar]
- Walker S. H.; Budhathoki-Uprety J.; Novak B. M.; Muddiman D. C. Anal. Chem. 2011, 83, 6738–45. [DOI] [PMC free article] [PubMed] [Google Scholar]
- Mechref Y.; Hu Y.; Desantos-Garcia J. L.; Hussein A.; Tang H. Mol. Cell Proteomics 2013, 12, 874–84. [DOI] [PMC free article] [PubMed] [Google Scholar]
- Ciucanu I.; Costello C. E. J. Am. Chem. Soc. 2003, 125, 16213–9. [DOI] [PubMed] [Google Scholar]
- Alvarez-Manilla G.; Warren N. L.; Abney T.; Atwood J. 3rd; Azadi P.; York W. S.; Pierce M.; Orlando R. Glycobiology 2007, 17, 677–87. [DOI] [PubMed] [Google Scholar]
- Varki A.; Schauer R. In Essentials of Glycobiology; Varki A., Cummings R. D., Esko J. D., Freeze H. H., Stanley P., Bertozzi C. R., Hart G. W., Etzler M. E., Eds.; Cold Spring Harbor: NY, 2009. [PubMed] [Google Scholar]
- Powell A. K.; Harvey D. J. Rapid Commun. Mass Spectrom. 1996, 10, 1027–32. [DOI] [PubMed] [Google Scholar]
- Harvey D. J. Mass Spectrom Rev. 1999, 18, 349–450. [DOI] [PubMed] [Google Scholar]; Harvey D. J. Mass Spectrom Rev. 2009, 28, 273–361. [DOI] [PMC free article] [PubMed] [Google Scholar]
- Wheeler S. F.; Harvey D. J. Anal. Chem. 2000, 72, 5027–39. [DOI] [PubMed] [Google Scholar]
- Zhou H.; Froehlich J. W.; Briscoe A. C.; Lee R. S. Mol. Cell Proteomics 2013, 12, 2981–91. [DOI] [PMC free article] [PubMed] [Google Scholar]
- Zhou H.; Briscoe A. C.; Froehlich J. W.; Lee R. S. Anal. Biochem. 2012, 427, 33–5. [DOI] [PMC free article] [PubMed] [Google Scholar]
- Shimizu Y.; Nakata M.; Kuroda Y.; Tsutsumi F.; Kojima N.; Mizuochi T. Carbohydr. Res. 2001, 332, 381–8. [DOI] [PubMed] [Google Scholar]
- Anumula K. R.; Dhume S. T. Glycobiology 1998, 8, 685–94. [DOI] [PubMed] [Google Scholar]
- Liu X.; Qiu H.; Lee R. K.; Chen W.; Li J. Anal. Chem. 2010, 82, 8300–6. [DOI] [PubMed] [Google Scholar]
- Gibb S.; Strimmer K. Bioinformatics 2012, 28, 2270–1. [DOI] [PubMed] [Google Scholar]
- Ruhaak L. R.; Zauner G.; Huhn C.; Bruggink C.; Deelder A. M.; Wuhrer M. Anal. Bioanal. Chem. 2010, 397, 3457–81. [DOI] [PMC free article] [PubMed] [Google Scholar]
- Wheeler S. F.; Domann P.; Harvey D. J. Rapid Commun. Mass Spectrom. 2009, 23, 303–12. [DOI] [PubMed] [Google Scholar]
- Chen P.; Werner-Zwanziger U.; Wiesler D.; Pagel M.; Novotny M. V. Anal. Chem. 1999, 71, 4969–73. [DOI] [PubMed] [Google Scholar]
- Sekiya S.; Wada Y.; Tanaka K. Anal. Chem. 2005, 77, 4962–8. [DOI] [PubMed] [Google Scholar]
- Berman E.; Walters D. E.; Allerhand A. J. Biol. Chem. 1981, 256, 3853–7. [PubMed] [Google Scholar]
- Huhn C.; Selman M. H.; Ruhaak L. R.; Deelder A. M.; Wuhrer M. Proteomics 2009, 9, 882–913. [DOI] [PubMed] [Google Scholar]
- Scherer H. U.; Wang J.; Toes R. E.; van der Woude D.; Koeleman C. A.; de Boer A. R.; Huizinga T. W.; Deelder A. M.; Wuhrer M. Proteomics Clin. Appl. 2009, 3, 106–15. [DOI] [PubMed] [Google Scholar]
- Ashline D.; Singh S.; Hanneman A.; Reinhold V. Anal. Chem. 2005, 77, 6250–62. [DOI] [PMC free article] [PubMed] [Google Scholar]
- Zhou H.; Hanneman A. J.; Chasteen N. D.; Reinhold V. N. J. Proteome Res. 2013, 12, 4547–55. [DOI] [PMC free article] [PubMed] [Google Scholar]
- Nishikaze T.; Kawabata S.-i.; Tanaka K. Anal. Chem. 2014, 86, 5360–69 10.1021/ac500340t. [DOI] [PubMed] [Google Scholar]
Associated Data
This section collects any data citations, data availability statements, or supplementary materials included in this article.


