

Summary
Recent evidence suggests that the hippocampus may integrate overlapping memories into relational representations, or schemas, that link indirectly related events and support flexible memory expression. Here we explored the nature of hippocampal neural population representations for multiple features of events and the locations and contexts in which they occurred. Hippocampal networks developed hierarchical organizations of associated elements of related but separately acquired memories within a context, and distinct organizations for memories where the contexts differentiated object-reward associations. These findings reveal neural mechanisms for the development and organization of relational representations.
Introduction
Recent research on the nature of memory representations in the hippocampus has emphasized a competition between pattern completion of a new experience to a previously stored representation versus pattern separation to an entirely novel representation in order to minimize interference between memory representations for similar events (Vazdarjanova and Guzowski, 2004; Deng et al., 2013; Colgin et al., 2010; Wills et al., 2005; Leutgeb et al., 2004; Lee et al., 2004; Bakker et al., 2008; Norman and O’Reilly, 2003; Hasselmo and Wyble, 1997). However, in direct contrast to this competitive mechanism that separates overlapping memories, an alternative view is that the hippocampus systematically organizes multiple overlapping memories to form relational networks, and these networks serve as knowledge structures, or schemas that rapidly assimilate additional related memories (Eichenbaum, 2004; McKenzie and Eichenbaum, 2011; van Kesteren et al., 2010; Tse et al., 2007; Shohamy and Wagner, 2008; Zeithamova et al., 2012). A large literature supports the role of the hippocampus in relational representation and schema development, including studies where intact but not hippocampal-damaged animals integrate overlapping memories (Dusek et al., 1997, Devito et al, 2010; Bunsey and Eichenbaum, 1996; Buckmaster et al., 2004; Tse et al., 2007), and complementary functional imaging studies in humans that have identified hippocampal activation associated with successful integration of related memories (Wimmer and Shohamy 2012; Kumaran et al., 2009,2012; Shohamy and Wagner 2008; Heckers et al., 2004; Greene et al., 2006; Zeithamova et al., 2010,2012; Poppenk et al., 2010; Preston et al., 2004; Van Kestren et al., 2010, 2012). Nevertheless, despite the established link between hippocampal function and relational representation and schema development, little is known about how neuronal populations in the hippocampus encode and organize related memories and whether and how pattern completion and separation mechanisms operate in these organizations.
Here we designed a task in which rats acquired memories that could be related in several ways including multiple features of events and where they occurred (Figure 1A). On each trial rats entered one of two distinct spatial contexts and were presented with two objects located in either of two positions. In Context 1, Object A was rewarded, and not Object B, whereas in Context 2, Object B was rewarded, not Object A. Thus the animals were required to use the spatial context to determine the appropriate object-reward associations. Previously, we have reported that single CA1 and CA3 neurons fire during stimulus sampling associated with multiple relevant stimulus dimensions, including object identity, location within a context, and context (Komorowski et al., 2009, 2013). Here we expanded the task to subsequently train the rats on an additional object set (C & D) within the same contexts. Following recent studies showing that high-dimensional neural representations in other brain areas can support complex cognitive functions (Ross et al., 2013; Rigotti et al., 2013), we employed a representational similarity analysis (Kriegeskorte et al., 2008) on simultaneously recorded hippocampal populations to reveal a hierarchical organization of distinct event and spatial features of the task, constituting the neural substrate of relational representation and schema structure.
Figure 1.

(A) Training protocol: Rats initially learn problem set XY, then in a new pairs of contexts, problem sets AB then CD. (B) While learning XY, trials to criteria in Context 0 was strongly correlated with that in Context 00. (C) Following initial XY learning, rats rapidly acquired AB and CD. (D) Performance across all nine days of training. Rats performed above chance on AB by the fifth trial block on the first day of training (Day 1: AB1). In contrast, rats performed above chance on CD on the second trial block on the first day in which those items were introduced (Day 4: CD1). There were 15 trials per block. Error bars are S.E.M.
Results
Rats acquire a schema for context-guided object-associations
To examine whether rats develop a capacity for rapid acquisition of new context-guided object-associations, we trained a group of non-implanted animals on three successive context-guided object-association problems (Figure 1A). On the initial problem (in Context 0 choose Item X; in Context 00 choose Item Y) rats performed better than chance (83% correct for 12 consecutive trials) in each context by 202 ± 23.8 trials over 7.0 ± 0.7 days (mean ± standard error). Learning curves for performance within each context were analyzed separately to determine the trial after which animals performed consistently above chance. The number of trials to criterion within each context was strongly correlated (r = 0.995, p < 0.0004, slope = 0.89; Figure 1B), suggesting that learning the opposing object-reward associations in the two contexts occurred around the same time.
Subsequently, rats were trained successively for three days on each of two object sets (AB and CD) within a new pair of contexts. With one exception, all rats reached the performance criterion for each set within a single day (trials to criterion 69.6 ± 13.1 for AB and 70.6 ± 3.8 for CD), and in significantly fewer trials than on the original set (mixed model repeated measures ANOVA F2,4 = 26.3, p = 0.003; post-hoc paired t-tests; XY vs AB t(4) = 4.8, p = 0.008; AB vs XY t(4) = 6.6, p = 0.002; AB vs CD t(4) = 0.08, p > 0.05; Figure 1C). These findings indicate that rats acquired a general schema for context-guided object-association by the completion of an initial problem, and could subsequently acquire new object sets rapidly. Notably, in the recording studies described below, implanted rats (n = 5) pre-trained on the initial XY problem also subsequently learned AB and CD within a single session and performance remained high throughout testing on intermixed AB and CD sets (ABCD; Figure 1D).
Hippocampal neurons encode multiple dimensions of item and spatial information
ANOVAs on firing rates of CA1 and CA3 neurons during object sampling on ABCD sessions identified firing patterns that differentiated item identities, item valence (rewarded or non-rewarded), co-occurrence of items within a set (AB or CD), position of item sampling within each context, and spatial context. These analyses focused on the activity of 571 isolated neurons (CA1: 292, CA3: 279) during stimulus sampling epochs (mean duration = 1.53 ± 0.59 SD sec). Based on a 4-way (valence, set, position, context) ANOVA for each neuron, the firing rates of 40.7% of the cells were influenced by context (CA1: 124, CA3: 109), 34.0% by position (CA1: 105, CA3: 90), 28.6% by valence (CA1: 84, CA3: 80), and 19.0% by set (CA1: 65, CA3: 43); and 13.5% of cells fired differentially depending on the interaction of valence and set, reflecting coding of item identity (CA1: 36, CA3: 39). These findings indicate that the firing patterns of individual neurons were modulated by multiple task dimensions and that equivalent proportions of CA1 and CA3 neurons were significantly influenced by each task dimension (Figure S1D). Therefore unless otherwise stated, we combined CA1 and CA3 cells to compose population firing rate vectors for each object sampling event.
Of the neurons whose activity was influenced by at least one variable, the firing rates of 79.7% neurons (n = 244/306) were also influenced by a combination of spatial (i.e. context and/or position) and object (i.e. set and/or valence) dimensions. For example, Figure 2A shows a neuron that fired at different rates during object sampling in the two contexts (greater activity in Context 2) and its firing rate was also influenced by item valence (greater activity for non-rewarded items in Position 4). Other neurons distinguished positions within a context (Figure 2B) with or without distinguishing rewarded from unrewarded objects (Figure 2C; position X valence interaction). Yet other neurons fired during object sampling at all positions, though at different rates for different items (Figure 2D; interaction of valence X set X position). A summary of the average firing rates for each item and place combination is shown in Figure 3A. Most cells fired at the highest rate during object sampling at one position, and had a preferred item and/or valence within that position. Very few cells fired at equally high rates during sampling of all four items in the preferred position. Thus, the activity of individual hippocampal neurons reflects a multi-dimensional association of the relevant object and spatial dimensions that characterized this task.
Figure 2.

Peri-event time histograms (PETHs) centered on the onset of item sampling of example cells for the four items presented within each position. Y-axis is the trial average firing rate (Hz; scale at upper left for each cell). Grey shading indicates the minimum sampling period. See also Figure S4 for histological confirmation of recording sites.
Figure 3.

(A) Firing rates for all cells during ABCD, sorted for CA3 and CA1 by condition that elicited maximal firing rate. Z-axis is the trial averaged z-normalized firing rate. X-axis sorts trial types by Context, Position, Valence, and Item. Strong item coding is reflected in different firing rates among items within a position. (B) Simultaneously recorded cell ensembles for seven trials within an example session. Each histogram is the population vector composed of z-scored (range −1.95 to 7.02 SD) firing rates during one trial identified by Context (Con), Position (Pos), Item (A,B,C,D) and reward valence (+,−). (C) An example correlation matrix from one session showing correlation coefficients by color code (right scale). (D) The mean correlation coefficients (+SEM) for within- and between-condition item sampling events for each task dimension (see Table 1). For all dimensions except set, the correlation coefficients are higher for within-condition trials than between. IVSPC as defined in Table 1. See Figure S2 for individual rat data. (E) A dendrogram showing that ensembles of the same valence in the same position are most similar, followed by ensembles associated with items of opposing valence within the same position. Positions within the same context were also coded more similarly than positions in the opposing context. See also Figures S1-S3.
Multi-dimensional representational similarity analysis
To measure the similarity of ensemble representations of different item sampling events, we calculated the average z-normalized firing rate for each neuron during all item sampling epochs, and constructed a population vector for every sampling event based on these normalized rates. Examples of activity patterns of a simultaneously recorded ensemble taken from one recording session are shown in Figure 3B. The overall ensemble pattern was similar for repetitions of sampling events with the same item in the same position (top two events). Ensemble patterns for events with different items of the same valence were partially overlapping; several new cells joined the ensemble while others dropped out (top vs third events). Ensemble patterns for events with different valence in the same position showed more divergent firing patterns (top vs fourth event), and the overlap in the ensemble pattern decreased further still for events in different positions and in different contexts (top vs fifth and sixth events, respectively).
We created similarity matrices to visualize the patterns of ensemble similarity across all types of item-sampling events for each recording session. Figure 3C shows an example similarity matrix from one session in which item sampling events have been sorted by four task dimensions: item, valence, position, and context; set is not included because, as will be presented below, this dimension is not encoded by hippocampal ensembles. The similarity matrix shows that correlations between hippocampal population vectors for different sampling events reflect the identified task dimensions. For example, in this similarity matrix, in the upper left corner ensemble patterns of Items A+ and C+ are strongly correlated, showing representational similarity of items that have the same valence in the same position. Along the left column, ensemble patterns for A+ and C+ are strongly correlated between Positions 1 and 2, showing similarity in representations of these items across positions in the same context. By contrast, looking further down the left column, ensemble patterns for A+ and C+ in Position 1 are inversely correlated with those of the items in Positions 3 and 4, showing anti-correlations in the alternate context.
To quantitatively compare the similarity of ensemble representations associated with these dimensions, population correlation coefficients were computed by combining the similarity matrices taken from each ABCD session of all subjects. We calculated mean population correlation coefficients for item, valence, and set dimensions within a position as well as across positions within a context, and for the combination of all comparisons across contexts (see Table 1 middle column for inclusion criteria). These analyses revealed modest but reliable correlation coefficients between population firing rate vectors between individual pairs of brief object sampling events (Figure 3D). For example, correlations between population firing rates during events with the same item in the same position had an average correlation coefficient of r = 0.25, but the standard error of the mean across rats (N =5) was only ± 0.02, indicating that the variability of population firing patterns is highly consistent between identical individual events (Figure S2). Next, using the pooled correlations from every session (3 per rat), we calculated a d’ metric to measure the separation of the distributions of the correlation coefficients from specific conditions (e.g., pairs of identical sampling events) versus zero or versus the distribution of coefficients from an appropriate opposing condition (pairs of sampling events for the same item in different positions within the same context; see Table 1). The d’ metric was compared against a bootstrapped data set to estimate the probability of the observed score against a random distribution. Despite the modest correlations, the observed correlation coefficients for each dimension were significantly different from zero (see Experimental Methods, p < 0.0001). We also performed this analysis on the data pooled over 3 sessions for each rat, and the pattern of findings on each subject are similar to those for the combined data described below (Figure S2D,E). Parametric comparison of the mean correlation coefficients using each rat as the unit of analysis also revealed the same overall pattern (Figure S2D).
Table 1.
The inclusion filters for the within and between conditions whose difference operationally defines each task dimension. Within condition comparisons were those in which the ensemble activity from two sampling events were matched in the dimension of interest (e.g. from the same position). Between-condition comparisons were ideally identical to within condition comparisons except for choosing two activity patterns recorded in conditions that differed only in the dimension of interest (e.g. from different positions). IVSPC is an acronym for each task dimension: Item (I), Valence (V), Set (S), Position (P), Context (C). Black lettering indicates that recordings were from events of the same condition for that dimension (e.g., all black text indicates repetition of the same item in the same positions). Red lettering indicates that recordings were taken from events between conditions for that dimension (e.g. a red ‘P’ indicates that ensembles were recorded during sampling events that occurred in different positions). Grey lettering indicates that recordings were taken from events both within and between conditions for that dimension.
| Task Dimension | Within condition | Between condition |
|---|---|---|
| Item within a position | IVSPC | IVSPC |
| Valence within a position | IVSPC | IVSPC |
| Set within a position | IVSPC | IVSPC |
| Item across positions | IVSPC | IVSPC |
| Valence across positions | IVSPC | IVSPC |
| Set across positions | IVSPC | IVSPC |
| Position | IVSPC | IVSPC |
| Context | IVSPC | IVSPC |
I = item V = valence S = set P = position C = context Black = same Red = different Gray = both
To measure the extent to which ensembles encoded each dimension, we compared the correlation coefficients within and between conditions of that dimension (for specific comparisons, see Table 1 middle versus right columns). Coding of item identity was measured by comparing ensemble correlation coefficients between population firing patterns during item sampling events with the same item in the same position to those with different items of the same valence at the same position (Figure 3D, Figure S2). Correlation coefficients for identical events (mean r = 0.25) were greater (mean r = 0.18; d’ = 0.23, p < 0.0001), providing strong evidence that hippocampal ensembles differentiate items at specific locations. To measure coding of reward valence we compared ensemble correlation coefficients among events that involved different items of the same valence to those that involved different items of different valences at the same position. The similarities of ensemble patterns for events involving different items with the same valence were greater (mean r = 0.08; d’ = 0.34, p < 0.0001), indicating strong evidence that hippocampal ensembles differentiate items by valence at each location. To measure coding of sets (AB and CD) we compared ensemble correlation coefficients among events that involved different items from the same set versus different items across sets at the same position. The similarities of ensemble patterns for events involving the item from the same and different sets were equivalent (within set mean r = 0.08; between set mean r = 0.08), indicating that hippocampal ensembles do not represent co-occurrence of items within sets (d’ = −0.02, p = 0.20) any greater than their differentiation of item identity and reward valence.
To measure ensemble coding of positions within a context, we compared the ensemble correlation coefficients of sampling events that occurred within the same position to the correlation coefficients of ensembles that occurred in different positions within the same context (Table 1, Figure 3D, Figure S2). Ensemble patterns for events occurring within the same position were more similar (within position mean r = 0.15) across positions (mean r = 0.02; d’ = 0.45, p < 0.0001), reflecting the well-known place code. However, the pattern of similarity across positions highly depended upon the items sampled in those positions. Pairwise comparisons of population correlation coefficients for sampling events with the same item in the two positions within a context showed the highest similarity (mean r = 0.09), as suggested by the observation that some cells fire in response to the same item presented in multiple locations (see Figure 2D; Wood et al., 1999). Activity recorded during events in which rats sampled the same item in different positions were more correlated than events in which rats sampled different items of the same valence (mean r = 0.03; d’ = 0.22, p < 0.0001), which in turn were more correlated than sampling events that differed both by item identity and by the valence of those items (mean r = −0.03; d’ = 0.25, p < 0.0001). Activity associated with items from the same set across positions were not more correlated than items from different sets across positions (d’ = −0.02, p = 0.15), again showing the lack of differentiation of items between sets. Combining these observations, item identity and valence were coded both within a position and across positions, results that strongly argue against a model in which non-spatial information is coded only by the firing rate within single spatial firing fields (Leutgeb et al., 2005).
Finally, hippocampal patterns were anti-correlated between the two contexts (between context mean r = −0.09, probability of the observed correlations less than zero < 0.0001; Figure 3D), and the ensemble correlations for events that occurred in different contexts were significantly lower than the correlation of ensembles recorded in different positions within the same context (Table 1; d’ = 0.39, p < 0.0001), indicating that contexts that define opposite item valence are associated with distinct patterns of neural activity.
This combination of results indicates a hierarchy of ensemble similarity during item sampling events. To illustrate this hierarchy, we constructed a dendrogram in which each item and position combination (n = 16) was associated with a population firing rate vector from neurons (n = 560) across all sessions and all rats. These population vectors were correlated and vectors that produced the largest correlations were grouped into clusters (see Experimental Methods). This analysis shows that the highest average similarity of ensemble patterns for item sampling events of the same valence in the same position, followed by events of opposite valence in the same position, followed by events in the other position within the same context, and finally, the anti-correlation for events that occurred in the alternate context where items had opposite reward contingencies (Figure 3E). There are a larger number of possible dendrograms (C15 = 9,694,845) and therefore the likelihood of observing this particular binary tree by chance is low.
We confirmed these results by estimating the probability that a pattern of ensemble firing rates was recorded in each of the 16 item in position combinations using a Bayesian decoding algorithm. The decoding algorithm generated the same hierarchy of ensemble similarity as the correlational techniques described above (Figure S3). Ensembles were most likely to have been recorded from the correct item and position combination (mean probability = 0.38) which was greater than the probability of the unit activity originating from trials with a different item of the same valence in the same position (mean probability = 0.18; d’ = 0.58, p < 0.0001). This significant difference in probability reflects the strong item coding. The next most likely origin of the recorded ensemble was from sampling events occurring in the same position though containing an item of opposing valence (mean probability = 0.05, d’ = 0.48, p < 0.0001). This significant difference in probability reflects the valence code. Ensembles were equally likely to originate from sampling events of the same set (mean probability = 0.05) as from samples of the other set (mean probability = 0.04), confirming the lack of a distinct code for item pairing (d’ = 0.08, p = 0.15). The position code was reflected by the higher probability that ensemble activity was recorded in the correct position (mean probability = 0.20) than the probability of being recorded in the incorrect position within the correct context (mean probability = 0.06; d’ = 1.24, p < 0.0001). Finally, ensembles were least likely to have been recorded in the opposing context (mean probability = 0.02), with a mean probability of decoding to the wrong context lower than decoding to the wrong position within the same context (d’ = 0.38, p < 0.0001) and lower than decoding to the opposing context by chance (p = 0.0013).
Based on these results we conclude that item identities, their reward valences, and the locations where items appear within a context are encoded by hippocampal ensembles during item sampling. Notably, the co-occurrence of items within a set is not encoded by hippocampal ensembles in the current task. Finally, hippocampal ensembles strongly separate representations of events in different contexts, suggesting opposing schemas are created for events in contexts that are meaningfully distinct.
Both CA1 and CA3 encode item and spatial dimensions
Different functions have been ascribed to areas CA1 and CA3 (Farovik et al., 2009; Hoge and Kesner, 2007; Lee et al., 2004; Leutgeb et al., 2004; Hasselmo and Wyble, 1997; Alvernhe et al., 2008; Dupret et al., 2010; Rolls et al., 2013) and therefore we tested whether these two hippocampal regions differentially coded each of the task dimensions. Population firing rate vectors were computed separately for simultaneously recorded CA1 and CA3 ensembles (Figure S4) and the correlational analyses described in the previous section were repeated for these region specific ensembles (Figure S1A-C).
In both regions, when analyses were limited to item sampling events that occurred within the same position, events in which the item identity were matched were better correlated (CA1: r = 0.23, CA3: r = 0.34) than events in which different items of the same reward valence were presented (CA1: r = 0.15, d’ = 0.23; CA3: r = 0.29, d’ = 0.11; p < 0.0001 for both regions). Changing both item identity and reward valence caused further decreases in ensemble correlation coefficients in both regions (CA1: r = 0.09, d’ = 0.19; CA3: r = 0.21, d’ = 0.19; p < 0.0001 for both regions). Therefore firing rates of cells in areas CA1 and CA3 are influenced by item identity and reward valence of items that occupy a single position.
Comparisons of firing rates recorded within the same positions revealed that area CA3 but not CA1 showed higher population correlation coefficients for events containing items of the same set (CA1: r = 0.09, CA3: r = 0.22) than for items of separate sets (CA1: r = 0.08, d’ = 0.03, p = 0.24; CA3: r = 0.20, d’ = 0.04, p = 0.002). This difference between regions was observed when comparing two distributions of correlation coefficients (same set versus different set) composed of observations pooled across rats. Significance testing for each rat revealed set coding in only a single subject (d’ = 0.10, p < 0.001), suggesting that any item set code in area CA3 is secondary to the representation of other task dimensions.
Both regions showed higher correlation coefficients for sampling events that occurred within the same position (CA1: r = 0.14, CA3: r = 0.27) than for samples that occurred across positions within the same context (CA1: r = 0.01, d’ = 0.35; CA3: r = 0.12, d’ = 0.36; p < 0.0001 for both regions). The correlation of activity patterns recorded within a context were higher in both regions than correlations for samples that occurred in the opposing contexts (CA1: r = −0.06, d’ = 0.23; CA3: r = −0.03, d’ = 0.34; p < 0.0001 for both regions) which were significantly anti-correlated in both regions (p < 0.0001 for both regions). Thus, the full schema that was identified when ensembles were pooled between the two hippocampal fields existed in both CA1 and CA3.
To determine whether a particular task dimension (e.g. position) had a stronger influence on population firing patterns in CA1 versus CA3, the degree of dimensional coding was estimated with a d’ metric described above. The difference between the d’ metrics calculated for each region was compared against a randomized data set in which the identity of each neuron (CA1 or CA3) was shuffled 10000 times. Position, context, set and valence were coded similarly by these regions (the probability that the observed difference between d’ metrics was larger than shuffled data was greater than 0.2 for each dimension) (Figure S1C). In contrast, CA1 showed greater item coding for sampling events that occurred within a position (CA1 d’ = 0.23; CA3 d’ = 0.11; p = 0.003) and also showed greater item coding when activity patterns were compared across positions within the same context (CA1 d’ = 0.25; CA3 d’ = 0.08; p < 0.0001). Therefore, while item information influenced firing rates in both regions, CA1 ensembles distinguished items within a fixed position as well as across positions more so than CA3 ensembles.
Non-spatial and spatial dimensions are distinctly expressed during item sampling
We next explored whether different dimensions of an event are encoded as a unified representation, or whether each dimension is encoded distinctly, consistent with an associative network of the component elements of memories. We reasoned that, if an item’s identity, valence and position are integrated within a unified representation, they should all be expressed simultaneously. On the other hand, if these dimensions are distinctly encoded, then their representations might be expected to appear sequentially during the item-sampling period. To address this question, firing rates for each item-sampling event were calculated for 250ms bins centered around the onset of item sampling and ensembles recorded on different samples were correlated at each time bin.
These analyses indicated that information about item identity, valence, and position are expressed sequentially rather than simultaneously. Position information was expressed first. For all types of item sampling events that occurred within the same position, at the outset of sampling there was an initial increase in the mean ensemble correlation regardless of whether the sampling events contained the same item (Figure 4A, black), different items of the same valence (Figure 4A, red) or different items of opposing valence (Figure 4A, green) indicating a reliable position code at the onset of sampling. In contrast, ensemble correlations between positions were, on average, low throughout item sampling (Figure 4A, grey). The difference between the within position versus between position correlations was assessed using the d’ metric that reflects the degree of position coding (Figure 4B, grey). Position d’ was significant for approximately 1000ms before item sampling and peaked 250ms after item sampling before significantly decreasing (max d’ - min d’ = 0.19, probability observed d’ range in bootstrap data < 0.001) (Figure 4B, grey).
Figure 4.
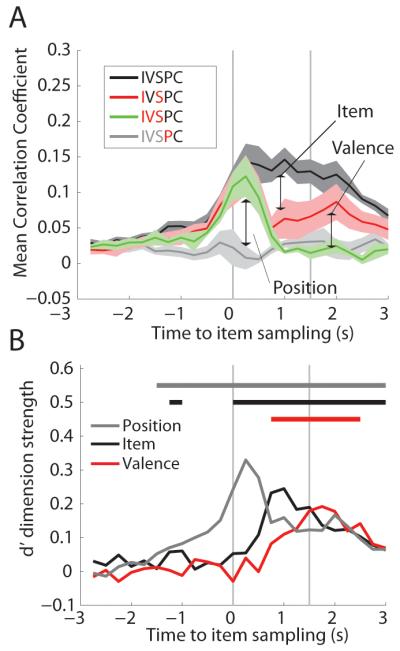
During item sampling, position is coded first, followed by item, and finally valence. (A) The ensemble correlation analyses was done using the population firing rates taken from 250ms bins centered around sampling for trials in the same location. Sampling epochs shorter that 1.5s were excluded. IVSPC defined in Table 1. Mean of each rat’s average correlation coefficient is plotted with S.E.M. (N = 5). (B) The average d’ for item (black) and valence (red) and position (grey) for trials in the same position. Color coded bar above graph shows periods in which that dimension was significantly coded.
The decrease in position coding was caused by the onset of item and valence coding that increased the variability of firing within a position. For sampling events with the same item in the same position, the average ensemble correlation increased upon arrival to the items and remained high throughout item sampling (Figure 4A, black), indicating reliable coding throughout the sampling epoch. Sampling events with different items of the same valence (Figure 4A, red) showed the same initial increase in ensemble correlation, which subsequently decreased throughout item sampling, reflecting the divergence of neural firing patterns in response to different stimuli – the item code. The d’ metric for item coding (Figure 4B, black) was statistically significant from the onset of sampling until the reward was retrieved, and peaked 1000 ms after item sampling. Therefore, item information increased at the same time points when position coding decreased.
Valence information influenced hippocampal neuronal firing rates last during item sampling. When comparing samples with different items and different reward valence (Figure 4A, green), neural activity was initially well correlated, reflecting the position code. However, 750ms after item sampling, ensembles recorded during events with different items of the same valence were significantly more correlated than ensembles recorded during samples of items with different valence, as shown by the increase in the valence d’ metric at these times (Figure 4B, red). Notably, valence coding peaks at the end of the item sampling period, suggesting this activity may reflect preparation of the differential behavioral response associated with items of opposite valence.
The distinct representation of position, valence, and item coding suggests that these task dimensions are encoded as distinct elements rather than unified conjunctions.
New associations are rapidly assimilated within the existing hippocampal network
A defining property of schemas is that new memories are stored within the structure of related existing memories (Piaget, 1928; McKenzie et al., 2011; McClelland et al., 2013, 1995). Therefore, we tested the hypothesis that neural activity recorded during training of the second item set (CD) would be similar to activity already established during training on the first item set (AB) learned within the same context. We expected a stable position and context code, because adding new items within the same spatial organizations did not alter the meanings of these task dimensions. Also, based on the view that schemas link closely related events, we also expected similarity in the ensemble representations of items that similarly predict reward or non-reward within a context.
To determine whether firing patterns reflected the similarity of the two item sets, we first identified the item and position conjunction that generated the highest firing rate during the last day of training on the first item set (AB3; see Figure 1A,D). We then used this preferred item and position for each neuron to compare firing rates during sampling of items of the same and different valence during the first day of training on the second item set (CD1). This required comparing the activity patterns of the same neurons between two successive daily sessions, and so this analysis focused on 38 neurons that were carefully selected as having identical characteristics across days (see Experimental Methods). As predicted, we observed that in 52.6% of the cells (n = 20/38), the median firing rate recorded during the second item set was higher for the same-valence item in the preferred position than in any of the other seven item and place combinations (χ2 = 52.4, p = 4.65−13). For example, Cell 1 in Figure 5A fired for unrewarded Item B- in both positions in Context 1 and fired equivalently for unrewarded Item D- in both positions in Context 1 (main effect valence F(1,213) = 16.96, p = 0.0001, Item B vs Item D in Positions 1 and 2, Ps > 0.05). Similarly, Cell 2 showed equivalent firing for unrewarded Items A- and C- in only one of the positions in Context 2 (main effect valence F(1,213) = 171,1. p = 4.41−29; Item A vs Item C in Position 3, t(8) = 0.33, p = 0.75).
Figure 5.

New items are encoded within an established schema. (A) The z-score firing rate for two cells recorded on the last day of training on the first item set (AB3) and the first day of training on the second item set (CD1) 24 hours later. (B) The mean z-score firing rate recorded on the first and last encounter with each item, as identified on AB3 training. (C) Data from AB3 and CD1 were merged and the median ensemble rates for each item and place conjunction were calculated and population vectors were correlated from AB3 to CD1 to create the 8x8 similarity matrix. (D) The valence, position and context coding that developed over AB training was preserved and extended to training with the new item set. IVSPC defined in Table 1. # p = 0.053, * p < 0.05, ** p < 0.01. See also Figure S5.
To examine when common firing across item sets emerged, firing rates were compared on the first and last encounter with each new item (Items C & D) for which animals made the appropriate behavioral response. On both the first and last sampling event, firing rates were higher in the preferred positions (mixed-model repeated measured ANOVA, main effect position F1,37 = 10.68, p = 0.002, post-hoc t-tests at each time point, Ps < 0.05) revealing a stable position code across item sets. Even on the first correct encounter with each item in the preferred position (absolute sample number 1-48, mean sample number = 11.25±11.86 SD), there was a trend that cells fired more for the same-valence item (mean z-score rate = 1.24 ± 0.35) than the different-valence item (mean z-score rate = 0.38 ± 0.28; paired t-test, t(37) = 1.99, p = 0.053) (Figure 5B, first sample) though an equal number of cells fired maximally to the same (n = 20/38) and different valence items (χ2 = 0.02, p = 0.87). By the end of training, cells clearly showed a firing rate preference for the equivalent item. On the last sampling events for each item in the preferred position, cells fired at a significantly higher rate for same-valence items (mean z-score rate = 1.17 ±0.31) as compared to items of opposing valence (mean z-score rate 0.11±0.13, t(37) = 3.52, p = 0.001) (Figure 5B, last sample) and far more cells (n = 33/38) fired maximally to the equivalent item (χ2 = 19.2, p = 1.19−5).
We then tested for differences in firing to the same- and different-valence items in the non-preferred location within the preferred context. On the first sample with each item, there were no differences in firing rates (t(35) = 1.47, p = 0.15), though by the final sample there was greater firing to same-valence items (t(35) = 2.81, p = 0.008)(Figure 5B, non-preferred position). These results show that during learning, cells developed a preference for the item of the same valence in both the preferred and non-preferred positions.
We next asked whether the overall neural representation developed during training of the first item set was re-invoked during training of the second item set. We adopted a similar correlation analysis as that previously described for analyzing days when all items were inter-mixed, though instead of comparing simultaneously recorded ensembles on individual samples, we calculated the median firing rate for each item and place combination (four items in four positions) for each cell (n = 38) and concatenated these rates across rats for subsequent analysis. The ensemble similarity in response to different item and position combinations was established by examining the correlations of cell activity recorded at every item and position combination for the first item set (two items in four positions) with firing rates recorded during initial training of the second item set (two new items in the same four positions) recorded 24 hours later. The resulting 8x8 similarity matrix describes which item and position combinations result in overlapping hippocampal ensembles (high correlations), and therefore operationally defines the neural network organization of the task dimensions (Figure 5C). As suggested by the findings on single cell activity patterns, when analyses were limited to sampling events occurring in the same position, samples with different items of the same valence were more correlated (mean r = 0.60) than samples with different items of opposing valence (mean r = 0.38; d’ = 1.79, p = 0.001), suggesting a subset of cells that fired during the first item set fired similarly for the equivalent item of the second item set.
We also found evidence for a stable position and context code. Population activity patterns recorded during item sampling in the same position across days were more correlated (mean r = 0.49) than those recorded in different positions (mean r = 0.02; d’ = 3.06, p < 0.0001), which were in turn more correlated than those recorded within the other context (mean r = −0.24; d’ = 1.84, p < 0.0001) (Figure 5D). Together these data show that neural correlates of the entire task structure that developed during training on the first item set were adopted and extended to encode related items that occurred within the same context.
The combined findings in these analyses suggest that neural activity during learning of new item associations reflected binding of information acquired over multiple days into a unified schema that represents equivalent item and position associations within overlapping hippocampal networks. The item and place conjunctions that generated correlated neural activity at the end of learning both item sets were qualitatively the same as those observed during overtraining days in which all items were presented, suggesting that the schema that developed during learning was maintained until the final day of behavioral testing.
Discussion
The present findings show that hippocampal neuronal networks represent a hierarchical organization that links overlapping elements of related memories. For both spatial and non-spatial elements of separate experiences, related features were integrated within an organized representation, whereas events that dictated divergent behavior and reward expectations were separated into distinct hippocampal representations. These findings show that memory representations in the hippocampus are not characterized by unified configurations of places identified by specific landmarks, but rather that the hippocampus creates a schematic representation of the behaviorally relevant relationships between distinct elements of memories, including perceptually defined objects, their meaning, and the places they occur, and strongly separate schemas are created for events that occur in meaningfully different contexts.
These results add to a confluence of evidence indicating that the hippocampus encodes both non-spatial and spatial features of an experience. Several studies have reported that hippocampal neurons respond to specific non-spatial stimuli only within the place field for each cell (Komorowski et al., 2009; Moita et al., 2003), while others have reported responses to common stimuli across multiple locations (Wood et al., 1999; Manns et al., 2009; McKenzie et al., 2013; Singer et al., 2010; Eichenbaum et al., 1987). We observed both types of responses as shown by item and valence coding within and across positions. Some have hypothesized that spatial contexts are represented by qualitatively distinct mappings of place cells whereas events are encoded by quantitative differences in firing rate (Leutgeb et al., 2005). The present findings indicate a more complex, yet highly organized population representation in the hippocampus that interleaves distinct and related events within and across positions and contexts.
We observed that most CA1 and CA3 neurons exhibited high-dimensional coding, including conjunctive responses to both object and spatial dimensions (Komorowski et al., 2009; Manns et al., 2009; Anderson and Jeffery, 2009; Wiebe and Stäubli 1999; Deshmukh et al., 2013), consistent with the convergence of the ‘what’ and ‘where’ pathways within the hippocampus (Witter et al., 2000). The importance of associating events and the places and context in which they occur is prominent in studies of hippocampal memory function in animals (Balderas et al., 2008; Komorowski et al., 2013; Tse et al., 2007; Parkinson et al., 1988) and humans (Holdstock et al., 2002; Vargha-Khadem et al., 1997). Together, these results, and others (Davachi et al., 2003; Diana et al., 2010) support the hypothesis that the hippocampal contribution to memory involves binding of items within a contextual framework (Eichenbaum et al., 2007; Diana et al., 2007).
Many have argued that the binding of items in contexts increases the uniqueness of memory traces, allowing the storage and recollection of distinct episodic memories (Gilbert et al., 1998; Yassa et al., 2011; Norman 2010; Norman and O’Reilly 2003; Xu et al., 2013; Hasselmo and Wyble, 1997). The observation that place cells generate independent spatial mappings in different contexts (Paz-Villagrán et al., 2004; Spiers et al., 2013; Leutgeb et al., 2004; Kubie and Ranck 1983; Hayman et al., 2003) has suggested that the hippocampus creates qualitatively distinct representations of overlapping memories in order to reduce interference (Kumaran and McClelland, 2012). Challenging this view, here we found strong evidence that similar events are represented within a hierarchical organization of correlated hippocampal firing patterns.
Other recording studies have suggested elements of a common hippocampal code for related events. When animals perform the same behavioral response to retrieve a reward at different positions, subsets of hippocampal neurons fire similarly at multiple locations around a circular track (McKenzie et al., 2013). Similarly, when animals traverse parallel arms of a W-shaped maze to retrieve reward, cells fire at equivalent positions on each arm, suggesting a common code for functionally equivalent events at different locations (Singer et al., 2010). In humans, monkeys, and rats hippocampal neurons respond to categories of items that are functionally equivalent (Kreiman et al., 2000; Quiroga et al., 2005; Deadwyler et al., 1996). These parallel lines of evidence indicate that the hippocampus records common features of events within overlapping networks that link related memories (Eichenbaum, 2004). Furthermore, whereas other studies have reported differences in continuous versus categorical coding in CA1 and CA3 (Leutgeb et al., 2004; but see Colgin et al., 2010), respectively, here neuronal networks across these areas act cooperatively in a common, continuous, and hierarchical organization of memory representations.
Importantly, the hippocampus did not similarly encode sets of items that co-occurred within trials throughout training. This finding is striking for several reasons. First, it is notable that rats move rapidly between objects within trials, such that pairs of sampling events with items of the same set were on average presented much closer in time than items between sets. The absence of strong correlations despite these shorter inter-sample intervals indicates that high correlations between items of the same valence from different sets were not due to baseline temporal correlations in hippocampal cell firing. Second, these results are an important control showing that the hippocampus does not code all possible regularities but only those that are meaningful, in this case, stimuli that have in common that they predict reward or non-reward. Third, several models strongly predict that events that occur closely in time will be represented by correlated patterns of activity due to the recall of the common temporal context (Howard and Kahana, 2002). The current results do not necessarily indicate that the hippocampus does not encode temporal context, but do suggest that in the present paradigm, common temporal context is secondary to other meaningful regularities including spatial context, position, reward, and the perceptual properties of the sampled item. These findings indicate that hippocampal networks do not necessarily capture a unified and qualitatively distinct “snapshot” of each episode, but rather the absence of a hippocampal code for co-occurrence reflects the integration of multiple related, albeit separate, experiences into a schematic organization.
We found that events that occurred in different contexts were represented by anti-correlated hippocampal population firing patterns. This finding is in contrast to the independent place code that is often reported for unrelated contexts and also distinct from observation of anti-correlated activity for different behaviors executed within the same space (Bahar et al., 2011; Markus et al., 1995). In our experiment, rats executed the same behaviors in both contexts, though in response to different items. Therefore, the anti-correlated representations reflect either the context dependent item associations or the behavior and item associations, but cannot simply reflect behavior or arousal alone (O’Keefe 1999). The additional finding of anti-correlated representations of events of opposite significance across locations within a context suggests that strong separation of representations may be driven by opposing significance of events within or between contexts.
Previous studies have established that place cells maintain a somewhat stable place code across days (Ziv et al., 2013; Thompson and Best, 1990; Mankin et al., 2012). We extend these findings and show that cells also maintain a stable valence code across days and across different items when training produces consistent behaviors across days. After characterizing the items that cells prefer, 79% of those cells went on to fire more in response to other items of equivalent valence. These results suggest that, at the time of learning, new information is rapidly assimilated within networks of related memory traces (Eichenbaum, 2004; McKenzie and Eichenbaum, 2011). Similarities in hippocampal coding between familiar and novel conditions likely reflects the integration of related memories, arguably a primary purpose of memory systems in schema development and memory consolidation (McClelland et al., 1995; Tse et al., 2007). This overlapping code at the time of learning builds relational representations that could support transitive associations between separately learned experiences via of their common associations with a behaviorally relevant context (Dusek et al., 1997; Bunsey and Eichenbaum, 1996; Zeithamova et al., 2010, 2012).
Experimental methods
Subjects and behavioral task
Subjects were ten male Long-Evans rats kept on food restriction and held at a minimum of 85% free-feeding weight. All animal procedures were approved by the Boston University Institutional Animal Care and Use Committee.
The contexts were two chambers separated by a central alleyway that differed in terms of color and texture of the floors and wall. The objects (referred to as “items”) were terra-cotta pots filled with different digging media (e.g. shredded paper) and scented with different essential oils (e.g. maple) and reward was a small bit of cereal buried in one of the pots. On each trial, two objects were located in either left-right spatial configuration within a context randomized across trials. After learning the initial XY problem, 5 rats were implanted with hyperdrives in dorsal CA1 and CA3 then, after surgical recovery and identification of neuronal activity, were trained successively on AB and CD for 3 days each, then for 3 days on both sets concurrently in randomly presented AB and CD trials (ABCD). Another set of 5 non-implanted rats were used to measure learning rates on each problem.
Single neurons analyses
For every item sampling event, cell firing rate was determined as the number of action potentials observed during at most 2s of sampling. A 4-way ANOVA was calculated for each cell’s firing rates with main effects of: context, position nested within context, valence and item set. All interactions were also calculated and item coding was assessed through the interaction of valence and set (see Figure S1D for proportion of significant cells in CA1 and CA3).
Multi-dimensional representational similarity analyses
Firing rates for individual neurons were z-score normalized using the mean and standard deviation among all item sampling events to create a population vector of normalized rates for each event. The Pearson’s correlation coefficient of these population vectors was calculated for every pair of events. Strength of a coding dimension was calculated by comparing the mean correlation for events within versus between conditions for that dimension (Table 1). The dimension d’ was generated either for individual rats or for the experiment as a whole by pooling the correlations among rats. The observed d’ was compared to bootstrap data set in which event identities were shuffled 10000 times and then the correlation analysis and d’ metrics were recomputed for each bootstrap sample (Figure S2). When data were compared against zero, the d’ metric was the mean correlation coefficient divided by the standard deviation.
The hierarchical nature of the schema was visualized using the MATLAB R2012b functions linkage and dendrogram. For each item and position combination, a large firing rate vector was created composed of the median firing rates of every cell (N = 560) recorded from a session in which correct behavior was observed for all 16 item and place conjunctions (one session failed to meet this criteria)(see Figure 3E). The agglomerative hierarchical cluster tree was then created using the unweighted average distance between pairs of vectors and the Pearson’s correlation coefficient as the distance metric.
Temporal dynamics of population firing patterns
To assess when different dimensions emerged during item sampling, we ran a similar analysis though firing rates were taken at different 250ms time bins centered ±3s around item sampling (Figure 4). Only events for which the rat’s head remained over the pot for over 1.5s were included. Significance testing was done using the same bootstrap analysis at each time point and comparing whether the observed d’ was significant at p < 0.002 (Bonferroni correction for 24 time points).
Comparison of representations across learning AB and CD problems
The last day of AB training (AB3) was merged with the first day of CD training (CD1), to investigate how firing during sampling of A & B generalized upon first introduction of C & D (see Supplemental Experimental Methods for analyses to ensure recording stability and Figure S5). To assess the similarity of neuronal activity for one item set (e.g. AB) versus that for the other item set (e.g. CD), each item and position combination (n=16) was associated with a firing rate vector composed of the rates of every cell (N=38). The pair-wise correlation of these vectors across days generated an 8x8 similarity matrix, which reflects the overlap in neural activity for each item and place combination. These correlations were grouped and averaged to compare task dimension coding as described above. Statistical testing was done by shuffling the item/position identity of each median rate vector and recalculating the correlations on the randomized data set.
Supplementary Material
Highlights.
Hippocampal ensembles form hierarchical representations of multiple task dimensions
Different features of events are represented successively
New information is encoded in extant networks that represent common information
Acknowledgements
We greatly appreciate the productive conversations with Marc Howard throughout the preparation of this manuscript. This work was supported by NIMH MH52090 and MH094263.
Footnotes
Publisher's Disclaimer: This is a PDF file of an unedited manuscript that has been accepted for publication. As a service to our customers we are providing this early version of the manuscript. The manuscript will undergo copyediting, typesetting, and review of the resulting proof before it is published in its final citable form. Please note that during the production process errors may be discovered which could affect the content, and all legal disclaimers that apply to the journal pertain.
References
- Alvernhe A, Van Cauter T, Save E, Poucet B. Different CA1 and CA3 representations of novel routes in a shortcut situation. The Journal of Neuroscience. 2008;28:7324–7333. doi: 10.1523/JNEUROSCI.1909-08.2008. [DOI] [PMC free article] [PubMed] [Google Scholar]
- Anderson MI, Jeffery KJ. Heterogeneous modulation of place cell firing by changes in context. The Journal of Neuroscience. 2003;23:8827–8835. doi: 10.1523/JNEUROSCI.23-26-08827.2003. [DOI] [PMC free article] [PubMed] [Google Scholar]
- Bahar AS, Shirvalkar PR, Shapiro ML. Memory-guided learning: CA1 and CA3 neuronal ensembles differentially encode the commonalities and differences between situations. The Journal of Neuroscience. 2011;31:12270–12281. doi: 10.1523/JNEUROSCI.1671-11.2011. [DOI] [PMC free article] [PubMed] [Google Scholar]
- Bakker A, Kirwan CB, Miller M, Stark CEL. Pattern separation in the human hippocampal CA3 and dentate gyrus. Science. 2008;319:1640–1642. doi: 10.1126/science.1152882. [DOI] [PMC free article] [PubMed] [Google Scholar]
- Buckmaster CA, Eichenbaum H, Amaral DG, Suzuki WA, Rapp PR. Entorhinal cortex lesions disrupt the relational organization of memory in monkeys. The Journal of Neuroscience. 2004;24:9811–9825. doi: 10.1523/JNEUROSCI.1532-04.2004. [DOI] [PMC free article] [PubMed] [Google Scholar]
- Bunsey M, Eichenbaum H. Conservation of hippocampal memory function in rats and humans. Nature. 1996;379:255–257. doi: 10.1038/379255a0. [DOI] [PubMed] [Google Scholar]
- Colgin LL, Leutgeb S, Jezek K, Leutgeb JK, Moser EI, McNaughton BL, Moser M-B. Attractor-map versus autoassociation based attractor dynamics in the hippocampal network. Journal of Neurophysiology. 2010;104:35–50. doi: 10.1152/jn.00202.2010. [DOI] [PMC free article] [PubMed] [Google Scholar]
- Davachi L, Mitchell JP, Wagner AD. Multiple routes to memory: distinct medial temporal lobe processes build item and source memories. Proceedings of the National Academy of Sciences of the United States of America. 2003;100:2157–2162. doi: 10.1073/pnas.0337195100. [DOI] [PMC free article] [PubMed] [Google Scholar]
- Deadwyler SA, Bunn T, Hampson RE. Hippocampal ensemble activity during spatial delayed-nonmatch-to-sample performance in rats. The Journal of Neuroscience. 1996;16:354–372. doi: 10.1523/JNEUROSCI.16-01-00354.1996. [DOI] [PMC free article] [PubMed] [Google Scholar]
- Deng W, Mayford M, Gage FH. Selection of distinct populations of dentate granule cells in response to inputs as a mechanism for pattern separation in mice. eLife. 2013;2:e00312. doi: 10.7554/eLife.00312. [DOI] [PMC free article] [PubMed] [Google Scholar]
- Deshmukh SS, Knierim JJ. Influence of local objects on hippocampal representations: Landmark vectors and memory. Hippocampus. 2013;23:253–267. doi: 10.1002/hipo.22101. [DOI] [PMC free article] [PubMed] [Google Scholar]
- Devito LM, Kanter BR, Eichenbaum H. The hippocampus contributes to memory expression during transitive inference in mice. Hippocampus. 2010;20:208–217. doi: 10.1002/hipo.20610. [DOI] [PMC free article] [PubMed] [Google Scholar]
- Diana RA, Yonelinas AP, Ranganath C. Imaging recollection and familiarity in the medial temporal lobe: a three-component model. Trends in Cognitive Sciences. 2007;11:379–386. doi: 10.1016/j.tics.2007.08.001. [DOI] [PubMed] [Google Scholar]
- Diana RA, Yonelinas AP, Ranganath C. Medial temporal lobe activity during source retrieval reflects information type, not memory strength. Journal of Cognitive Neuroscience. 2010;22:1808–1818. doi: 10.1162/jocn.2009.21335. [DOI] [PMC free article] [PubMed] [Google Scholar]
- Dupret D, O’Neill J, Pleydell-Bouverie B, Csicsvari J. The reorganization and reactivation of hippocampal maps predict spatial memory performance. Nature Neuroscience. 2010;13:995–1002. doi: 10.1038/nn.2599. [DOI] [PMC free article] [PubMed] [Google Scholar]
- Dusek JA, Eichenbaum H. The hippocampus and memory for orderly stimulus relations. Proceedings of the National Academy of Sciences of the United States of America. 1997;94:7109–7114. doi: 10.1073/pnas.94.13.7109. [DOI] [PMC free article] [PubMed] [Google Scholar]
- Eichenbaum H. Hippocampus : Cognitive Processes and Neural Representations that Underlie Declarative Memory The hippocampus serves a critical role in declarative. Neuron. 2004;44:109–120. doi: 10.1016/j.neuron.2004.08.028. [DOI] [PubMed] [Google Scholar]
- Eichenbaum H, Kuperstein M, Fagan A, Nagode J. Cue-sampling and goal-approach correlates of hippocampal unit activity in rats performing an odor-discrimination task. The Journal of Neuroscience. 1987;7:716–732. doi: 10.1523/JNEUROSCI.07-03-00716.1987. [DOI] [PMC free article] [PubMed] [Google Scholar]
- Eichenbaum H, Yonelinas AP, Ranganath C. The medial temporal lobe and recognition memory. Annual Review of Neuroscience. 2007;30:123–152. doi: 10.1146/annurev.neuro.30.051606.094328. [DOI] [PMC free article] [PubMed] [Google Scholar]
- Farovik A, Dupont LM, Eichenbaum H. Distinct roles for dorsal CA3 and CA1 in memory for sequential nonspatial events. Learning & Memory. 2010;17:12–17. doi: 10.1101/lm.1616209. [DOI] [PMC free article] [PubMed] [Google Scholar]
- Gilbert PE, Kesner RP, DeCoteau WE. Memory for spatial location: role of the hippocampus in mediating spatial pattern separation. The Journal of Neuroscience. 1998;18:804–810. doi: 10.1523/JNEUROSCI.18-02-00804.1998. [DOI] [PMC free article] [PubMed] [Google Scholar]
- Greene AJ, Gross WL, Elsinger CL, Rao SM. An FMRI analysis of the human hippocampus: inference, context, and task awareness. Journal of Cognitive Neuroscience. 2006;18:1156–1173. doi: 10.1162/jocn.2006.18.7.1156. [DOI] [PMC free article] [PubMed] [Google Scholar]
- Hasselmo ME, Wyble BP. Free recall and recognition in a network model of the hippocampus: simulating effects of scopolamine on human memory function. Behavioural Brain Research. 1997;89:1–34. doi: 10.1016/s0166-4328(97)00048-x. [DOI] [PubMed] [Google Scholar]
- Hayman RMA, Chakraborty S, Anderson MI, Jeffery KJ. Context-specific acquisition of location discrimination by hippocampal place cells. The European Journal of Neuroscience. 2003;18:2825–2834. doi: 10.1111/j.1460-9568.2003.03035.x. [DOI] [PubMed] [Google Scholar]
- Heckers S, Zalesak M, Weiss AP, Ditman T, Titone D. Hippocampal activation during transitive inference in humans. Hippocampus. 2004;14:153–162. doi: 10.1002/hipo.10189. [DOI] [PubMed] [Google Scholar]
- Hoge J, Kesner RP. Role of CA3 and CA1 subregions of the dorsal hippocampus on temporal processing of objects. Neurobiology of Learning and Memory. 2007;88:225–231. doi: 10.1016/j.nlm.2007.04.013. [DOI] [PMC free article] [PubMed] [Google Scholar]
- Holdstock JS, Mayes AR, Roberts N, Cezayirli E, Isaac CL, O’Reilly RC, Norman KA. Under what conditions is recognition spared relative to recall after selective hippocampal damage in humans? Hippocampus. 2002;12:341–351. doi: 10.1002/hipo.10011. [DOI] [PubMed] [Google Scholar]
- Howard MW, Kahana MJ. A Distributed Representation of Temporal Context. Journal of Mathematical Psychology. 2002;46:269–299. [Google Scholar]
- Van Kesteren MTR, Fernández G, Norris DG, Hermans EJ. Persistent schema-dependent hippocampal-neocortical connectivity during memory encoding and postencoding rest in humans. Proceedings of the National Academy of Sciences of the United States of America. 2010;107:7550–7555. doi: 10.1073/pnas.0914892107. [DOI] [PMC free article] [PubMed] [Google Scholar]
- Komorowski RW, Manns JR, Eichenbaum H. Robust conjunctive item-place coding by hippocampal neurons parallels learning what happens where. The Journal of Neuroscience. 2009;29:9918–9929. doi: 10.1523/JNEUROSCI.1378-09.2009. [DOI] [PMC free article] [PubMed] [Google Scholar]
- Komorowski RW, Garcia CG, Wilson A, Hattori S, Howard MW, Eichenbaum H. Ventral hippocampal neurons are shaped by experience to represent behaviorally relevant contexts. The Journal of Neuroscience. 2013;33:8079–8087. doi: 10.1523/JNEUROSCI.5458-12.2013. [DOI] [PMC free article] [PubMed] [Google Scholar]
- Kreiman G, Koch C, Fried I. Category-specific visual responses of single neurons in the human medial temporal lobe. Nature Neuroscience. 2000;3:946–953. doi: 10.1038/78868. [DOI] [PubMed] [Google Scholar]
- Kriegeskorte N, Mur M, Bandettini P. Representational similarity analysis - connecting the branches of systems neuroscience. Frontiers in Systems Neuroscience. 2008;2:4. doi: 10.3389/neuro.06.004.2008. [DOI] [PMC free article] [PubMed] [Google Scholar]
- Kubie J, Ranck J. Sensory-behavioral correlates in individual hippocampus neurons in three situations: Space and context. Neurobiology of the Hippocampus. 1983 [Google Scholar]
- Kumaran D, Summerfield JJ, Hassabis D, Maguire EA. Tracking the emergence of conceptual knowledge during human decision making. Neuron. 2009;63:889–901. doi: 10.1016/j.neuron.2009.07.030. [DOI] [PMC free article] [PubMed] [Google Scholar]
- Kumaran D, Melo HL, Duzel E. The emergence and representation of knowledge about social and nonsocial hierarchies. Neuron. 2012;76:653–666. doi: 10.1016/j.neuron.2012.09.035. [DOI] [PMC free article] [PubMed] [Google Scholar]
- Lee I, Yoganarasimha D, Rao G, Knierim JJ. Comparison of population coherence of place cells in hippocampal subfields CA1 and CA3. Nature. 2004;430:456–459. doi: 10.1038/nature02739. [DOI] [PubMed] [Google Scholar]
- Leutgeb S, Leutgeb JK, Treves A, Moser M-B, Moser EI. Distinct ensemble codes in hippocampal areas CA3 and CA1. Science. 2004;305:1295–1298. doi: 10.1126/science.1100265. [DOI] [PubMed] [Google Scholar]
- Leutgeb S, Leutgeb JK, Barnes CA, Moser EI, McNaughton BL, Moser M-B. Independent codes for spatial and episodic memory in hippocampal neuronal ensembles. Science. 2005;309:619–623. doi: 10.1126/science.1114037. [DOI] [PubMed] [Google Scholar]
- Mankin EA, Sparks FT, Slayyeh B, Sutherland RJ, Leutgeb S, Leutgeb JK. Neuronal code for extended time in the hippocampus. Proceedings of the National Academy of Sciences of the United States of America. 2012;109:19462–19467. doi: 10.1073/pnas.1214107109. [DOI] [PMC free article] [PubMed] [Google Scholar]
- Manns JR, Eichenbaum H. A cognitive map for object memory in the hippocampus. Learning & Memory. 2009;16:616–624. doi: 10.1101/lm.1484509. [DOI] [PMC free article] [PubMed] [Google Scholar]
- Markus E, Qin Y, Leonard B, Skaggs W, McNaughton B, Barnes C. Interactions between location and task affect the spatial and directional firing of hippocampal neurons. The Journal of Neuroscience. 1995;15:7079–7094. doi: 10.1523/JNEUROSCI.15-11-07079.1995. [DOI] [PMC free article] [PubMed] [Google Scholar]
- McClelland JL. Incorporating rapid neocortical learning of new schema-consistent information into complementary learning systems theory. Journal of Experimental Psychology. General. 2013;142:1190–1210. doi: 10.1037/a0033812. [DOI] [PubMed] [Google Scholar]
- McClelland JL, McNaughton BL, O’Reilly RC. Why there are complementary learning systems in the hippocampus and neocortex: insights from the successes and failures of connectionist models of learning and memory. Psychological Review. 1995;102:419–457. doi: 10.1037/0033-295X.102.3.419. [DOI] [PubMed] [Google Scholar]
- McKenzie S, Eichenbaum H. Consolidation and reconsolidation: two lives of memories? Neuron. 2011;71:224–233. doi: 10.1016/j.neuron.2011.06.037. [DOI] [PMC free article] [PubMed] [Google Scholar]
- McKenzie S, Robinson NTM, Herrera L, Churchill JC, Eichenbaum H. Learning Causes Reorganization of Neuronal Firing Patterns to Represent Related Experiences within a Hippocampal Schema. The Journal of Neuroscience. 2013;33:10243–10256. doi: 10.1523/JNEUROSCI.0879-13.2013. [DOI] [PMC free article] [PubMed] [Google Scholar]
- Moita MAP, Rosis S, Zhou Y, LeDoux JE, Blair HT. Hippocampal place cells acquire location-specific responses to the conditioned stimulus during auditory fear conditioning. Neuron. 2003;37:485–497. doi: 10.1016/s0896-6273(03)00033-3. [DOI] [PubMed] [Google Scholar]
- Norman KA. How hippocampus and cortex contribute to recognition memory: revisiting the complementary learning systems model. Hippocampus. 2010;20:1217–1227. doi: 10.1002/hipo.20855. [DOI] [PMC free article] [PubMed] [Google Scholar]
- Norman KA, O’Reilly RC. Modeling hippocampal and neocortical contributions to recognition memory: a complementary-learning-systems approach. Psychological Review. 2003;110:611–646. doi: 10.1037/0033-295X.110.4.611. [DOI] [PubMed] [Google Scholar]
- O’Keefe J. Do hippocampal pyramidal cells signal non-spatial as well as spatial information? Hippocampus. 1999;9:352–364. doi: 10.1002/(SICI)1098-1063(1999)9:4<352::AID-HIPO3>3.0.CO;2-1. [DOI] [PubMed] [Google Scholar]
- Parkinson JK, Murray EA, Mishkin M. A selective mnemonic role for the hippocampus in monkeys: memory for the location of objects. The Journal of Neuroscience. 1988;8:4159–4167. doi: 10.1523/JNEUROSCI.08-11-04159.1988. [DOI] [PMC free article] [PubMed] [Google Scholar]
- Paz-Villagrán V, Save E, Poucet B. Independent coding of connected environments by place cells. The European Journal of Neuroscience. 2004;20:1379–1390. doi: 10.1111/j.1460-9568.2004.03570.x. [DOI] [PubMed] [Google Scholar]
- Piaget J. Judgment and Reasoning in the Child. Kegan, Paul, Trench, and Trubner; London: 1928. [Google Scholar]
- Poppenk J, McIntosh AR, Craik FIM, Moscovitch M. Past experience modulates the neural mechanisms of episodic memory formation. The Journal of Neuroscience. 2010;30:4707–4716. doi: 10.1523/JNEUROSCI.5466-09.2010. [DOI] [PMC free article] [PubMed] [Google Scholar]
- Preston AR, Shrager Y, Dudukovic NM, Gabrieli JDE. Hippocampal contribution to the novel use of relational information in declarative memory. Hippocampus. 2004;14:148–152. doi: 10.1002/hipo.20009. [DOI] [PubMed] [Google Scholar]
- Quiroga RQ, Reddy L, Kreiman G, Koch C, Fried I. Invariant visual representation by single neurons in the human brain. Nature. 2005;435:1102–1107. doi: 10.1038/nature03687. [DOI] [PubMed] [Google Scholar]
- Rigotti M, Barak O, Warden MR, Wang X-J, Daw ND, Miller EK, Fusi S. The importance of mixed selectivity in complex cognitive tasks. Nature. 2013;497:585–590. doi: 10.1038/nature12160. [DOI] [PMC free article] [PubMed] [Google Scholar]
- Rolls ET. A quantitative theory of the functions of the hippocampal CA3 network in memory. Frontiers in Cellular Neuroscience. 2013;7 doi: 10.3389/fncel.2013.00098. [DOI] [PMC free article] [PubMed] [Google Scholar]
- Ross DA, McGugin RW, Gauthier I. Heterogeneity of FFA responses or multiplexing? Trends in Cognitive Sciences. 2013 doi: 10.1016/j.tics.2013.12.002. [DOI] [PMC free article] [PubMed] [Google Scholar]
- Shohamy D, Wagner AD. Integrating memories in the human brain: hippocampal-midbrain encoding of overlapping events. Neuron. 2008;60:378–389. doi: 10.1016/j.neuron.2008.09.023. [DOI] [PMC free article] [PubMed] [Google Scholar]
- Singer AC, Karlsson MP, Nathe AR, Carr MF, Frank LM. Experience-dependent development of coordinated hippocampal spatial activity representing the similarity of related locations. The Journal of Neuroscience. 2010;30:11586–11604. doi: 10.1523/JNEUROSCI.0926-10.2010. [DOI] [PMC free article] [PubMed] [Google Scholar]
- Spiers HJ, Hayman RMA, Jovalekic A, Marozzi E, Jeffery KJ. Place Field Repetition and Purely Local Remapping in a Multicompartment Environment. Cerebral Cortex. 2013 doi: 10.1093/cercor/bht198. [DOI] [PMC free article] [PubMed] [Google Scholar]
- Thompson LT, Best PJ. Long-term stability of the place-field activity of single units recorded from the dorsal hippocampus of freely behaving rats. Brain Research. 1990;509:299–308. doi: 10.1016/0006-8993(90)90555-p. [DOI] [PubMed] [Google Scholar]
- Tse D, Langston RF, Kakeyama M, Bethus I, Spooner PA, Wood ER, Witter MP, Morris RGM. Schemas and memory consolidation. Science. 2007;316:76–82. doi: 10.1126/science.1135935. [DOI] [PubMed] [Google Scholar]
- Vargha-Khadem F, Gadian DG, Watkins KE, Connelly A, Van Paesschen W, Mishkin M. Differential effects of early hippocampal pathology on episodic and semantic memory. Science. 1997;277:376–380. doi: 10.1126/science.277.5324.376. [DOI] [PubMed] [Google Scholar]
- Vazdarjanova A, Guzowski JF. Differences in hippocampal neuronal population responses to modifications of an environmental context: evidence for distinct, yet complementary, functions of CA3 and CA1 ensembles. The Journal of Neuroscience. 2004;24:6489–6496. doi: 10.1523/JNEUROSCI.0350-04.2004. [DOI] [PMC free article] [PubMed] [Google Scholar]
- Wiebe SP, Stäubli UV. Dynamic filtering of recognition memory codes in the hippocampus. The Journal of Neuroscience. 1999;19:10562–10574. doi: 10.1523/JNEUROSCI.19-23-10562.1999. [DOI] [PMC free article] [PubMed] [Google Scholar]
- Wills TJ, Lever C, Cacucci F, Burgess N, O’Keefe J. Attractor dynamics in the hippocampal representation of the local environment. Science. 2005;308:873–876. doi: 10.1126/science.1108905. [DOI] [PMC free article] [PubMed] [Google Scholar]
- Wimmer GE, Shohamy D. Preference by association: how memory mechanisms in the hippocampus bias decisions. Science. 2012;338:270–273. doi: 10.1126/science.1223252. [DOI] [PubMed] [Google Scholar]
- Witter MP, Wouterlood FG, Naber PA, Van Haeften T. Anatomical organization of the parahippocampal-hippocampal network. Annals of the New York Academy of Sciences. 2000;911:1–24. doi: 10.1111/j.1749-6632.2000.tb06716.x. [DOI] [PubMed] [Google Scholar]
- Wood ER, Dudchenko PA, Eichenbaum H. The global record of memory in hippocampal neuronal activity. Nature. 1999;397:613–616. doi: 10.1038/17605. [DOI] [PubMed] [Google Scholar]
- Xu W, Südhof TC. A neural circuit for memory specificity and generalization. Science. 2013;339:1290–1295. doi: 10.1126/science.1229534. [DOI] [PMC free article] [PubMed] [Google Scholar]
- Yassa MA, Stark CEL. Pattern separation in the hippocampus. Trends in Neurosciences. 2011;34:515–525. doi: 10.1016/j.tins.2011.06.006. [DOI] [PMC free article] [PubMed] [Google Scholar]
- Zeithamova D, Preston AR. Flexible memories: differential roles for medial temporal lobe and prefrontal cortex in cross-episode binding. The Journal of Neuroscience. 2010;30:14676–14684. doi: 10.1523/JNEUROSCI.3250-10.2010. [DOI] [PMC free article] [PubMed] [Google Scholar]
- Zeithamova D, Dominick AL, Preston AR. Hippocampal and ventral medial prefrontal activation during retrieval-mediated learning supports novel inference. Neuron. 2012;75:168–179. doi: 10.1016/j.neuron.2012.05.010. [DOI] [PMC free article] [PubMed] [Google Scholar]
- Ziv Y, Burns LD, Cocker ED, Hamel EO, Ghosh KK, Kitch LJ, El Gamal A, Schnitzer MJ. Long-term dynamics of CA1 hippocampal place codes. Nature Neuroscience. 2013;16:264–266. doi: 10.1038/nn.3329. [DOI] [PMC free article] [PubMed] [Google Scholar]
Associated Data
This section collects any data citations, data availability statements, or supplementary materials included in this article.