

Summary
Most macromolecular X-ray structures are determined from cryocooled crystals, but it is unclear whether cryocooling distorts functionally relevant flexibility. Here we compare independently acquired pairs of high-resolution datasets of a model Michaelis complex of dihydrofolate reductase (DHFR), collected by separate groups at both room and cryogenic temperatures. These datasets allow us to isolate the differences between experimental procedures and between temperatures. Our analyses of multiconformer models and time-averaged ensembles suggest that cryocooling suppresses and otherwise modifies sidechain and mainchain conformational heterogeneity, quenching dynamic contact networks. Despite some idiosyncratic differences, most changes from room temperature to cryogenic temperature are conserved, and likely reflect temperature-dependent solvent remodeling. Both cryogenic datasets point to additional conformations not evident in the corresponding room-temperature datasets, suggesting that cryocooling does not merely trap pre-existing conformational heterogeneity. Our results demonstrate that crystal cryocooling consistently distorts the energy landscape of DHFR, a paragon for understanding functional protein dynamics.
Introduction
Although protein molecules are often visualized as static objects, they must adopt multiple conformations to play their physiological roles. Indeed, mutations that preserve the average structure but disrupt protein conformational heterogeneity can impair enzyme function (Bhabha et al., 2011; Fraser et al., 2009). However, multiple conformations in proteins are difficult to characterize in detail by X-ray crystallography, mostly because a crystallographic electron density map represents an average of the ensemble of conformations populated throughout the crystal (Burnley et al., 2012; Lang et al., 2010; Smith et al., 1986; van den Bedem et al., 2009). Crystallographic B-factors combine positional uncertainty and thermal displacements by assuming harmonic motion about average atomic coordinates, but they are incapable of modeling the anharmonic motions that are common in proteins (Fenwick et al., 2014; Kuriyan et al., 1986). The difficulty of interrogating near-native protein conformational heterogeneity from crystallographic data has been a roadblock for applications such as small-molecule inhibitor discovery (Lorber and Shoichet, 1998) and protein engineering (Mandell and Kortemme, 2009).
Recent computational approaches explicitly model previously hidden conformational heterogeneity in all-atom detail from high-resolution (≤1.8 Å) crystallographic data. For example, Ringer samples low-level electron density to reveal secondary sidechain conformations (Lang et al., 2010). Similarly, qFit automatically builds multiconformer models with one conformation for rigid regions, but a few (typically 2-4) conformations that optimally explain the local electron density for flexible regions (van den Bedem et al., 2009). An alternative approach, PHENIX ensemble refinement, fuses molecular dynamics (MD) simulations with crystallographic refinement to obtain an ensemble of tens to hundreds of conformations that collectively fit the data (Burnley et al., 2012). These methods define multiple conformations, but do not define correlations between conformations. To fill this gap, the program CONTACT identifies steric clashes and reliefs between adjacent alternate conformations in multiconformer models to build networks of energetically coupled residues, which are often relevant to protein function (van den Bedem et al., 2013). Similarly, the program MutInf (McClendon et al., 2012) identifies statistically correlated torsion angles in traditional molecular dynamics simulations, and could be adapted to identify correlations in crystallographic ensemble models (Burnley et al., 2012).
These computational methods provide an opportunity to move beyond a single coordinate set and to link multiple conformations of proteins to biological function. Our previous work has revealed significantly increased heterogeneity and conformational coupling in models based on crystallographic data collected at room temperature (RT) instead of the much more common cryogenic temperature (cryo) across more than 30 proteins (Fraser et al., 2011; van den Bedem et al., 2013). Although cryocooling reduces radiation damage during data collection (Juers and Matthews, 2004), detailed analysis for a smaller number of RT/cryo pairs suggested that the conformational heterogeneity suppressed by cryocooling may often be important to the protein’s biological activity (Fraser et al., 2009; Fraser et al., 2011; Rasmussen et al., 1992; van den Bedem et al., 2013). These studies extend previous work that inferred quenched dynamic motions from harmonic crystallographic B-factors. For example, four structures of metmyoglobin at temperatures ranging from 220 to 300 K showed that mean-square atomic displacements increased with temperature (Frauenfelder et al., 1979). Later, datasets at temperatures ranging from 80 to 320 K established the relationship between protein contraction and the glass transition at ~200 K (Frauenfelder et al., 1987; Tilton et al., 1992).
Despite additional analyses of existing RT/cryo pairs (Fraser et al., 2011; Juers and Matthews, 2001) and theoretical predictions of the effects of cryocooling on protein conformational heterogeneity (Halle, 2004), there remain many significant questions about cryocooling. Does the cryocooling process simply trap a subset of the disorder present at room temperature, or does it establish new favorable conformations by perturbing the free energy landscape of the protein in the crystal? Are the structural effects of cryocooling robust and repeatable, or do they depend strongly on the specifics of the process, such as the experimenters and laboratory environment? These questions are difficult to answer by studying a single RT/cryo pair – ideally, multiple datasets at both temperatures would be analyzed to account for experimental variability.
Here we examine two independently collected pairs of high-resolution datasets for a model Michaelis complex of dihydrofolate reductase (DHFR:folate:NADP+). DHFR is an excellent model system: the current paradigm of catalytically linked conformational flexibility in enzymes has been strongly influenced by studies of structural dynamics in DHFR by crystallography and nuclear magnetic resonance (NMR) (Boehr et al., 2006; Falzone et al., 1994; Sawaya and Kraut, 1997). Although many structures of DHFR complexes are available in the PDB as a result of these studies, they include a variety of substrate mimics, inhibitors, etc., and almost all were collected at cryogenic temperature. By contrast, the datasets we compare here all feature the same model Michaelis complex, and were collected by our different laboratories at different synchrotrons in different decades, but have matching space group and unit cell parameters. Overall, our results show that the standard practice of crystal cryocooling idiosyncratically yet reproducibly disrupts the structures of proteins, and thus may limit our ability to derive useful information about the relationship of conformational heterogeneity to biological function.
Results
Isomorphous Difference Density Maps Reveal Idiosyncratic Effects of Cryocooling
To determine whether laboratory or temperature had a larger effect on the conformational heterogeneity of DHFR, we first computed four isomorphous Fo1-Fo2 difference electron density maps: 13cryo minus 05cryo, 13RT minus 05RT, 13RT minus 13cryo, and 05RT minus 05cryo (where, e.g., 13RT indicates the 2013 room-temperature dataset) (Figure 1). We phased each map with the Fo1 qFit model (Table 1).
Figure 1.
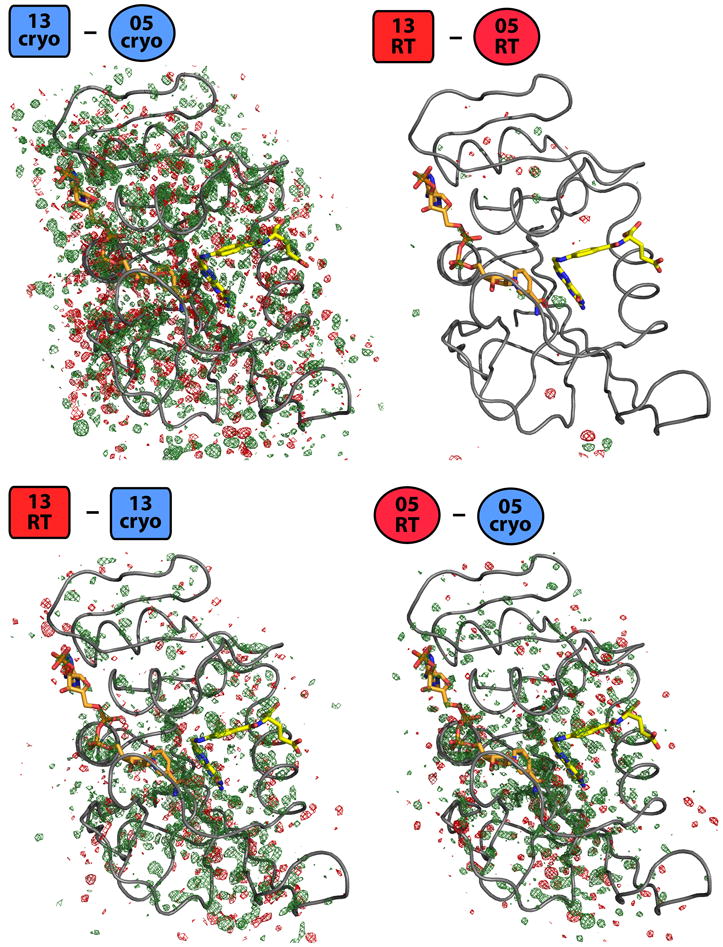
Cryocooling induces changes in DHFR structural heterogeneity. The broad distribution of strong difference peaks in the isomorphous Fo-Fo 13cryo-05cryo map, in contrast to the relative flatness of the 13RT-05RT map, emphasizes that cryogenic freezing perturbed the two crystals differently, resulting in widespread and unpredictable changes to dynamics. Both the 13RT-13cryo and 05RT-05cryo difference density maps have significant peaks of both signs (green: positive, red: negative), suggesting that cryocooling idiosyncratically alters the same protein’s structure and/or dynamics in different crystals at the hands of different crystallographers. All four maps are shown contoured at 0.4 e-/Å3 (van den Bedem et al., 2013), which in these cases corresponds to 2.61, 3.01, 2.43, and 4.55 σ, respectively. NADP+ in orange, folate in yellow. Model shown is qFit model of first structure in Fo-Fo subtraction.
Table 1.
Statistics for crystallographic datasets and qFit models. (Numbers in parentheses are for highest-resolution 10% of reflections.)
| 13RT | 13cryo | 05RT | 05cryo | |
|---|---|---|---|---|
| Resolution range (Å) | 41.34 - 1.35 (1.399 -1.35) | 40.77 - 1.15 (1.19 - 1.15) | 49.36 - 1.05 (1.09 - 1.05) | 40.78 - 0.85 (0.88 - 0.85) |
| Space group | P212121 | P212121 | P212121 | P212121 |
| Unit cell | 34.3 45.5 98.9 90 90 90 | 34.0 44.8 98.2 90 90 90 | 34.4 45.5 98.7 90 90 90 | 34.0 44.8 98.3 90 90 90 |
| Unique reflections | 31891 (1671) | 51212 (3410) | 71709 (6949) | 130114 (12526) |
| Completeness (%) | 91.58 (48.73) | 94.42 (64.25) | 98.24 (96.57) | 98.05 (95.74) |
| Mean I/sigma(I) | 21.7 (2.4) | 22.6 (5.8) | 23.3 (5.1) | 16.8 (2.5) |
| Wilson B-factor | 12.07 | 7.00 | 10.52 | 7.68 |
| Rsym | 0.067 (0.451) | 0.046 (0.281) | 0.045 (0.458) | 0.049 (0.550) |
| Rwork | 0.1268 (0.2044) | 0.1366 (0.1359) | 0.1211 (0.1271) | 0.1546 (0.2839) |
| Rfree | 0.1659 (0.3121) | 0.1573 (0.1848) | 0.1419 (0.1490) | 0.1666 (0.2820) |
| Rgap (Rfree-Rwork) | 0.0391 (0.1077) | 0.0207 (0.0489) | 0.0208 (0.0219) | 0.0120 (-0.0019) |
| Number of non-hydrogen atoms | 3204 | 3184 | 3698 | 3273 |
| macro-molecules | 2875 | 2679 | 3337 | 2764 |
| ligands | 162 | 160 | 162 | 162 |
| water | 167 | 345 | 199 | 347 |
| RMS(bonds) | 0.017 | 0.018 | 0.016 | 0.017 |
| RMS(angles) | 1.54 | 1.69 | 1.61 | 1.71 |
| Ramachandran favored (%) | 98 | 98 | 98 | 98 |
| Ramachandran outliers (%) | 0 | 0 | 0 | 0 |
| Clashscore | 6.47 | 13.04 | 4.07 | 5.63 |
| MolProbity score | 1.463 | 1.625 | 1.300 | 1.414 |
| Average B-factor | 12.4 | 8.0 | 13.3 | 9.8 |
| macro-molecules | 11.5 | 6.5 | 12.2 | 8.1 |
| ligands | 11.2 | 9.6 | 11.5 | 9.6 |
| water | 29.3 | 19.4 | 33.4 | 23.3 |
| Number of protein residues | 159 | 159 | 159 | 159 |
| Number of protein residues with alternate conformations | 141 | 139 | 141 | 142 |
| Average number of alternate conformations per protein residue | 2.8 | 2.7 | 3.2 | 2.7 |
| Average number of alternate conformations per multi-conformer protein residue | 3.0 | 3.0 | 3.5 | 2.9 |
| qFit model PDB code | 4KJK | 4KJJ | 4PST | 4PSS |
| Ensemble PDB code | 4P3Q | 4P3R | 4PTJ | 4PTH |
To facilitate a direct comparison of the four difference maps, we contoured them at the same absolute electron density value of 0.4 e-/Å3 (Lang et al., 2014) (Figure 1). Interestingly, this threshold corresponded to a much lower standard deviation electron density value for the cryo-cryo map (2.43 σ) than for the RT-RT map (4.55 σ) and intermediate values for the two RT-cryo maps (3.01 and 4.55 σ). Thus, the distribution of absolute electron density differences in the cryo-cryo map is broadened relative to the RT-RT map. The electron density differences are also amplified: the cryo-cryo map has very strong and widespread peaks of both signs, but the RT-cryo map is comparatively devoid of peaks (Figure 1), suggesting that cryocooling affected both the 2013 and 2005 crystals to similar extents, but in markedly different ways. The pronounced features of the map comparing cryogenic datasets collected by different labs, in contrast to the relative flatness of the map comparing room-temperature datasets collected by different labs, show that protein structure in crystallo is affected more by cryocooling than by the lab performing the experiment.
Both RT-cryo maps have widespread positive and negative peaks with absolute value >0.4 e-/Å3 (Figure 1). These differences are not attributable to gross structural changes since the qFit models superimpose closely overall (all <0.25 Å Cα RMSD). Rather, they are likely due to altered near-native conformational heterogeneity. The largest peaks in both RT-cryo maps are of similar magnitudes and suggest that the protein is more conformationally heterogeneous in both room-temperature datasets. Nevertheless, the presence of many negative peaks with absolute value >0.4 e-/Å3 distributed throughout DHFR in both RT-cryo maps shows that the disorder present at cryogenic temperature is not simply a trapped subset of the disorder present at room temperature. This finding is consistent with previous comparisons of room-temperature and cryogenic structures (Fraser et al., 2011) and theoretical work on the statistical mechanics of crystal cooling (Halle, 2004). Interestingly, the most pronounced peaks in both RT-cryo maps are located near the interface between the folate substrate and NADP+ cofactor in the active site, suggesting that cryocooling perturbs conformational heterogeneity that may be important for substrate interactions.
Multiconformer Models Have Temperature-Dependent Alternate Conformations
To examine the structural basis of changes implied by the isomorphous difference maps, we compared multiconformer models built using qFit (van den Bedem et al., 2009). This approach fits multiple conformations only where locally supported by the real-space electron density distribution. The structure validation statistics for all four qFit models are similar (Table 1). In agreement with the predominance of positive peaks in the RT-cryo difference maps (Figure 1), the room-temperature models have slightly higher average B-factors, indicating higher thermal mobility. The 05RT structure (0.85 Å) has the greatest number of residues modeled in multiple conformations. Collectively, these results confirm that the protein is more flexible at room temperature than cryogenic temperature and that this flexibility is less discretely observable at slightly lower resolution.
To investigate the basis of these temperature-dependent changes to sidechain ensembles in more detail, we compared all-atom sidechain conformations represented in two ways: in dihedral space by assigning each conformation to a rotamer (Lovell et al., 2000), and in Cartesian space by calculating the maximum root-mean-square deviation (RMSD) across all alternate conformations for each residue. Both methods reveal that cryocooling affects sidechain conformations at a global level in the 2005 and 2013 crystals similarly (Table S1). For both structure pairs, about two thirds of the residues in DHFR are more disordered at room than cryogenic temperature, and roughly 25% adopt entirely new rotamers. Furthermore, about 20% of residues are more disordered at cryogenic than room temperature, and roughly one third of those adopt new rotamers. These results together further support the idea that cryocooling not only selects subsets of pre-existing conformational heterogeneity, which may represent static disorder (Fenwick et al., 2014), but also reshapes the free energy landscape to favor a different set of conformations.
To explore the extent to which cryocooling consistently perturbed the same regions of DHFR, we examined the colocalization of residues with altered conformational heterogeneity. Many of the same residues have altered rotamer ensembles in both the 2013 and 2005 room-temperature/cryogenic pairs (Figure 2). The overlaps in which residues are consistently polymorphic by temperature are statistically significant (Methods), which indicates that cryocooling consistently affects specific regions in a reproducible manner. Despite these consistencies, some of the detailed effects of cryocooling differ between the two experiments. The differences in sidechain and mainchain RMSD between the 2013 room-temperature and cryogenic structures correlate poorly with the corresponding differences in the 2005 structures (Figure 3). This result indicates that cryocooling perturbs the local conformational heterogeneity of many regions idiosyncratically, an interpretation which is further supported by the presence of significant peaks in the cryogenic minus cryogenic isomorphous electron density map as compared to the room-temperature minus room-temperature map (Figure 1).
Figure 2.
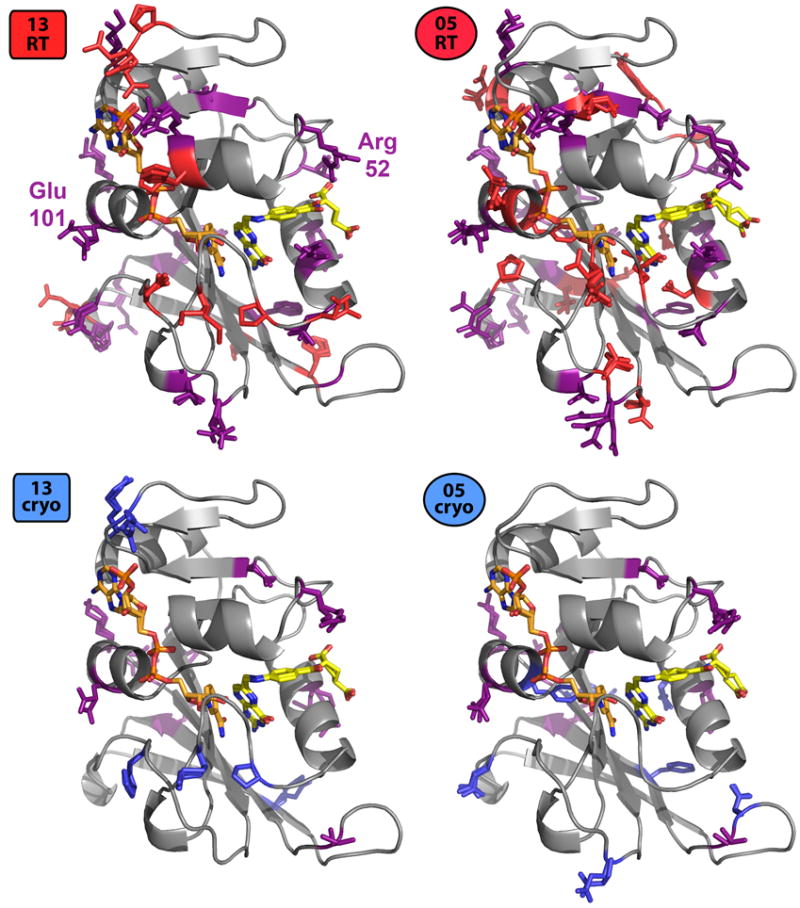
Cryocooling alters sidechain rotamer heterogeneity preferentially in certain protein regions. Many residues have at least one rotamer in the 13RT or 05RT structure that is missing from the corresponding cryo structure (red+purple sidechains, top row). Smaller, but still substantial, sets of residues have at least one rotamer in the 13cryo or 05cryo structure that is missing from the corresponding RT structure (blue+purple sidechains, bottom row). Notably, many of these residues have altered heterogeneity consistently in both the 2013 and 2005 structure pairs (purple sidechains), as opposed to just one or the other. Glu101 (Figure S2) and Arg52 (Figure 6) are labeled in the 13RT panel.
Figure 3.
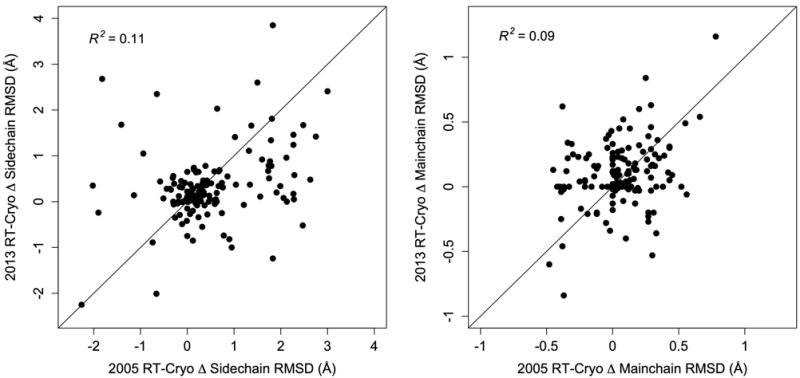
Cryocooling affects sidechain and mainchain conformational heterogeneity idiosyncratically at the detailed level. Changes in the maximum sidechain (left) and mainchain (right) RMSD across all alternate-conformation combinations at each residue from the room-temperature to the cryogenic qFit model are poorly correlated between the 2013 and 2005 pairs. R2 correlation coefficients are from linear least-squares fits. Diagonal lines are for visual comparison.
Time-Averaged Ensembles Show That Loop Heterogeneity is Suppressed by Cryocooling
The multiconformer models from qFit may fail to capture larger-scale conformational disorder present in the crystal, such as helix winding/unwinding and loop opening/closing. To determine if such larger-scale features are present and perturbed by cryocooling, we turned to the recently described phenix.ensemble_refinement method (Burnley et al., 2012). We began with a grid search over the pTLS, wx-ray, and Tx arameters, which balance the scope of the TLS model, the weighting of crystallographic data relative to the MD force field, and the degree of “memory” for calculating rolling-average structure factors during time-resolved MD, respectively (Burnley et al., 2012). The Rfree values were relatively similar across the 75 trial ensembles for each dataset: more than half are within 0.02 of the lowest Rfree for each dataset (Table 2). To test whether cryocooling affected the ensembles and the multiconformer models similarly, we plotted Cα root-mean-square fluctuation (RMSF) against sequence for the lowest-Rfree ensemble for each dataset (Figure S1). However, because many ensembles fit the data nearly equally well for each dataset, we also plotted the average Cα RMSF against sequence for the subset of ensembles with Rfree within 0.02 of the lowest Rfree for each dataset (Figure 4).
Table 2.
Multiconformer qFit models are more parsimonious than ensemble models and are affected by cryocooling-induced lattice shrinking.
| 13RT | 13cryo | 05RT | 05cryo | |
|---|---|---|---|---|
| Ensemble pTLS | 0.55 | 0.775 | 0.775 | 0.55 |
| Ensemble wx-ray | 4.375 | 2.5 | 10.0 | 10.0 |
| Ensemble Tx | 1.0 | 2.0 | 1.0 | 2.0 |
| Ensemble Rfree | 0.1534 | 0.1362 | 0.1655 | 0.1445 |
| qFit model Rfree (from Table 1) | 0.1659 | 0.1573 | 0.1419 | 0.1666 |
| Ensembles with Rfree within 0.02 of lowest Rfree | 51 / 75 (68%) | 61 / 75 (81%) | 38/ 75 (51%) | 53 / 75 (71%) |
| Ensembles with Rfree within 0.01 of lowest Rfree | 44 / 75 (59%) | 31 / 75 (41%) | 6 / 75 (8%) | 35 / 75 (47%) |
| Number of unique reflections | 31,891 | 51,212 | 71,709 | 130,114 |
| Estimated ensemble parameters | 720,198 | 1,152,459 | 545,874 | 1,152,390 |
| Estimated qFit model parameters | 27,996 | 26,931 | 32,287 | 27,722 |
| Ensemble parameters per observation | 22.6 | 22.5 | 7.6 | 8.9 |
| qFit model parameters per observation | 0.9 | 0.5 | 0.5 | 0.2 |
| Number of ensemble water molecules | 188.6 | 87.5 | 184.5 | 103.6 |
| Crystal contact surface area (Å2) | 1685.8 | 2628.5 (+56%) | 2224.9 | 2840.4 (+28%) |
| Number of protein-water contacts | 20746 | 35473 (+71%) | 28954 | 39369 (+36%) |
| Number of protein-water H-bonds | 12333 | 20785 (+69%) | 17019 | 21090 (+24%) |
For qFit models, estimated number of parameters = number of isotropically refined atom positions * 4 (for x, y, z, and 1 parameter for B) + number of anisotropically refined atom positions * 9 (for x, y, z, and 6 parameters for B). For ensemble models, estimated number of parameters = number of models * number of atom positions per model * 3 (for x, y, z). Parameters per observation = number of unique reflections from Table 1 divided by estimated number of parameters. All-atom contacts were calculated using Probe (Word et al., 1999) for all four qFit models. For defining crystal contact surface area, the NADP+ and folate were grouped with the protein but the waters were grouped with the crystal lattice. Protein-water contacts (van der Waals interactions and/or hydrogen bonds) include contacts between the protein and symmetry-related waters.
Figure 4.
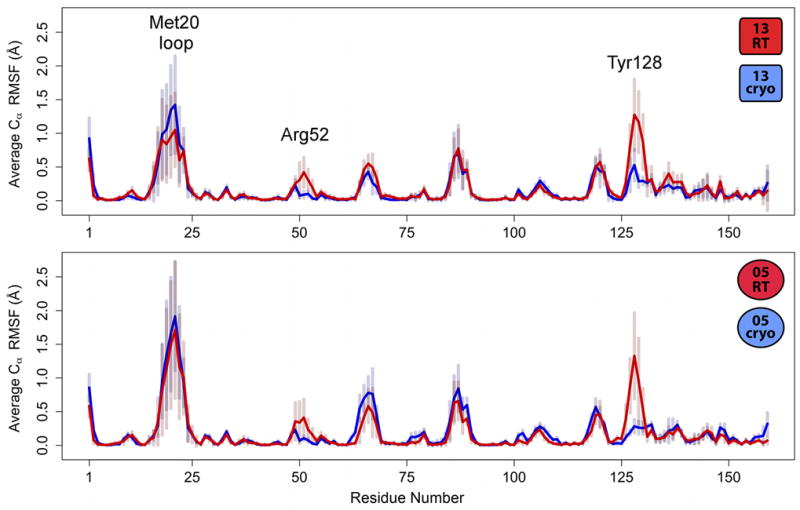
Room-temperature ensembles are consistently more flexible than cryogenic ensembles at several surface loops. Cα RMSF values averaged across the subset of the 75 total ensemble variants for each dataset with Rfree within 0.02 of the lowest Rfree (Table 2) are higher for each room-temperature ensemble (red lines) than the corresponding cryogenic ensemble (blue lines) at Arg52 and Tyr128 (labeled), although standard deviations are substantial (semi-transparent bars). These regions are explored further below (Figure 6, Figure 7). The Met20 loop (labeled) is flexible, but similarly so, in all four averaged traces.
Our analysis cautions against relying solely on the conformational heterogeneity present in any single refined ensemble. For example, the temperature-related difference for the active-site Met20 loop in the lowest-Rfree ensembles (Figure S1) is provocative because this loop interconverts between several well-characterized states (Sawaya and Kraut, 1997) in the catalytic cycle of DHFR (Bhabha et al., 2011; Boehr et al., 2006). In the ensemble with the lowest Rfree value for each of the four datasets, the Met20 loop fluctuates around the closed state observed previously in other ternary enzyme:folate:NADP+ ternary complexes (Sawaya and Kraut, 1997) (Figure S1). While the 13RT ensemble hints at a minor population similar to the occluded state seen in enzyme:folate binary complexes (Sawaya and Kraut, 1997), this is likely due to the lowest-Rfree ensemble using a combination of input parameters that down-weights the contribution of crystallographic data (relatively low wx-ray and Tx; see Table 2). In contrast to the Met20 loop, the differences induced by temperature change in the Arg52 and Tyr128 loops persist in the averaged traces (Figure S1, Figure 4), confirming that they are robust to parameter choice in the ensemble refinements. Taken as a whole, the time-averaged ensembles support the idea that cryocooling reduces protein flexibility, especially at specific surface regions.
Unit Cell Shrinking and Water Freezing Dampen Flexibility at the Protein Surface
The above comparisons of multiconformer models and time-averaged ensembles strongly suggest that cryocooling both traps and redistributes protein conformations, but do not directly suggest a mechanism of perturbation. Comparison of the cryogenic and room-temperature datasets reveals that cryocooling reduced both the 2013 and 2005 unit cell volumes by 3.0%, consistent with previous studies of temperature-dependent protein crystal shrinking (Fraser et al., 2011; Frauenfelder et al., 1987; Juers and Matthews, 2001). This change increases the surface area of lattice contacts by 56% in the 2013 and 28% in the 2005 qFit structures (Table 2). Second, both the cryogenic structures have approximately twice as many modeled waters as the room-temperature structures (Table 1, Figure 5). A large proportion of these additional waters make contacts with the protein surface, often via hydrogen bonds (Table 2), and contribute to lattice contacts. This ordering of surface-associated waters is driven by cryocooling, not increased resolution, as evidenced by the lower-resolution (1.15 Å) 13cryo structure having ~70% more ordered waters than the higher-resolution (1.05 Å) 05RT structure (Table 1). Average B-factors for cryogenic waters without a corresponding room-temperature water are higher (22.7 and 28.1 Å2 for 13cryo and 05cryo) than for those with a corresponding room-temperature water (1.5 Å or closer) (14.4 and 18.8 Å2); thus, waters ordered uniquely by cryocooling may be somewhat more mobile (supplementary movies).
Figure 5.
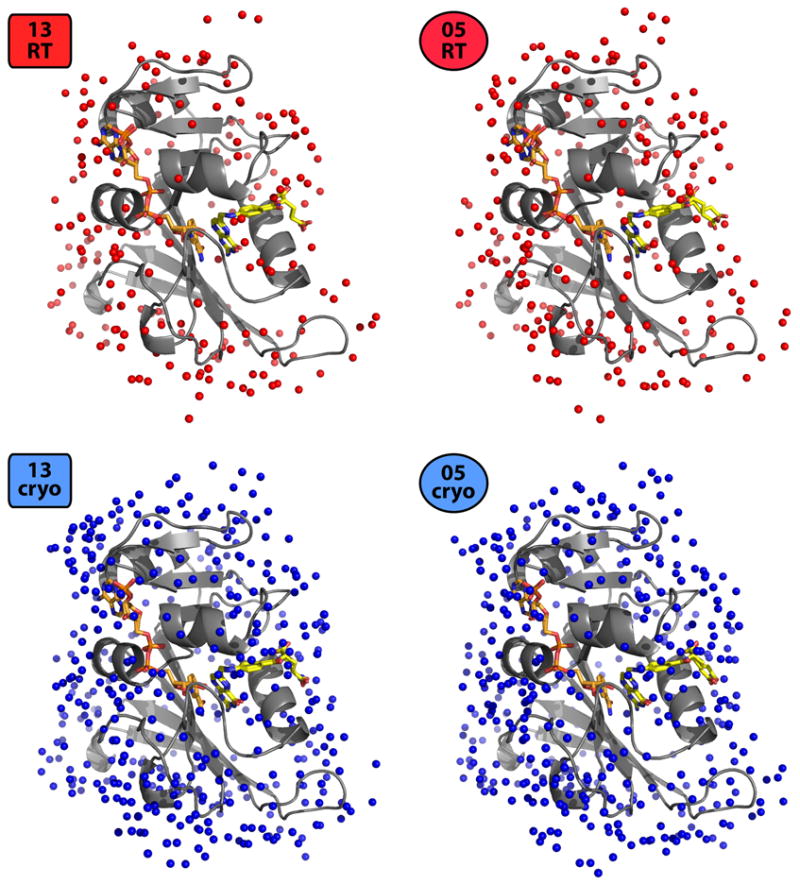
Cryocooling rigidifies solvent molecules surrounding DHFR. The 13RT and 05RT structures have dramatically fewer ordered water molecules (red spheres) than the 13cryo and 05cryo structures (blue spheres) (see also Table 1). NADP+ and folate coloring as in Figure 1.
Unit cell contraction from crystal cryocooling conformationally restricts many waters in the narrowing channels between neighboring protein molecules in the lattice, which interestingly precludes some previously accessible alternate protein sidechain conformations. For example, Glu101 adopts χ1 t and m rotamers in both room-temperature structures, but only χ1 m rotamers in both cryogenic structures; this is because of the presence of a frozen water that sterically prevents any χ1 t rotamers (Figure S2). Another example is Arg52 (labeled in Figure 4), which is positioned next to both the folate substrate and a crystal lattice interface (Figure 6). Cryocooling causes a series of alterations to the local energy landscape: Asp87* switches rotamers to point away from Arg52, allowing Arg52 to move into this vacated space with a new rotamer (ptp85) and form previously nonexistent hydrogen bonds with Asp70*. The rotamer that placed Arg52 near the folate substrate in the room-temperature structures (ptt85/ptt-85) is abandoned in the cryogenic structures; a frozen water substitutes for any electrostatic interactions between the guanidinium moiety and the substrate.
Figure 6.
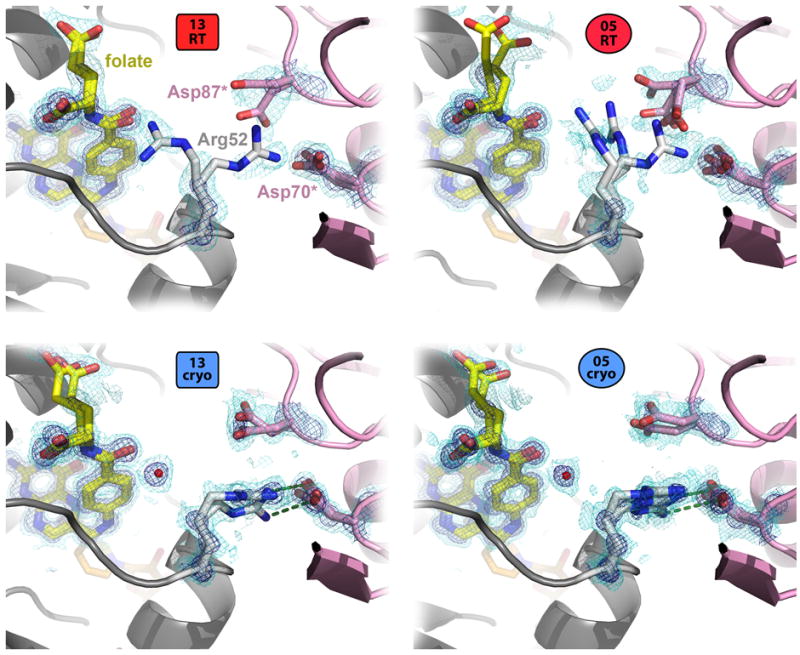
Shifted crystal contacts in cryogenic structures favor a new Arg52 sidechain conformation. In the 13RT and 05RT structures, Arg52 (gray, center) adopts rotamers that point toward folate (yellow), and that point toward the crystal lattice neighbor (pink) but are not close enough to be properly positioned for a hydrogen bond. By contrast, in both the 13cryo and 05cryo structures, the Cβ-Cβ distance to the nearest lattice residue (Asp70*) shrinks from 9.3 to 8.7 Å for the 2013 structures and from 9.0 to 8.7 Å for the 2005 structures. As a result, the lattice copy of Asp87 (Asp87*) shifts upward in this view such that Arg52 can adopt a new rotamer that forms hydrogen bonds (green dotted lines) to the lattice copy of Asp70 (Asp70*). A water molecule (red sphere) takes the place of the room-temperature rotamer near the folate. 2mFo-DFc electron density contoured at 1.9 σ (dark blue) and 0.6 σ (light blue) supports the modeled sidechain and water positions in all four qFit structures.
In addition to these sidechain changes, we observe several mainchain alterations. For example, the 126-130 loop is more flexible in both room-temperature time-averaged ensembles (Figure 7). The temperature dependence appears to be due to the appearance in both cryogenic ensembles of new ordered water molecules that bridge the polar sidechain moieties of Asp127 and Glu129 via a small local hydrogen-bond network, thereby stabilizing a more rigid loop conformation. In the room-temperature ensembles, this region is unconstrained by these waters, and samples conformations that explore the adjacent solvent-exposed channel in the crystal (upper-left in Figure 7).
Figure 7.
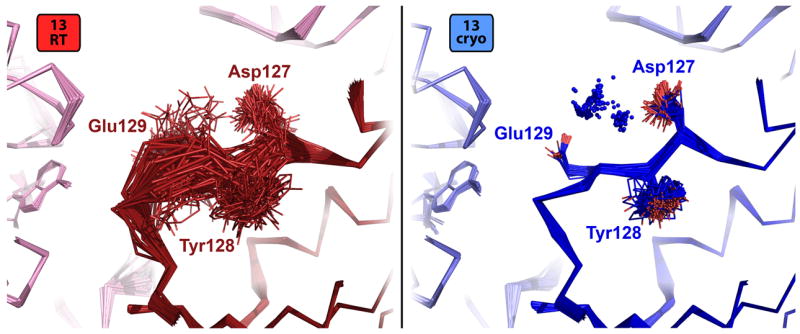
Cryogenically ordered water molecules induce ensemble loop ordering. The surface-exposed loop encompassing Asp127, Tyr128, and Glu129 is very flexible in the lowest-Rfree 13RT ensemble (red, left panel) because it is relatively unconstrained by contacts to crystal lattice mates (left and top in this view, light pink). By contrast, consistently modeled ordered waters (blue spheres) unique to the cryogenic ensemble (blue, right panel) bridge the polar Asp127 and Glu129 sidechains via hydrogen bonds to stabilize a more unique loop conformation. This phenomenon is extremely similar for the 05RT and 05cryo models (not shown).
Networks of Coupled Conformational Heterogeneity Are Quenched at Cryogenic Temperature
The results above suggest that cryocooling both suppresses pre-existing conformations and introduces new ones for many residues, particularly at the protein surface. To investigate whether these localized effects also impact collective intramolecular conformational heterogeneity, we used CONTACT, which propagates steric clash-relief pairs between alternate conformations (van den Bedem et al., 2013). Pathways of residues that participate in these clash-relief pairs are then connected into networks of residues that may be mutually conformationally coupled. This method previously identified a central dynamic contact network linking the two subdomains of DHFR via the active-site NADP+ cofactor, which was corroborated by NMR chemical shift changes induced by a mutation that impairs enzyme function (G121V) (Boehr et al., 2013).
The higher-resolution 05RT qFit model has more abundant and longer pathways than the lower-resolution 13RT qFit model (Table S2). Of particular note is the folate substrate, which is more flexible in the higher-resolution 05RT model (0.62 > 0.31 Å RMSD between heavy-atom positions in the two modeled alternate conformations). As a result, CONTACT detects a clash-relief event involving the folate and places the folate in the aforementioned central network in the 05RT, but not the 13RT, model (Figure 8). This important network is not evident in either cryogenic model (Figure 8).
Figure 8.
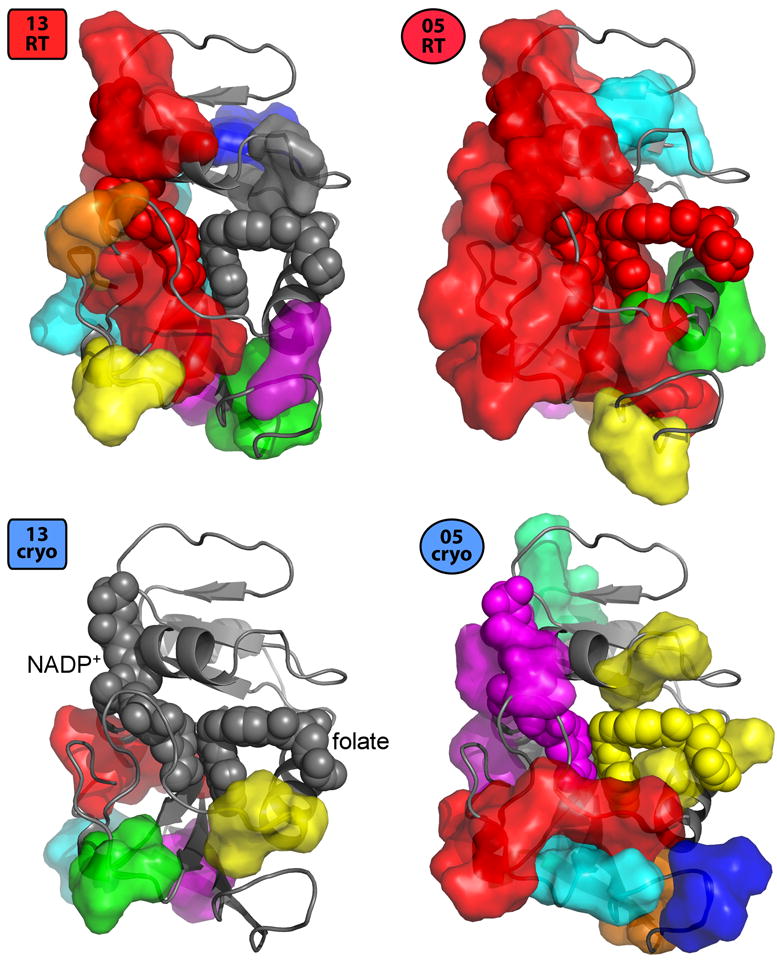
Temperature dependence of coupled conformational heterogeneity linking the two subdomains of DHFR. The largest dynamic CONTACT network (red) from both the 13RT and 05RT qFit models spans the two subdomains (top vs. bottom in this view) via one or both of the NADP+ cofactor and folate substrate (spheres, labeled for 13cryo) in the active site (van den Bedem et al., 2013). By contrast, using the same Tstress values (Methods) as input to CONTACT, none of the networks (different colors) from the corresponding 13cryo and 05cryo models connect the two subdomains via the active site.
Changes in network statistics for the two room-temperature/cryogenic pairs are quite similar (Table S2). For example, both room-temperature structures have more than 130 unique pathways, but both cryogenic structures are reduced to having only about 40. Similarly, the pathways shrink on average in the cryogenic structures, with 21% and 39% decreases in average pathway length. These results together imply that cryocooling perturbs DHFR’s energy landscape similarly in both crystals, fragmenting collective conformational heterogeneity – including known functional networks – into smaller pockets.
Discussion
The paired room-temperature and cryogenic DHFR datasets presented here provide a unique opportunity to explore the effects of cryocooling on protein crystals. In large part, the conformational heterogeneity in each cryogenic structure is a subset of that in the corresponding room-temperature structure, as shown by multiconformer rotamer analysis and ensemble RMSF traces. However, both the rotamer analysis and the RT-cryo isomorphous electron density maps also show that some conformations are unique to the cryogenic structures. Unit cell shrinking and the dramatic increase in ordered water suggest how at least some of these new conformations are induced: crystal contacts and/or hydrogen bonds with new waters stabilize new surface sidechain conformations in lieu of previously populated conformations with more intramolecular interactions (Tyka et al., 2011). These results are in line with MD simulations with the solvent at a different temperature from the protein, which showed that solvent mobility is the dominant factor in determining differences in protein surface flexibility across the glass transition (Vitkup et al., 2000).
These changes in solvent ordering and surface residue conformations seem to propagate to the rest of the protein, as evidenced by the ablation of intramolecular dynamic CONTACT networks in both cryogenic qFit models relative to their room-temperature counterparts – in other words, crystal cryocooling likely distorts functional protein conformational heterogeneity “from the outside in”. This may be in part because evolution has selected the sequence of DHFR to populate correlated states at physiological temperature (Halabi et al., 2009), but has not had an opportunity to act upon the new cryocooling-induced states of that same polypeptide chain. It remains unclear how the effects of cryocooling could be transmitted from surface sidechains and waters to intramolecular networks in these crystals. For example, residues with altered rotamers at cryogenic temperature and residues omitted from the primary functional network do not colocalize more than expected. However, both of these sets of residues could potentially be refined by methodological advances: improved sidechain and backbone sampling in qFit may reveal more alternate rotamers and remove false positives, and improved CONTACT analysis with ionic bonds, covalent strain, and consideration of water molecules may more accurately define conformational coupling between residues. Furthermore, independent methods that probe correlated motions, such as NMR (Sekhar and Kay, 2013; Szyperski and Mills, 2011) and MD (Brandman et al., 2012; McClendon et al., 2012), could be used as a complementary way to study these transitions across a wide temperature range.
In conjunction with empirical observations such as those described here, more powerful theoretical frameworks would be useful for elucidating the physical/material properties of protein molecules. Further parallels may be drawn between the “freezing out” of protein and water atoms and concomitant quenching of dynamic contact networks (van den Bedem et al., 2013) and conformational heterogeneity indicative of motions on the ps-ns timescale (Fenwick et al., 2014). Percolation theory is widely used to describe phenomena in which connections are made between local sites until a continuous path is created that spans the entire system. Percolation models have proven useful for understanding the sudden transition from the very sparse “connection network” of an unfolded protein to the relatively dense network of a folded protein structure (Antal et al., 2009). Therefore, percolation theory may find fruitful application to other phase-change-like phenomena in proteins, such as the rigidification of protein and water atoms due to crystal cryocooling. In particular, CONTACT analysis of correlated sidechain motion closely resembles a bond percolation model of protein disorder and may be amenable to quantitative treatment using existing tools from percolation theory.
Reducing temperature from 273 K to 100 K shifts conformational distributions to favor low-entropy, low-enthalpy states (Halle, 2004). This effect is consistent with the switch at Arg52 from multiple rotamers and disordered solvent at room temperature to a single hydrogen-bonded rotamer and ordered solvent at cryogenic conditions. However, because of kinetic effects, datasets based on cryocooled crystals at 100 K do not reflect the Boltzmann ensemble at 100 K; rather, different degrees of freedom correspond to different effective temperatures (Halle, 2004). As a result, some of the populations we observe here could be as strongly influenced by kinetic trapping at the glass transition as by the location of free energy minima, confounding our ability to decipher their physical origin. Attempts have been made to anneal crystals to true minimum-free-energy low-temperature states with cycles of warming and cooling (Juers et al., 2007). However, it can be difficult to empirically identify a suitable cryoprotectant to cause bulk solvent to contract in lockstep with protein in order to reduce lattice contact remodeling (Juers and Matthews, 2001, 2004). It is also possible that the addition of cryoprotectant (both the 05cryo and 13cryo crystals were supplemented with PEG 400) is responsible for some of the observed effects in these crystals. By contrast, the room-temperature datasets studied here are free from cryoprotectant- and cryocooling-induced distortions, and show no evidence of unusual radiation damage. Continuing development of methods for predicting, detecting, and accounting for radiation damage (Diederichs et al., 2003; Garman and Weik, 2013; Southworth-Davies et al., 2007) should help facilitate future room-temperature studies of other systems. The capabilities of X-ray free electron lasers are already allowing damage-free data collection at ambient temperatures and revealing distinct conformations and patterns of thermal motions relative to cryocooled datasets (Liu et al., 2013).
The qFit multiconformer and PHENIX ensemble models provide complementary ways to explore temperature-paired datasets. These two representations agree in suggesting that cryocooling significantly diminishes conformational heterogeneity and in pointing to water ordering as a major contributing factor. Both methods are under active development and our results highlight several areas for future improvements. For example, qFit models fail to explore more than very subtle backbone flexibility. Ensembles, by contrast, can capture larger-scale loop flexibility, but suffer other problems: they are potentially overfit/underdetermined due to the large number of parameters relative to the smaller number of crystallographic observations, and methods are needed to elucidate the relationships between subsets of models within the ensemble (such as MutInf for longer MD trajectories (McClendon et al., 2012)). Furthermore, both methods (as well as CONTACT network analysis) may be subject to the idiosyncrasies of particular combinations of input parameters. Exploring the model selection tradeoffs between the parsimony of multiconformer models and the conformational expressiveness of ensembles will be an important area of future research. Nevertheless, in this study the multiconformer and ensemble representations in their current states of development paint a cohesive picture of how cryocooling perturbs protein energy landscapes.
Cryocooling protein crystals perturbs protein energy landscapes in ways that are difficult to predict at the detailed atomic level. In DHFR, this phenomenon alters the preferred conformations of sidechains buttressing the substrate and suppresses a dynamic contact network bridging the adenine binding domain, cofactor, and active site. In other systems, cryocooling may also introduce obstacles to extracting a fundamental understanding of biological mechanism from crystallographic data. We show here that the general trends of protein compression and water ordering are consistent, but that different crystals of the same protein can respond somewhat idiosyncratically. It may be possible to leverage our observations of these DHFR crystals to explore the feasibility of reversing cryocooling in silico for other systems by performing molecular dynamics or Monte Carlo simulations with the crystal lattice present. “Warming up the PDB” in this way may shed new light onto the details of temperature-dependent perturbations to first-shell solvent, protein surfaces, and lattice interfaces.
Methods
Protein Expression, Purification, Crystallization, Data Collection, and Initial Refinement
The 2013 datasets were taken from previous work (van den Bedem et al., 2013). Briefly, crystals for both datasets were grown by the hanging drop method with a well solution consisting of 100 mM HEPES pH 7.5, 21% PEG 8000, 200 mM MgCl2. Diffraction data were collected at the Advanced Light Source (ALS, Berkeley, CA), beamline 8.3.1. “Room-temperature” data were collected with the cryojet stream set to 273 K; there were no signs of radiation damage. Cryogenic data were collected after addition of 10% PEG 400 to the mother liquor with the cryojet stream set to 100 K. Molecular replacement was performed with Phaser using the 1.8 Å resolution crystal structure of the E. coli DHFR-folate-NADP+ complex (PDB accession code 1RX2) determined by Sawaya and Kraut (Sawaya and Kraut, 1997); subsequent initial refinement was performed in the PHENIX GUI (Adams et al., 2010).
The 2005 datasets have not been previously reported. Briefly, E. coli DHFR from a previously described construct (Cameron and Benkovic, 1997) was expressed and purified (see supplemental Methods). Folate and NADP+ were added, and crystals were grown by the hanging drop method with a well solution consisting of 17% PEG 400, 20 mM imidazole pH 7.0, 125 mM MnCl2. For the 100 K dataset, PEG 400 was added to a final concentration of 30% for cryoprotection. X-ray diffraction data were collected at the Stanford Synchrotron Radiation Laboratory (SSRL, Palo Alto, CA), beamline 11-1. Further details are available as supplemental Methods.
Multiconformer Model Building and Analysis
Using the initial 2013 and 2005 room-temperature and cryogenic models, qFit was run to identify alternate conformations and construct all-atom, multiconformer models. For the 2013 models, PHENIX version 1.8-1069 was used; for the 2005 models in this work, PHENIX 1.8.4-1496 was used. A few small adjustments were made to the models after qFit refinement. For the 13RT qFit model, one calcium atom was moved to a symmetry-related position to match a manganese position in the 2005 models. Then, for both 2013 models, all atoms (including water molecules) were relabeled chain A, and hydrogens were re-optimized using phenix.reduce. Although PHENIX by default now uses hydrogens based on electron-cloud centers instead of hydrogen nucleus positions, CONTACT (see below) is designed with the previously utilized nuclear positions, so we used nuclear hydrogen positions in our qFit models. See Table 1 for final model statistics. MolProbity 3 (Chen et al., 2010), including Probe (Word et al., 1999) with nuclear hydrogen positions (as opposed to electron-cloud-based positions), was used to calculate clashscores (Word et al., 1999), MolProbity scores (Chen et al., 2010), and crystal contact dots. Compared to the ensemble refinement, these models fit the data slightly less well (2-3% worse Rfree) for three of the four cases here; the higher-resolution (2005) room-temperature dataset is the only one of the four for which the qFit model is in better fit to the diffraction data. The Rfree values are sensitive to small changes; for example, changing the occupancies of metal ions in the 13cryo model from 100% as in the (previously published) 13RT model to 50% led to Rfree changes on the order of 0.15-0.20. We therefore caution against over-interpretation of small Rfree differences between our models. All qFit and ensemble models fit the data better than single-conformation models.
Calculation of Isomorphous Difference Density Maps
To generate Fo-Fo isomorphous difference density maps, we first used the “Find alternate-origin symmetry mate” utility in the PHENIX GUI to place the 13cryo and both 2005 models in the same frame of reference as the 13RT model. We then used the “Isomorphous difference map” utility in the PHENIX GUI to generate the Fo-Fo map coefficients in MTZ format.
Analysis of Changes to Flexibility of Individual Sidechains and Mainchain Segments
Sidechain rotamers were computed using phenix.rotalyze. “Outlier” conformations that fall outside of well-populated “rotameric” regions of dihedral space often suggest difficulty in fitting a more common conformation, perhaps due to increased disorder, and may in some cases be valid conformations supported by local enthalpic interactions, so they were counted as different rotamers for the purposes of compiling these statistics. The statistical significance of colocalization of residues with altered rotamers was assessed by the probability of uncorrelated residues showing an overlap at least as large as that observed (p < 10-5 for both RT and cryo comparisons), as derived from a one-tailed Fisher’s exact test based on the hypergeometric distribution (Rivals et al., 2007).
Residue-level sidechain and mainchain root-mean-square deviations (RMSDs) were derived by computing an RMSD between the heavy atoms in a given residue for every pair of alternate combinations for that residue, then taking the maximum. This quantifies the degree of dissimilarity among conformations identified by qFit for a given residue, which we use here as a measure of flexibility.
CONTACT Analysis of Networks of Coupled Conformational Heterogeneity
We used all four qFit models as input to CONTACT (van den Bedem et al., 2013), which builds networks of coupled conformational heterogeneity. Briefly, if one conformation of residue 1 clashes with a conformation of a neighboring residue 2, a pathway is propagated from residue 1 to residue 2 if another conformation at residue 2 alleviates that clash. Pathways are continued in this way until a final clash is either relieved or cannot be relieved. Finally, these all-atom pathways are merged to create a smaller set of unique residue-level pathways; each set of residue-level pathways with at least partial overlaps of constituent residues is defined as a network. Details on parameter choices are available as supplemental Methods.
Calculation and Analysis of PHENIX Ensembles
Time-averaged ensembles were generated with phenix.ensemble_refinement in PHENIX version 1.8.4-1496. For the 2013 datasets, the input models were PDB codes 4KJJ (cryogenic) and 4KJK (room-temperature), with alternate conformations removed. A grid search was performed by repeating the simulation with five values of pTLS from 0.1 to 1.0, five values of wx-ray from 2.5 to 10, and three values of Tx from 1.0 to 2.0; the ensemble with the lowest Rfree for each dataset was used for most analyses here.
Supplementary Material
Highlights.
Two room-temperature vs. two cryogenic DHFR X-ray datasets differ consistently
Crystal cryocooling both traps preexisting conformations and favors new ones
Solvent ordering drives surface changes in both multiconformer and ensemble models
Functionally important intramolecular networks are evident only at room temperature
Acknowledgments
We thank Rahel Woldeyes and other Fraser lab members for helpful comments; Peter Wright and Gira Bhabha for discussions about DHFR; Tom Burnley for ensemble analysis scripts; James Holton, George Miegs, and Jane Tanamachi for technical support at ALS; and Nat Echols for PHENIX support. JSF is supported by NIH OD009180, GM110580, and NSF STC-1231306. HvdB is supported by the US National Institute of General Medical Sciences Protein Structure Initiative (U54GM094586) at the Joint Center for Structural Genomics and a SLAC National Accelerator Laboratory LDRD (Laboratory Directed Research and Development) Grant SLAC-LDRD-0014-13-2. DAS is supported by NIH GM081879. GAP and DR are supported by NIH GM32415. MAW is supported by NIH GM092999.
Diffraction data were collected at the Advanced Light Source, which is supported by the Director, Office of Science, Office of Basic Energy Sciences, of the U.S. Department of Energy under Contract No. DE-AC02-05CH11231, and at the Stanford Synchrotron Radiation Lightsource, SLAC National Accelerator Laboratory, which is supported by the U.S. Department of Energy, Office of Science, Office of Basic Energy Sciences under Contract No. DE-AC02-76SF00515. The SSRL Structural Molecular Biology Program is supported by the DOE Office of Biological and Environmental Research, and by the National Institutes of Health, National Institute of General Medical Sciences (including P41GM103393). This collaboration was catalyzed at a symposium convened by Tom Alber, doctoral student of G.A.P. and doctoral advisor to J.S.F. We dedicate this manuscript to Tom.
Footnotes
Publisher's Disclaimer: This is a PDF file of an unedited manuscript that has been accepted for publication. As a service to our customers we are providing this early version of the manuscript. The manuscript will undergo copyediting, typesetting, and review of the resulting proof before it is published in its final citable form. Please note that during the production process errors may be discovered which could affect the content, and all legal disclaimers that apply to the journal pertain.
References
- Adams PD, Afonine PV, Bunkoczi G, Chen VB, Davis IW, Echols N, Headd JJ, Hung LW, Kapral GJ, Grosse-Kunstleve RW, et al. PHENIX: a comprehensive Python-based system for macromolecular structure solution. Acta crystallographica Section D, Biological crystallography. 2010;66:213–221. doi: 10.1107/S0907444909052925. [DOI] [PMC free article] [PubMed] [Google Scholar]
- Antal MA, Bode C, Csermely P. Perturbation waves in proteins and protein networks: applications of percolation and game theories in signaling and drug design. Current protein & peptide science. 2009;10:161–172. doi: 10.2174/138920309787847617. [DOI] [PubMed] [Google Scholar]
- Bhabha G, Lee J, Ekiert DC, Gam J, Wilson IA, Dyson HJ, Benkovic SJ, Wright PE. A dynamic knockout reveals that conformational fluctuations influence the chemical step of enzyme catalysis. Science. 2011;332:234–238. doi: 10.1126/science.1198542. [DOI] [PMC free article] [PubMed] [Google Scholar]
- Boehr DD, McElheny D, Dyson HJ, Wright PE. The dynamic energy landscape of dihydrofolate reductase catalysis. Science. 2006;313:1638–1642. doi: 10.1126/science.1130258. [DOI] [PubMed] [Google Scholar]
- Boehr DD, Schnell JR, McElheny D, Bae SH, Duggan BM, Benkovic SJ, Dyson HJ, Wright PE. A distal mutation perturbs dynamic amino acid networks in dihydrofolate reductase. Biochemistry. 2013;52:4605–4619. doi: 10.1021/bi400563c. [DOI] [PMC free article] [PubMed] [Google Scholar]
- Brandman R, Brandman Y, Pande VS. A-site residues move independently from P-site residues in all-atom molecular dynamics simulations of the 70S bacterial ribosome. PloS one. 2012;7:e29377. doi: 10.1371/journal.pone.0029377. [DOI] [PMC free article] [PubMed] [Google Scholar]
- Burnley BT, Afonine PV, Adams PD, Gros P. Modelling dynamics in protein crystal structures by ensemble refinement. eLife. 2012;1:e00311. doi: 10.7554/eLife.00311. [DOI] [PMC free article] [PubMed] [Google Scholar]
- Cameron CE, Benkovic SJ. Evidence for a functional role of the dynamics of glycine-121 of Escherichia coli dihydrofolate reductase obtained from kinetic analysis of a site-directed mutant. Biochemistry. 1997;36:15792–15800. doi: 10.1021/bi9716231. [DOI] [PubMed] [Google Scholar]
- Chen VB, Arendall WB, 3rd, Headd JJ, Keedy DA, Immormino RM, Kapral GJ, Murray LW, Richardson JS, Richardson DC. MolProbity: all-atom structure validation for macromolecular crystallography. Acta crystallographica Section D, Biological crystallography. 2010;66:12–21. doi: 10.1107/S0907444909042073. [DOI] [PMC free article] [PubMed] [Google Scholar]
- Diederichs K, McSweeney S, Ravelli RB. Zero-dose extrapolation as part of macromolecular synchrotron data reduction. Acta crystallographica Section D, Biological crystallography. 2003;59:903–909. doi: 10.1107/s0907444903006516. [DOI] [PubMed] [Google Scholar]
- Falzone CJ, Wright PE, Benkovic SJ. Dynamics of a flexible loop in dihydrofolate reductase from Escherichia coli and its implication for catalysis. Biochemistry. 1994;33:439–442. doi: 10.1021/bi00168a007. [DOI] [PubMed] [Google Scholar]
- Fenwick RB, van den Bedem H, Fraser JS, Wright PE. Integrated description of protein dynamics from room-temperature X-ray crystallography and NMR. Proceedings of the National Academy of Sciences of the United States of America. 2014;111:E445–454. doi: 10.1073/pnas.1323440111. [DOI] [PMC free article] [PubMed] [Google Scholar]
- Fraser JS, Clarkson MW, Degnan SC, Erion R, Kern D, Alber T. Hidden alternative structures of proline isomerase essential for catalysis. Nature. 2009;462:669–673. doi: 10.1038/nature08615. [DOI] [PMC free article] [PubMed] [Google Scholar]
- Fraser JS, van den Bedem H, Samelson AJ, Lang PT, Holton JM, Echols N, Alber T. Accessing protein conformational ensembles using room-temperature X-ray crystallography. Proceedings of the National Academy of Sciences of the United States of America. 2011;108:16247–16252. doi: 10.1073/pnas.1111325108. [DOI] [PMC free article] [PubMed] [Google Scholar]
- Frauenfelder H, Hartmann H, Karplus M, Kuntz ID, Jr, Kuriyan J, Parak F, Petsko GA, Ringe D, Tilton RF, Jr, Connolly ML, et al. Thermal expansion of a protein. Biochemistry. 1987;26:254–261. doi: 10.1021/bi00375a035. [DOI] [PubMed] [Google Scholar]
- Frauenfelder H, Petsko GA, Tsernoglou D. Temperature-dependent X-ray diffraction as a probe of protein structural dynamics. Nature. 1979;280:558–563. doi: 10.1038/280558a0. [DOI] [PubMed] [Google Scholar]
- Garman EF, Weik M. Radiation damage to biological macromolecules: some answers and more questions. Journal of synchrotron radiation. 2013;20:1–6. doi: 10.1107/S0909049512050418. [DOI] [PubMed] [Google Scholar]
- Halabi N, Rivoire O, Leibler S, Ranganathan R. Protein sectors: evolutionary units of three-dimensional structure. Cell. 2009;138:774–786. doi: 10.1016/j.cell.2009.07.038. [DOI] [PMC free article] [PubMed] [Google Scholar]
- Halle B. Biomolecular cryocrystallography: structural changes during flash-cooling. Proceedings of the National Academy of Sciences of the United States of America. 2004;101:4793–4798. doi: 10.1073/pnas.0308315101. [DOI] [PMC free article] [PubMed] [Google Scholar]
- Juers DH, Lovelace J, Bellamy HD, Snell EH, Matthews BW, Borgstahl GE. Changes to crystals of Escherichia coli beta-galactosidase during room-temperature/low-temperature cycling and their relation to cryo-annealing. Acta crystallographica Section D, Biological crystallography. 2007;63:1139–1153. doi: 10.1107/S0907444907045040. [DOI] [PubMed] [Google Scholar]
- Juers DH, Matthews BW. Reversible lattice repacking illustrates the temperature dependence of macromolecular interactions. Journal of molecular biology. 2001;311:851–862. doi: 10.1006/jmbi.2001.4891. [DOI] [PubMed] [Google Scholar]
- Juers DH, Matthews BW. Cryo-cooling in macromolecular crystallography: advantages, disadvantages and optimization. Quarterly reviews of biophysics. 2004;37:105–119. doi: 10.1017/s0033583504004007. [DOI] [PubMed] [Google Scholar]
- Kuriyan J, Petsko GA, Levy RM, Karplus M. Effect of anisotropy and anharmonicity on protein crystallographic refinement. An evaluation by molecular dynamics Journal of molecular biology. 1986;190:227–254. doi: 10.1016/0022-2836(86)90295-0. [DOI] [PubMed] [Google Scholar]
- Lang PT, Holton JM, Fraser JS, Alber T. Protein structural ensembles are revealed by redefining X-ray electron density noise. Proceedings of the National Academy of Sciences of the United States of America. 2014;111:237–242. doi: 10.1073/pnas.1302823110. [DOI] [PMC free article] [PubMed] [Google Scholar]
- Lang PT, Ng HL, Fraser JS, Corn JE, Echols N, Sales M, Holton JM, Alber T. Automated electron-density sampling reveals widespread conformational polymorphism in proteins. Protein science : a publication of the Protein Society. 2010;19:1420–1431. doi: 10.1002/pro.423. [DOI] [PMC free article] [PubMed] [Google Scholar]
- Liu W, Wacker D, Gati C, Han GW, James D, Wang D, Nelson G, Weierstall U, Katritch V, Barty A, et al. Serial femtosecond crystallography of G protein-coupled receptors. Science. 2013;342:1521–1524. doi: 10.1126/science.1244142. [DOI] [PMC free article] [PubMed] [Google Scholar]
- Lorber DM, Shoichet BK. Flexible ligand docking using conformational ensembles. Protein science : a publication of the Protein Society. 1998;7:938–950. doi: 10.1002/pro.5560070411. [DOI] [PMC free article] [PubMed] [Google Scholar]
- Lovell SC, Word JM, Richardson JS, Richardson DC. The penultimate rotamer library. Proteins. 2000;40:389–408. [PubMed] [Google Scholar]
- Mandell DJ, Kortemme T. Backbone flexibility in computational protein design. Current opinion in biotechnology. 2009;20:420–428. doi: 10.1016/j.copbio.2009.07.006. [DOI] [PubMed] [Google Scholar]
- McClendon CL, Hua L, Barreiro A, Jacobson MP. Comparing Conformational Ensembles Using the Kullback-Leibler Divergence Expansion. Journal of chemical theory and computation. 2012;8:2115–2126. doi: 10.1021/ct300008d. [DOI] [PMC free article] [PubMed] [Google Scholar]
- Rasmussen BF, Stock AM, Ringe D, Petsko GA. Crystalline ribonuclease A loses function below the dynamical transition at 220 K. Nature. 1992;357:423–424. doi: 10.1038/357423a0. [DOI] [PubMed] [Google Scholar]
- Rivals I, Personnaz L, Taing L, Potier MC. Enrichment or depletion of a GO category within a class of genes: which test? Bioinformatics. 2007;23:401–407. doi: 10.1093/bioinformatics/btl633. [DOI] [PubMed] [Google Scholar]
- Sawaya MR, Kraut J. Loop and subdomain movements in the mechanism of Escherichia coli dihydrofolate reductase: crystallographic evidence. Biochemistry. 1997;36:586–603. doi: 10.1021/bi962337c. [DOI] [PubMed] [Google Scholar]
- Sekhar A, Kay LE. NMR paves the way for atomic level descriptions of sparsely populated, transiently formed biomolecular conformers. Proceedings of the National Academy of Sciences of the United States of America. 2013;110:12867–12874. doi: 10.1073/pnas.1305688110. [DOI] [PMC free article] [PubMed] [Google Scholar]
- Smith JL, Hendrickson WA, Honzatko RB, Sheriff S. Structural heterogeneity in protein crystals. Biochemistry. 1986;25:5018–5027. doi: 10.1021/bi00366a008. [DOI] [PubMed] [Google Scholar]
- Southworth-Davies RJ, Medina MA, Carmichael I, Garman EF. Observation of decreased radiation damage at higher dose rates in room temperature protein crystallography. Structure. 2007;15:1531–1541. doi: 10.1016/j.str.2007.10.013. [DOI] [PubMed] [Google Scholar]
- Szyperski T, Mills JL. NMR-based structural biology of proteins in supercooled water. Journal of structural and functional genomics. 2011;12:1–7. doi: 10.1007/s10969-011-9111-5. [DOI] [PubMed] [Google Scholar]
- Tilton RF, Jr, Dewan JC, Petsko GA. Effects of temperature on protein structure and dynamics: X-ray crystallographic studies of the protein ribonuclease-A at nine different temperatures from 98 to 320 K. Biochemistry. 1992;31:2469–2481. doi: 10.1021/bi00124a006. [DOI] [PubMed] [Google Scholar]
- Tyka MD, Keedy DA, Andre I, Dimaio F, Song Y, Richardson DC, Richardson JS, Baker D. Alternate states of proteins revealed by detailed energy landscape mapping. Journal of molecular biology. 2011;405:607–618. doi: 10.1016/j.jmb.2010.11.008. [DOI] [PMC free article] [PubMed] [Google Scholar]
- van den Bedem H, Bhabha G, Yang K, Wright PE, Fraser JS. Automated identification of functional dynamic contact networks from X-ray crystallography. Nature methods. 2013;10:896–902. doi: 10.1038/nmeth.2592. [DOI] [PMC free article] [PubMed] [Google Scholar]
- van den Bedem H, Dhanik A, Latombe JC, Deacon AM. Modeling discrete heterogeneity in X-ray diffraction data by fitting multi-conformers. Acta crystallographica Section D, Biological crystallography. 2009;65:1107–1117. doi: 10.1107/S0907444909030613. [DOI] [PMC free article] [PubMed] [Google Scholar]
- Vitkup D, Ringe D, Petsko GA, Karplus M. Solvent mobility and the protein ‘glass’ transition. Nature structural biology. 2000;7:34–38. doi: 10.1038/71231. [DOI] [PubMed] [Google Scholar]
- Word JM, Lovell SC, LaBean TH, Taylor HC, Zalis ME, Presley BK, Richardson JS, Richardson DC. Visualizing and quantifying molecular goodness-of-fit: small-probe contact dots with explicit hydrogen atoms. Journal of molecular biology. 1999;285:1711–1733. doi: 10.1006/jmbi.1998.2400. [DOI] [PubMed] [Google Scholar]
Associated Data
This section collects any data citations, data availability statements, or supplementary materials included in this article.