

Abstract
Cellular senescence is a stable proliferation arrest associated with an altered secretory pathway, the senescence-associated secretory phenotype. However, cellular senescence is initiated by diverse molecular triggers, such as activated oncogenes and shortened telomeres, and is associated with varied and complex physiological endpoints, such as tumor suppression and tissue aging. The extent to which distinct triggers activate divergent modes of senescence that might be associated with different physiological endpoints is largely unknown. To begin to address this, we performed gene expression profiling to compare the senescence programs associated with two different modes of senescence, oncogene-induced senescence (OIS) and replicative senescence (RS [in part caused by shortened telomeres]). While both OIS and RS are associated with many common changes in gene expression compared to control proliferating cells, they also exhibit substantial differences. These results are discussed in light of potential physiological consequences, tumor suppression and aging.
Electronic supplementary material
The online version of this article (doi:10.1007/s11357-014-9637-0) contains supplementary material, which is available to authorized users.
Keywords: Replicative senescence, Oncogene-induced senescence, Gene expression, Cancer, Aging
Introduction
Cell senescence is a state of stable proliferation arrest that normal cells can undergo in response to excessive rounds of cell division (Hayflick and Moorhead 1961) and other diverse stimuli (Adams 2009; Kuilman et al. 2010). In this manner, senescence restricts the proliferative capacity of impaired or damaged cells, as well as normal cells. Several well-characterized triggers of senescence have been identified including short telomeres (linked to excess rounds of cell division (replicative senescence (RS); Hayflick and Moorhead 1961; Bodnar et al. 1998), activated oncogenes (oncogene-induced senescence (OIS); Serrano et al. 1997), and genotoxic and oxidative stress (Saretzki and von Zglinicki 2002; d'Adda di Fagagna 2008). Upon exposure to these triggers, cells engage a coordinated network of effector pathways. The p53 and pRB pathways are the master regulators of senescence and interact extensively with additional effector processes including DNA damage signalling, regulated autophagy, and profound changes to chromatin structure (d'Adda di Fagagna 2008; Narita et al. 2003; Young et al. 2009). Ultimately, these effectors converge on two key phenotypes of senescence, a stable proliferation arrest and an altered secretory pathway, the senescence-associated secretory phenotype (SASP; Krtolica et al. 2001; Coppe et al. 2008; Kuilman et al. 2008; Acosta et al. 2008).
Functionally, both RS and OIS serve as potent tumor suppression mechanisms (Michaloglou et al. 2005; Braig et al. 2005; Collado et al. 2005; Chen et al. 2005; Cosme-Blanco et al. 2007; Feldser and Greider 2007). Both proliferation arrest and SASP are thought to act in concert to mediate tumor suppression. The proliferation arrest restrains tumor growth, and the SASP recruits innate immune cells to clear the damaged pre-malignant cells (Xue et al. 2007; Kang et al. 2011). In addition, cell senescence contributes to proper wound healing (Jun and Lau 2010; Krizhanovsky et al. 2008). However, senescence has also been implicated in the promotion of aging (Baker et al. 2011; Krtolica et al. 2001).
In sum, senescence is a complex process activated by diverse triggers in association with varied physiological end points. Conceivably, distinct triggers activate different modes of cell senescence. To investigate this, we performed gene expression profiling to compare two different modes of senescence, OIS and RS, in the same cell type and under, otherwise, identical conditions.
Materials and methods
Cell culture
IMR90 primary human diploid fibroblasts were obtained from the Coriell Institute (Camden, NJ, USA). The cells were cultured in Dulbecco's Modified Eagle Medium (DMEM) supplemented with 20 % fetal bovine serum, 2 mM L-glutamine, 25 U/ml penicillin, and 25 μg/ml streptomycin. Cells were maintained in a 37 °C, 5 % CO2, 3 % O2 humidified incubator. IMR90 cells were subjected to serial passage approximately every 2 to 3 days.
Cumulative population doublings were calculated using the following equation: ([log(number of cells counted) − log(number of cells plated)]/log(2)). The cells were assayed routinely for markers of senescence (e.g., SA β-gal activity, decreased BrdU incorporation, p16INK4a induction, SAHF formation). Cells were considered replicative senescent when no proliferation was observed for a 2-week period following the final passage and the cells displayed the senescence hallmarks listed above. In the case of the RS model, cells were compared at PD28 (proliferating) and PD90 (RS).
Phoenix–Ampho embryonic kidney cells (SD-3443) were obtained from the American Type Culture Collection (Manassas, VA, USA). The cells were cultured in DMEM supplemented with 10 % fetal bovine serum, 2 mM L-glutamine, 25 U/ml penicillin, and 25 μg/ml streptomycin. Cells were maintained in a 37 °C, 5 % CO2 humidified incubator.
Expression vectors
pBABE-puro and pBABE-puro-H-RAS-V12 (H-RASG12V) retroviral expression vectors were obtained as gifts from Robert Weinberg (Massachusetts Institute of Technology).
Retroviral production and infection
Control and OIS cells were produced by retroviral infection of IMR90 cells with either pBABE-puro or pBABE-puro-H-RAS-V12. Briefly, Phoenix–Ampho cells were transfected with either pBABE-puro or pBABE-puro-H-RAS-V12 plasmids using the calcium phosphate transfection method. Forty-eight hours after transfection, viral supernatants were collected from the Phoenix cells, passed through a 0.45-μm-syringe filter, and applied to IMR90 cells that were pre-treated for 2 h with 8 μg/ml polybrene. The IMR90 cells were incubated for 24 h to facilitate infection. Typically, two sequential rounds of infection were performed. Following the second 24-h incubation, the viral supernatants were removed from the IMR90 cells and replaced with growth medium containing 1 μg/ml puromycin in order to select for positively infected cells. In the OIS model, infections were performed at PD <30.
Senescence-associated β-galactosidase assay
Cells were rinsed once with PBS, covered with freshly prepared fixative solution (1X PBS + 2 % formaldehyde, 0.2 % glutaraldehyde), and subjected to fixation for 5 min at room temperature. The cells were washed twice with PBS, covered with freshly prepared staining solution (40 mM Na2HPO4 pH 6, 150 mM NaCl, 2 mM MgCl2, 5 mM K3Fe(CN)6, 5 mM K4Fe(CN)6, 1 mg/ml X-gal (in DMSO)), and incubated 12–16 h at 37 °C in a non-CO2 incubator. The cells were then washed twice with PBS, washed twice with dH2O, subjected to drying at room temperature, and imaged using bright field microscopy.
Cell lysis
The dishes (100 mm) of cells were washed once with PBS, aspirated, and scraped into 300–500 μl of hot 1X sample buffer (62.5 mM Tris–HCl pH 6.8, 2 % SDS, 10 % glycerol, 0.1 M DTT, 0.01 % bromophenol blue). The whole cell lysates were collected in microcentrifuge tubes, boiled for 4 min, and homogenized by vigorous vortexing. Lysates were subjected to centrifugation for 5 min at 12,000xg, transferred to fresh microcentrifuge tubes, snap frozen in dry ice/ethanol, and stored at −80 °C. The lysates were quantified using the Bradford assay.
Immunoblotting
Whole cell protein lysates were fractionated by SDS-PAGE, immobilized to PVDF membranes, and subjected to immunoblotting utilizing standard methods. The RAS (610001) and p16INK4a (51-1325GR) antibodies were purchased from BD Biosciences. Lamin A/C (2032) and GAPDH (2118) antibodies were purchased from Cell Signaling Technology. Lamin B1 (ab16048) and p21WAF1 (ab7960) antibodies were purchased from Abcam. The cyclin A (H-432) antibody was purchased from Santa Cruz Biotechnology.
RNA isolation and analysis
Total RNA was isolated using the RNeasy Mini Kit (Qiagen, 74104) according to the manufacturer’s instructions and included the optional DNase I digestion step. Purified RNA samples were quantified using the NanoVue Plus spectrophotometer (GE Healthcare), assessed for quality using the RNA 6000 Nano Kit and 2100 Bioanalyzer (Agilent), and stored at −80 °C.
Microarrays and gene expression analysis
Starting with 50 ng total RNA for each sample, double-stranded cDNA was synthesized using the Ovation Pico WTA System (NuGEN Technologies, #3300), purified with Agencourt RNAClean beads (Beckman Coulter), and subjected to SPIA amplification to produce single-stranded cDNA. The cDNA was again purified, SPIA-amplified, subjected to fragmentation, and biotin labeled using the Encore Biotin Module kit (NuGEN Technologies, #4200). The fragmented, biotinylated cDNA was then hybridized to Affymetrix GeneChip Human Genome U133 Plus 2.0 arrays, then stained and scanned with the Affymetrix GeneChip Scanner 3000.
The microarray data were analyzed using the Bioconductor software package. Each array was subjected to background correction and normalization by the GC Robust Multi-array Average (GCRMA) method. Pairwise comparisons were made between the proliferating and RS arrays and also between the control and OIS arrays. Average expression was calculated as the geometric mean of the absolute expression level (equivalent to the unlogged mean of the log-normalized expression values produced by the GCRMA method). T tests were performed on the log-scale expression values to determine statistical significance, and the genes were considered differentially expressed if the fold difference of expression between the senescent and proliferating arrays was greater than 1.5-fold (or less than −1.5-fold) with a BH-FDR-adjusted p value lower than 0.05.
Results
We set out to compare RS and OIS by gene expression profiling. To this end, RS IMR90 fibroblasts were generated by passaging the cells in culture until they entered a stable proliferation arrest (Supplementary Figure 1a). As well as being proliferation arrested, these cells were judged senescent, compared to control proliferating cells, by a large flat vacuolated morphology, expression of senescence-associated β-galactosidase (SA β-gal; Dimri et al. 1995; Supplementary Figure 1b), downregulation of lamin B1 (Freund et al. 2012; Shimi et al. 2011), downregulation of cell cycle gene cyclin A (Riabowol 1992), and upregulation of cell cycle arrest genes, p21 and p16 (Fig. 1c; Noda et al. 1994; Hara et al. 1996). OIS IMR90 fibroblasts were generated by infecting proliferating primary human fibroblasts with a retrovirus encoding an activated H-RASG12V oncogene. Unlike control-infected cells, these cells also ceased proliferation (data not shown). Similar to RS cells, these cells expressed SA β-gal (Supplementary Figure 1d), downregulated lamin B1 and showed gene expression changes indicative of proliferation arrest, including downregulation of cyclin A and upregulation of cell cycle inhibitors p21 and p16 (Supplementary Figure 1e).
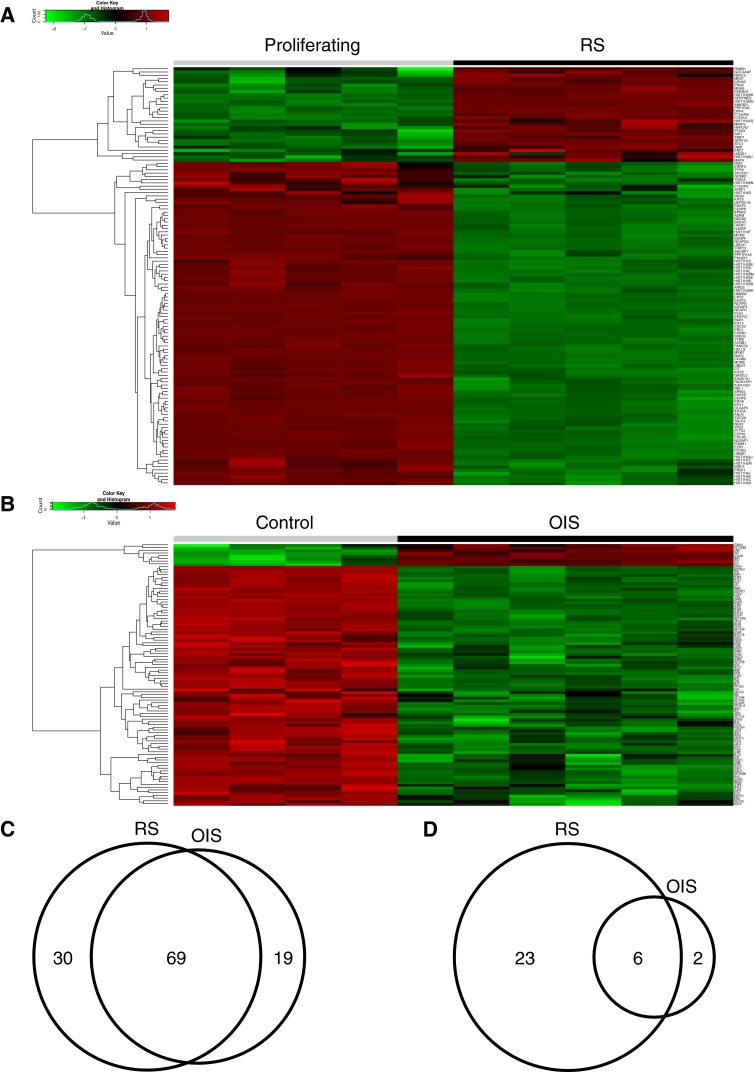
Fig. 1.

Analysis of proliferation genes in RS and OIS. a Heat map showing relative expression of proliferation genes in RS. Proliferation genes were taken from Whitfield et al. (2006). b Heat map showing relative expression of proliferation genes in OIS. c Venn diagram of proliferation genes downregulated in RS and OIS. All the genes included exhibited differential expression (fold change ≤1.5 and BH-FDR-adjusted p value <0.05)
RNA was isolated from proliferating and RS cells, and control-infected and OIS cells, and subsequently processed and hybridized to Affymetrix Human Genome U133 Plus 2.0 Arrays. For OIS, we analyzed 6 replicates of OIS and 4 replicates of control-infected cells. For RS, we analyzed 5 replicates of RS and 5 replicates of proliferating cells. For both OIS and RS, principal component analysis showed the individual samples to be primarily separated by proliferating versus RS, or control versus OIS, as expected (Supplementary Figure 2). Consistent with this, unsupervised clustering separated the control-infected from OIS and the proliferating from RS (Supplementary Figure 3). Before comparing expression changes in RS and OIS, we first set out to validate the gene expression data sets. Since RS and OIS are both associated with proliferation arrest (Supplementary Figure 1 and data not shown) (Hayflick and Moorhead 1961; Serrano et al. 1997), we examined expression of a previously collated set of 45 genes whose expression is tightly linked to cell proliferation (Whitfield et al. 2006). This list includes many proliferation-promoting genes involved in DNA synthesis and mitosis. As expected, RS cells exhibited marked downregulation of virtually all these proliferation genes (40/45 genes showed fold change >1.5-fold and BH-FDR-adjusted p value <0.05; Fig. 1a, c and Supplementary Datasets). OIS cells downregulated slightly less than half of these genes (19/45), but included key cell cycle genes, such as cyclin B1, cyclin A2, and PCNA (Fig. 1b, c and Supplementary Datasets). Thus, expression changes in both RS and OIS are broadly in accordance with senescence-associated proliferation arrest, validating the expression data sets for other comparisons of OIS and RS.
Taking a long range view of the data, 5,424 differentially expressed genes were identified in the RS cells when compared to control proliferating cells (Fig. 2a and Supplementary Datasets). Of the 5,424 genes, 2,711 genes were significantly upregulated in the RS cells, while 2,736 genes were significantly downregulated (Fig. 2b, c). By the same criteria, 3,188 genes were identified as being differentially expressed in the H-RASG12V-induced OIS cells when compared to control-infected proliferating cells (Fig. 2a and Supplementary Datasets). Of the 3,188 genes, 1,502 genes were significantly upregulated in the H-RASG12V cells, while 1,687 genes were significantly downregulated (Fig. 2b, c). Of those genes altered in RS, 32.6 % was also altered in OIS. Of those genes altered in OIS, 55.5 % was also altered in RS (Fig. 2a). Observations were similar comparing genes according to the direction of change (i.e., upregulated or downregulated; Fig. 2b, c). To obtain a more holistic view of the data, we plotted log fold change in OIS versus log fold change in RS (Fig. 2d) for all genes that significantly changed their expression in either OIS, RS or both. This analysis confirmed that the RS and OIS programs are qualitatively distinct, involving non-overlapping upregulated and downregulated genes in each case. In other words, the gene expression changes in OIS were not simply a subset of those in RS, or vice versa. In sum, while there was considerable overlap of gene expression changes between OIS and RS, there were also substantial differences.
Fig. 2.

Global comparison of RS and OIS gene expression changes. Differentially expressed genes from the RS and OIS Affymetrix Human Genome U133 Plus 2.0 microarray datasets were compared in order to identify common changes. Genes exhibiting a fold change >1.5 (or < -1.5) and BH-FDR-adjusted p value <0.05 were considered differentially expressed. For genes containing multiple Affymetrix probes, the genes were only considered differentially expressed and were included if all the probes changed in the same direction. a Venn diagram of genes that change significantly in RS and OIS. b Venn diagram of genes upregulated in RS and OIS. c Venn diagram of genes downregulated in RS and OIS. d Dot plot of log fold change in OIS versus RS showing all significant changing probes (fold change <1.5 and BH-FDR-adjusted p value <0.05). Symbols indicate probesets that change significantly in RS, OIS, or both, as indicated
We used gene set enrichment analysis (GSEA) to compare the gene ontologies of expression changes associated with OIS and RS (Mootha et al. 2003; Subramanian et al. 2005). While GSEA confirmed the downregulation of proliferation genes in both RS and OIS (not shown), gene ontology sets most enriched in RS included “Extracellular structure organization & biogenesis,” “Synapse organization & biogenesis,” “Female pregnancy,” “Synaptogenesis,” and “Hematopoietin interferon class D2000 cytokine receptor activity”; none of these scored highly in OIS (Tables 1 and 2 and Supplementary Datasets; Fig. 3). Conversely, gene ontology sets most enriched in OIS included “Myeloid cell differentiation,” “Zinc ion binding,” “Transition metal ion binding,” “Metalloendopeptidase activity,” and “Regulation of translational initiation”; none of these sets scored highly in RS (Tables 1 and 2 and Supplementary Datasets).
Table 1.
RS
| Gene set | Size | NES | FDR q-val | |
|---|---|---|---|---|
| EXTRACELLULAR_STRUCTURE_ORGANIZATION_AND_BIOGENESIS | 30 | 2.0293007 | 0.003994516 | |
| SYNAPSE_ORGANIZATION_AND_BIOGENESIS | 22 | 2.0286398 | 0.001997258 | |
| FEMALE_PREGNANCY | 46 | 2.0054407 | 0.002974658 | |
| SYNAPTOGENESIS | 18 | 1.959838 | 0.005856824 | |
| HEMATOPOIETIN_INTERFERON_CLASS__D200_DOMAIN__CYTOKINE_RECEPTOR_ACTIVITY | 34 | 1.9120635 | 0.015321571 | |
| POSITIVE_REGULATION_OF_PHOSPHATE_METABOLIC_PROCESS | 25 | 1.7941592 | 0.095760256 | |
| POSITIVE_REGULATION_OF_PHOSPHORYLATION | 23 | 1.7872263 | 0.09056385 | |
| POSITIVE_REGULATION_OF_PROTEIN_AMINO_ACID_PHOSPHORYLATION | 18 | 1.7721677 | 0.09497338 | |
| MULTI_ORGANISM_PROCESS | 150 | 1.7305453 | 0.14670648 | |
| ANION_TRANSMEMBRANE_TRANSPORTER_ACTIVITY | 55 | 1.7133843 | 0.16258225 | |
Table 2.
OIS
| Gene set | Size | NES | FDR q-val | |
|---|---|---|---|---|
| MYELOID_CELL_DIFFERENTIATION | 36 | 2.0353153 | 0.021934602 | |
| ZINC_ION_BINDING | 87 | 1.9495854 | 0.06551356 | |
| REGULATION_OF_TRANSLATIONAL_INITIATION | 19 | 1.8730145 | 0.09286333 | |
| METALLOPEPTIDASE_ACTIVITY | 45 | 1.839912 | 0.10677754 | |
| METALLOENDOPEPTIDASE_ACTIVITY | 26 | 1.8736216 | 0.114875816 | |
| TRANSLATIONAL_INITIATION | 26 | 1.8450661 | 0.11514404 | |
| TRANSITION_METAL_ION_BINDING | 105 | 1.8891174 | 0.121084265 | |
| OXYGEN_AND_REACTIVE_OXYGEN_SPECIES_METABOLIC_PROCESS | 20 | 1.7936904 | 0.15390657 | |
| ENZYME_INHIBITOR_ACTIVITY | 118 | 1.8022212 | 0.15415874 | |
| RHYTHMIC_PROCESS | 24 | 1.7652162 | 0.19747607 | |
Fig. 3.
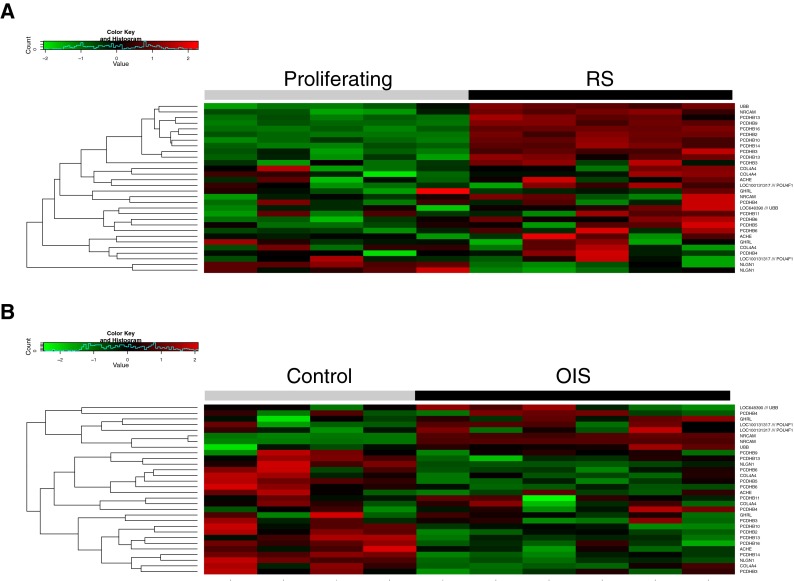
Analysis of synapogenesis genes in RS and OIS. a Heat map showing relative expression of synaptogenesis genes in RS. b Heat map showing relative expression of synaptogenesis genes in OIS
We also used GSEA to compare genes regulated in OIS and RS according to their positional distribution in chromosome cytogenetic bands. In fact, GSEA failed to obtain strong evidence for chromosomal clusters of co-regulated genes in either OIS or RS. Only 9 of such gene clusters were identified with FDR<0.05 (Tables 3, 4, 5, and 6). Of these, only one, at chromosome 6p22, was co-regulated in both RS and OIS. This cluster included many canonical DNA replication histone genes whose expression is typically repressed in non-proliferating senescent cells. In sum, in two different modes of analysis, GSEA pointed to significant differences in the gene expression programs activated in OIS and RS.
Table 3.
RS, up
| CHR position | Size | NES | FDR q-val |
|---|---|---|---|
| CHR1Q12 | 15 | −1.7680438 | 0.23140398 |
| CHR2Q24 | 39 | −1.5923655 | 0.42203596 |
| CHR4Q26 | 17 | −1.5063437 | 0.50678426 |
| CHR18Q21 | 64 | −1.6013923 | 0.5097017 |
| CHR5Q31 | 159 | −1.5196488 | 0.53384614 |
| CHR4Q22 | 24 | −1.4834217 | 0.53618604 |
| CHR4Q21 | 69 | −1.5337276 | 0.56983185 |
| CHR3Q12 | 25 | −1.6303256 | 0.5711069 |
| CHR5Q14 | 33 | −1.409944 | 0.7252267 |
| CHR18Q22 | 23 | −1.4153817 | 0.7755975 |
Table 4.
OIS, up
| CHR position | Size | NES | FDR q-val |
|---|---|---|---|
| CHR18Q21 | 64 | −2.0844917 | 0.001910569 |
| CHR4P12 | 20 | −1.8865035 | 0.032303188 |
| CHR20P11 | 43 | −1.8480524 | 0.03517915 |
| CHR15Q25 | 34 | −1.7391939 | 0.10724908 |
| CHR10Q21 | 31 | −1.699658 | 0.13380279 |
| CHR6Q21 | 45 | −1.5716316 | 0.24465534 |
| CHR7Q21 | 67 | −1.6008431 | 0.24826428 |
| CHR16Q22 | 112 | −1.5733237 | 0.27051094 |
| CHR15Q24 | 60 | −1.6069275 | 0.2742026 |
| CHR14Q32 | 97 | −1.536082 | 0.29523185 |
Table 5.
RS, down
| CHR position | Size | NES | FDR q-val |
|---|---|---|---|
| CHR6P22 | 82 | 2.0205357 | 0.002599428 |
| CHR19P12 | 22 | 1.8988552 | 0.012233284 |
| CHR2Q13 | 24 | 1.7256743 | 0.11067701 |
| CHR1P32 | 68 | 1.6996369 | 0.11619425 |
| CHR7P15 | 53 | 1.6222062 | 0.18741873 |
| CHR12P11 | 21 | 1.627734 | 0.21021591 |
| CHR8Q13 | 34 | 1.5297208 | 0.33547294 |
| CHR18P11 | 55 | 1.5429624 | 0.34366933 |
| CHR11Q24 | 45 | 1.5129603 | 0.34484628 |
| CHR1Q41 | 25 | 1.4707648 | 0.43207833 |
Table 6.
OIS, down
| CHR position | Size | NES | FDR q-val |
|---|---|---|---|
| CHR1Q41 | 25 | 1.7745653 | 0.040446274 |
| CHR7Q35 | 22 | 1.7656888 | 0.041421488 |
| CHR11Q23 | 99 | 1.7837875 | 0.0436039 |
| CHR3P25 | 67 | 1.7934448 | 0.0466384 |
| CHR6P22 | 82 | 1.8148179 | 0.047879487 |
| CHR1P22 | 65 | 1.8261894 | 0.057311762 |
| CHR13Q13 | 22 | 1.7040439 | 0.07005717 |
| CHR4Q25 | 27 | 1.7060103 | 0.07744634 |
| CHR2P24 | 39 | 1.8363065 | 0.09317992 |
| CHR1P32 | 68 | 1.666324 | 0.09436246 |
Next, we took a more focused approach and compared OIS and RS specifically in terms of a key phenotype of senescence, the SASP. To assess the SASP, we used a collection of signature genes assembled by Campisi and coworkers (Coppe et al. 2010). As expected, both RS and OIS were associated with upregulation of many SASP genes (Fig. 4a, b and Supplementary Datasets). However, some SASP genes were downregulated in both RS and OIS (Fig. 4a, b). There was incomplete overlap of SASP genes upregulated in OIS and RS (Fig. 4c).
Fig. 4.
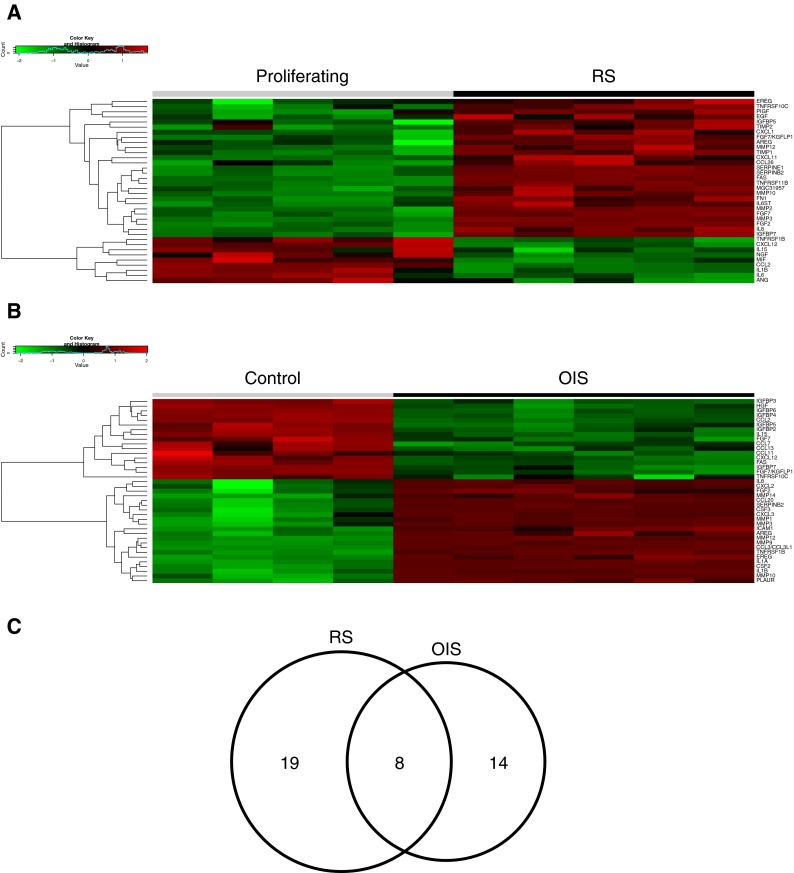
Analysis of SASP genes in RS and OIS. a Heat map showing relative expression of SASP genes in RS. SASP genes taken from Coppe et al. (2010). Genes exhibiting a fold change >1.5 (or < -1.5) and BH-FDR-adjusted p value <0.05 were considered differentially expressed. b Heat map showing relative expression of SASP genes in OIS. c Venn diagram of SASP genes upregulated in RS and OIS
To better compare and contrast the SASP in OIS and RS, we performed Ingenuity Pathway Analysis (IPA) on those SASP genes upregulated in OIS and RS. This confirmed the similarities and differences (Fig. 5a, b). Several pathways were regulated in common between OIS and RS, such as “Hepatic fibrosis/Hepatic Stellate Cell Activation,” “Granulocyte adhesion and diapedesis,” and “Differential Regulation of Cytokine Production in Macrophages and T Helper Cells by IL-17A and IL-17F.” However, other pathways were differentially regulated. For example, “Acute phase response signalling,” “IL-6 signaling,” and “NF-kB signaling” scored highly in RS, but not OIS. Conversely, “TREM1 signaling,” “Glucocorticoid receptor signaling,” and “Atherosclerosis signaling” scored highly in OIS, but not RS. Taken together, these analyses of the SASP confirm the core similarities of OIS and RS, but also point to some differences.
Fig. 5.

Pathway analysis of SASP genes in OIS and RS. Ingenuity Pathway Analysis (IPA) software was used to analyze SASP genes upregulated in a RS and b OIS
Previously, we have implicated repression of Wnt signaling in both RS and OIS senescent cells as a trigger for chromatin changes in senescent cells (Ye et al. 2007). To better compare the regulation of Wnt signalling in OIS and RS, we compared regulated expression of a set of 24 genes designated as “direct Wnt target genes.” This gene set was originally derived from the “Wnt homepage” (http://www.stanford.edu/group/nusselab/cgi-bin/wnt/target_genes), but then manually curated to include only those genes shown in the literature to be directly regulated by Wnt effector, β-catenin/TCF4. While both OIS and RS were associated with both upregulated and downregulation of direct Wnt target genes (Fig. 6a, b), on closer analysis, there were substantial differences in the specific genes regulated and their direction of change (Fig. 6c, d). In fact, for both upregulated and downregulated genes, only a single gene was regulated in common between OIS and RS: NRCAM was upregulated in both RS and OIS, and FST was downregulated in both RS and OIS.
Fig. 6.
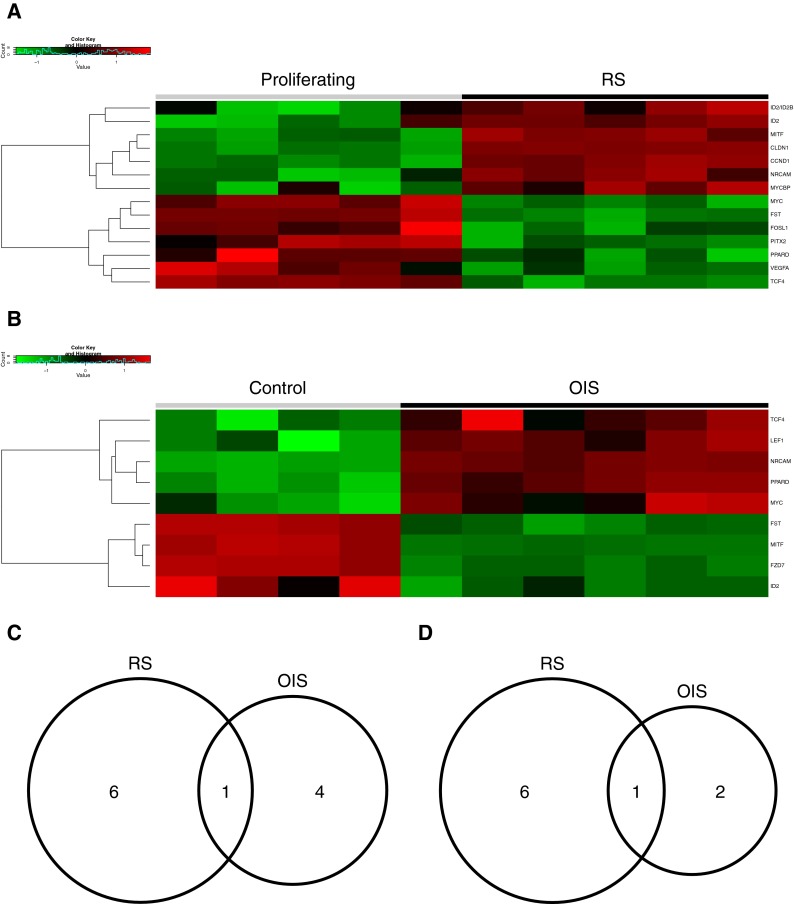
Analysis of Wnt target genes in OIS and RS. a Heat map showing relative expression of direct Wnt target genes in RS. Wnt target genes were derived from http://www.stanford.edu/group/nusselab/cgi-bin/wnt/target_genes and were further refined through primary literature for those genes with functional TCF/LEF-binding sites in the gene promoter. Genes exhibiting a fold change >1.5 (or < -1.5) and BH-FDR-adjusted p value <0.05 were considered differentially expressed. b Heat map showing relative expression of direct Wnt target genes in OIS. c Venn diagram of direct Wnt target genes upregulated in RS and OIS. d Venn diagram of direct Wnt target genes downregulated in RS and OIS
Next, we compared expression changes between OIS and RS of a set of 193 genes encoding regulators of chromatin structure and function. This list was manually curated to include genes known to encode (or likely to encode, based on close sequence homology) histone-modifying enzymes, histone chaperones, chromatin-binding proteins, and ATP-dependent nucleosome remodeling complexes. Analysis of these genes again indicated substantial differences between gene expression programs in OIS and RS. Approximately, 10 genes were upregulated uniquely in either RS or OIS (Fig. 7a–c). However, only 1 gene, nuclear receptor coactivator 3 (NCOA3), was upregulated in both RS and OIS. Interestingly, many more genes were downregulated in RS than OIS (Fig. 7a, b, d).
Fig. 7.
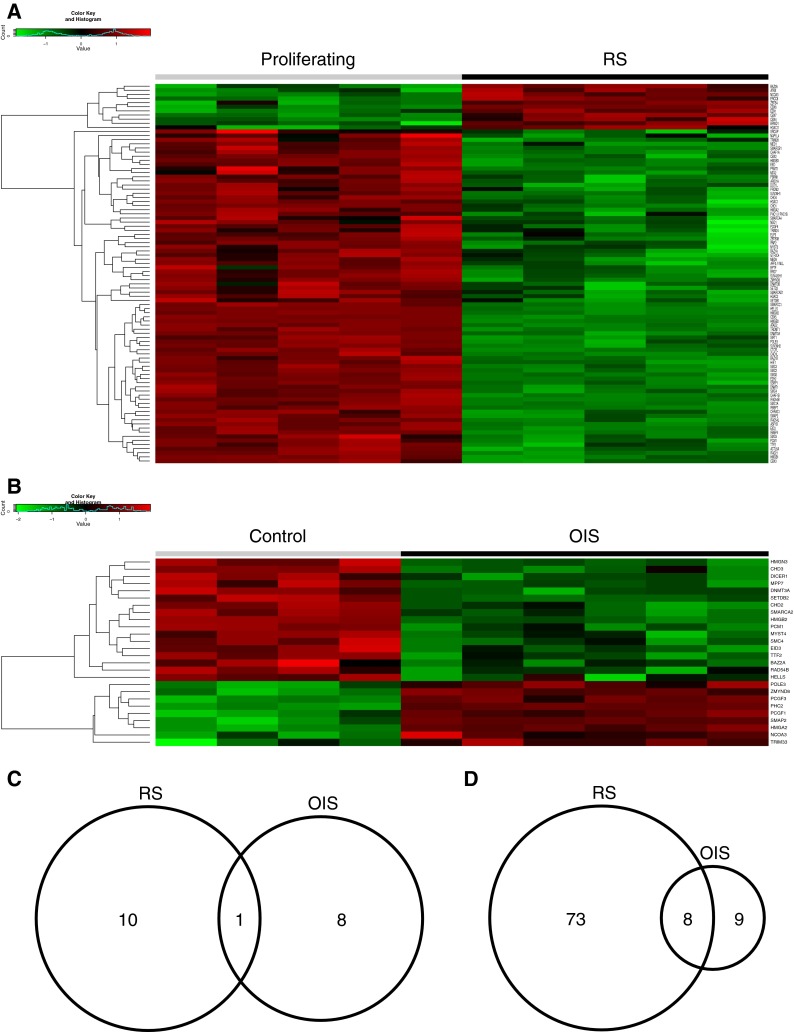
Analysis of chromatin regulators in OIS and RS. a Heat map showing relative expression of chromatin regulatory genes in RS. The list of chromatin regulators was manually curated from the literature. Genes exhibiting a fold change >1.5 (or ≤1.5) and BH-FDR-adjusted p value <0.05 were considered differentially expressed. b Heat map showing relative expression of chromatin regulatory genes in OIS. c Venn diagram of upregulated chromatin regulatory genes in RS and OIS. d Venn diagram of downregulated chromatin regulatory genes in RS and OIS
Finally, we compared OIS and RS in terms of a set of genes whose regulation is closely associated with regulation of p16, a key effector of cellular senescence. Specifically, this gene set, “p16-linked genes,” includes genes whose expression is upregulated or downregulated in p16-expressing hTERT-immortalized human fibroblasts that spontaneously upregulate p16 and senesce (Jeyapalan and Sedivy 2013). Many p16-linked genes were downregulated in common between OIS and RS (Fig. 8a–c). However, substantially more of the p16-linked genes were upregulated in RS than in OIS (Fig. 8a, b, d).
Fig. 8.
Analysis of p16-linked genes in OIS and RS. a Heat map showing relative expression of p16-linked genes in RS. The list of p16-linked genes was based on genes whose expression is either upregulated or downregulated in p16-expressing hTERT-immortalized human fibroblasts that spontaneously upregulate p16 (Jeyapalan and Sedivy 2013). Genes exhibiting a fold change > 1.5 (or ≤1.5) and BH-FDR-adjusted p value <0.05 were considered differentially expressed. b Heat map showing relative expression of chromatin regulatory genes in OIS. c Venn diagram of downregulated p16-linked genes in RS and OIS. d Venn diagram of upregulated p16-linked genes in RS and OIS
Discussion
As expected, this comparative analysis reveals broad similarities between OIS and RS. First, both OIS and RS are associated with repression of many proliferation-promoting genes. In both cases, this is known to contribute to stable senescence-associated proliferation arrest. Second, both OIS and RS are associated with activation of many genes that constitute the SASP.
However, beyond these broad and already-documented similarities, our analysis also points to substantial differences between the gene expression programs underlying RS and OIS. In terms of the overall gene expression programs activated by OIS and RS, there are more differences than similarities in regulated genes. This is reflected in the largely different outputs of the GSEA analyses from OIS and RS. Moreover, in all of the specific pathways and gene sets examined—SASP, Wnt target genes, and chromatin regulators—there are core overlaps but also substantial differences between OIS and RS. Importantly, the differences in OIS and RS do not appear to be due to either program being a deficient or impaired senescence program; the differences between OIS and RS are qualitative, not just quantitative.
While OIS and RS are often considered to be similar (Suram et al. 2012), differences between these models are not surprising, given their very different triggers. In the model examined here, the OIS model is triggered by expression of an activated Ras oncogene. This is expected to activate many signalling, effector and gene expression programs that are absent from RS cells. Although this in vitro model depends on ectopic expression of activated Ras, this and similar models are thought to recapitulate the OIS program activated in vivo (Michaloglou et al. 2005; Braig et al. 2005; Collado et al. 2005; Chen et al. 2005). Even though OIS is ultimately thought to be associated with downregulation of oncogene signalling (Courtois-Cox et al. 2006), the substantial differences between proliferating and OIS cells indicate sustained differences in cell effector programs.
One key effector of different modes of cell senescence is the p16-pRB pathway (Adams 2009; Kuilman et al. 2010). Interestingly, our analysis shows that a set of genes whose upregulation coincides with upregulation of p16 in one model of senescence (Jeyapalan and Sedivy 2013) are quite differently regulated between OIS and RS in our study. This is consistent with the idea that even the p16-pRB effector pathway is networked differently between OIS and RS.
As well as reflecting different triggers and effector pathways, differences between OIS and RS might also reflect differences in in vivo function and/or pathology between OIS and RS. Both RS and OIS are thought to act as tumor suppression mechanisms (Braig et al. 2005; Michaloglou et al. 2005; Chen et al. 2005; Bartkova et al. 2006; Feldser and Greider 2007; Cosme-Blanco et al. 2007; Collado et al. 2005). OIS mediates tumor suppression in direct response to a potentially cancer-causing genetic alteration (Serrano et al. 1997). In contrast, RS mediates tumor suppression in response to a finite number of normal cell divisions (Hayflick and Moorhead 1961). While cell division is clearly necessary for tumor growth, cell division per se is not typically regarded as oncogenic in the same way as an activated oncogene. Thus, OIS might reflect a more active and definitive tumor suppression mechanism than RS. Accordingly, it is conceivable that some immune regulatory pathways preferentially regulated in OIS compared to RS (TREM1 signalling and Glucocorticoid Receptor signalling by IPA analysis, and myeloid cell differentiation by GSEA) reflect this more urgent tumor suppressor function of OIS. Conversely, RS, as perhaps representative of telomere shortening and more generic cell stress (Hayflick and Moorhead 1961; Bodnar et al. 1998; Sherr and DePinho 2000), might be more informative regarding gene expression changes in aged tissues. Of note, both “IL-6 signaling” and “NF-κB signaling” pathways scored highly in RS, but not OIS. IL-6 is a key component of age-associated inflammation, so-called “inflammaging,” a candidate driver of the aging process (Singh and Newman 2011). Recent studies have also implicated elevated NF-κb activity as a driver of aging (Osorio et al. 2012). Thus, our analyses are consistent with the idea that age-associated accumulation of RS cells, perhaps caused by age-associated telomere shortening (Blasco 2005), might be a significant contributor to these pro-aging pathways.
Other notable differences between OIS and RS are more difficult to rationalize based on our current understanding of senescence. Of particular note, high ranking of the “Synaptogenesis” set in RS, but not OIS, is largely driven by upregulation of protocadherin B genes, a 16-gene cluster on chromosome 5, in RS, but not OIS (Fig. 3 and Supplementary Datasets). The function of these genes is unknown, but they are thought to be involved in the establishment and function of specific cell–cell connections (Chen and Maniatis 2013). This might reflect a level of cell–cell interaction specific to RS over OIS. Deeper functional analysis of these genes in senescence might lead to substantial novel functional insights.
Just as distinct triggers (activated oncogene or replicative exhaustion) induce different modes of senescence in the same cell type (IMR90 fibroblasts), so senescent phenotypes are likely to be divergent between cell types, in ways that could impact tissue specific functions and pathologies. For example, senescent human corneal keratocytes do not express SASP, but instead, decrease the expression of IL-6, and this might impact their function (Kipling et al. 2009). Very interestingly, while senescent vascular smooth muscle cells appear to express a SASP, they also exhibit a marked pro-calcificatory phenotype that might promote the atherosclerosis (Burton et al. 2009).
To summarize, here we have presented data based on expression profiling of primary human fibroblasts that supports the emerging notion that senescence is perhaps not a single unique and unambiguous cell state (Salama et al. 2014); rather, senescence, like “differentiation,” might be a collection of related but different cell states with some features in common, such as stable proliferation arrest and a secretory phenotype that is frequently pro-inflammatory. Just as there is no single definition of a differentiated cell, so there might be no single definition of a senescent cell.
Electronic supplementary material
Confirmation of RS and OIS. (A) Proliferation curve for IMR90 cells cultured to RS. (B) SA β-gal staining of proliferating and RS IMR90 cells. (C) Whole cell lysates from proliferating and RS IMR90 cells were fractionated by SDS-PAGE and Western blotted for markers of proliferation and senescence. GAPDH serves as a loading control. (D) SA β-gal staining of control and H-RASG12V-infected IMR90 cells. (E) Whole cell lysates from control and H-RASG12V-infected IMR90 cells were fractionated by SDS-PAGE and Western blotted for markers of proliferation and senescence. GAPDH serves as a loading control. (PDF 757 kb)
Principal component analysis (PCA) of microarray expression datasets. (A) PCA shows that major separation of array datasets is according to proliferating (PD28) versus RS (PD90). (B) PCA shows that major separation of array datasets is according to control infection versus H-RAS infection (OIS). (PDF 49 kb)
Unsupervised clustering of microarray expression datasets. (A) Unsupervised clustering shows that major separation of array datasets is according to control infection versus H-RAS infection (OIS). (B) Unsupervised clustering shows that major separation of array datasets is according to proliferating (PD28) versus RS (PD90). (PDF 1784 kb)
(XLS 5004 kb)
Acknowledgments
Microarray sample preparation and Affymetrix GeneChip Human Genome U133 Plus 2.0 microarray hybridization and scanning were conducted by the Paterson Institute for Cancer Research Microarray Service (Manchester, UK). Work in the lab of PDA was funded by BBSRC, and work in the lab of JMS was funded by NIA, as part of a joint-funding NIA/BBSRC partnership.
Data files
Accession number for RS array GSE36640 (http://www.ncbi.nlm.nih.gov/geo/query/acc.cgi?acc=GSE36640)
Accession number for OIS array GSE54402 (http://www.ncbi.nlm.nih.gov/geo/query/acc.cgi?acc=GSE54402)
References
- Acosta JC, O'Loghlen A, Banito A, Guijarro MV, Augert A, Raguz S, Fumagalli M, Da Costa M, Brown C, Popov N, Takatsu Y, Melamed J, AddadiFagagna F, Bernard D, Hernando E, Gil J. Chemokine signaling via the CXCR2 receptor reinforces senescence. Cell. 2008;133(6):1006–1018. doi: 10.1016/j.cell.2008.03.038. [DOI] [PubMed] [Google Scholar]
- Adams PD. Healing and hurting: molecular mechanisms, functions, and pathologies of cellular senescence. Mol Cell. 2009;36(1):2–14. doi: 10.1016/j.molcel.2009.09.021. [DOI] [PubMed] [Google Scholar]
- Baker DJ, Wijshake T, Tchkonia T, LeBrasseur NK, Childs BG, van de Sluis B, Kirkland JL, van Deursen JM (2011) Clearance of p16Ink4a-positive senescent cells delays ageing-associated disorders. Nature 479 (7372):232–236. doi:10.1038/nature10600 [DOI] [PMC free article] [PubMed]
- Bartkova J, Rezaei N, Liontos M, Karakaidos P, Kletsas D, Issaeva N, Vassiliou LV, Kolettas E, Niforou K, Zoumpourlis VC, Takaoka M, Nakagawa H, Tort F, Fugger K, Johansson F, Sehested M, Andersen CL, Dyrskjot L, Orntoft T, Lukas J, Kittas C, Helleday T, Halazonetis TD, Bartek J, Gorgoulis VG. Oncogene-induced senescence is part of the tumorigenesis barrier imposed by DNA damage checkpoints. Nature. 2006;444(7119):633–637. doi: 10.1038/nature05268. [DOI] [PubMed] [Google Scholar]
- Blasco MA. Telomeres and human disease: ageing, cancer and beyond. Nat Rev Genet. 2005;6(8):611–622. doi: 10.1038/nrg1656. [DOI] [PubMed] [Google Scholar]
- Bodnar AG, Ouellette M, Frolkis M, Holt SE, Chiu CP, Morin GB, Harley CB, Shay JW, Lichtsteiner S, Wright WE. Extension of life-span by introduction of telomerase into normal human cells. Science. 1998;279(5349):349–352. doi: 10.1126/science.279.5349.349. [DOI] [PubMed] [Google Scholar]
- Braig M, Lee S, Loddenkemper C, Rudolph C, Peters AH, Schlegelberger B, Stein H, Dorken B, Jenuwein T, Schmitt CA. Oncogene-induced senescence as an initial barrier in lymphoma development. Nature. 2005;436(7051):660–665. doi: 10.1038/nature03841. [DOI] [PubMed] [Google Scholar]
- Burton DG, Giles PJ, Sheerin AN, Smith SK, Lawton JJ, Ostler EL, Rhys-Williams W, Kipling D, Faragher RG. Microarray analysis of senescent vascular smooth muscle cells: A link to atherosclerosis and vascular calcification. Exp Gerontol. 2009;44(10):659–665. doi: 10.1016/j.exger.2009.07.004. [DOI] [PubMed] [Google Scholar]
- Chen WV, Maniatis T. Clustered protocadherins. Development. 2013;140(16):3297–3302. doi: 10.1242/dev.090621. [DOI] [PMC free article] [PubMed] [Google Scholar]
- Chen Z, Trotman LC, Shaffer D, Lin HK, Dotan ZA, Niki M, Koutcher JA, Scher HI, Ludwig T, Gerald W, Cordon-Cardo C, Pandolfi PP. Crucial role of p53-dependent cellular senescence in suppression of Pten-deficient tumorigenesis. Nature. 2005;436(7051):725–730. doi: 10.1038/nature03918. [DOI] [PMC free article] [PubMed] [Google Scholar]
- Collado M, Gil J, Efeyan A, Guerra C, Schuhmacher AJ, Barradas M, Benguria A, Zaballos A, Flores JM, Barbacid M, Beach D, Serrano M. Tumour biology: senescence in premalignant tumours. Nature. 2005;436(7051):642. doi: 10.1038/436642a. [DOI] [PubMed] [Google Scholar]
- Coppe JP, Patil CK, Rodier F, Sun Y, Munoz DP, Goldstein J, Nelson PS, Desprez PY, Campisi J (2008) Senescence-associated secretory phenotypes reveal cell-nonautonomous functions of oncogenic RAS and the p53 tumor suppressor. PLoS Biol 6 (12):2853–2868. doi:10.1371/journal.pbio.0060301 [DOI] [PMC free article] [PubMed]
- Coppe JP, Desprez PY, Krtolica A, Campisi J. The senescence-associated secretory phenotype: the dark side of tumor suppression. Annu Rev Pathol. 2010;5:99–118. doi: 10.1146/annurev-pathol-121808-102144. [DOI] [PMC free article] [PubMed] [Google Scholar]
- Cosme-Blanco W, Shen MF, Lazar AJ, Pathak S, Lozano G, Multani AS, Chang S. Telomere dysfunction suppresses spontaneous tumorigenesis in vivo by initiating p53-dependent cellular senescence. EMBO Rep. 2007;8(5):497–503. doi: 10.1038/sj.embor.7400937. [DOI] [PMC free article] [PubMed] [Google Scholar]
- Courtois-Cox S, Genther Williams SM, Reczek EE, Johnson BW, McGillicuddy LT, Johannessen CM, Hollstein PE, MacCollin M, Cichowski K. A negative feedback signaling network underlies oncogene-induced senescence. Cancer Cell. 2006;10(6):459–472. doi: 10.1016/j.ccr.2006.10.003. [DOI] [PMC free article] [PubMed] [Google Scholar]
- d'Adda di Fagagna F (2008) Living on a break: cellular senescence as a DNA-damage response. Nat Rev Cancer 8 (7):512–522 [DOI] [PubMed]
- Dimri GP, Lee X, Basile G, Acosta M, Scott G, Roskelley C, Medrano EE, Linskens M, Rubelj I, Pereira-Smith O, et al. A biomarker that identifies senescent human cells in culture and in aging skin in vivo. Proc Natl Acad Sci U S A. 1995;92(20):9363–9367. doi: 10.1073/pnas.92.20.9363. [DOI] [PMC free article] [PubMed] [Google Scholar]
- Feldser DM, Greider CW. Short telomeres limit tumor progression in vivo by inducing senescence. Cancer Cell. 2007;11(5):461–469. doi: 10.1016/j.ccr.2007.02.026. [DOI] [PMC free article] [PubMed] [Google Scholar]
- Freund A, Laberge RM, Demaria M, Campisi J (2012) Lamin B1 loss is a senescence-associated biomarker. Mol Biol Cell. doi:10.1091/mbc.E11-10-0884 [DOI] [PMC free article] [PubMed]
- Hara E, Smith R, Parry D, Tahara H, Stone S, Peters G. Regulation of p16CDKN2 expression and its implications for cell immortalization and senescence. Mol Cell Biol. 1996;16(3):859–867. doi: 10.1128/mcb.16.3.859. [DOI] [PMC free article] [PubMed] [Google Scholar]
- Hayflick L, Moorhead PS. The serial cultivation of human diploid cell strains. Exp Cell Res. 1961;25:585–621. doi: 10.1016/0014-4827(61)90192-6. [DOI] [PubMed] [Google Scholar]
- Jeyapalan JC, Sedivy JM. How to measure RNA expression in rare senescent cells expressing any specific protein such as p16Ink4a. Aging (Albany NY) 2013;5(2):120–129. doi: 10.18632/aging.100536. [DOI] [PMC free article] [PubMed] [Google Scholar]
- Jun JI, Lau LF. The matricellular protein CCN1 induces fibroblast senescence and restricts fibrosis in cutaneous wound healing. Nat Cell Biol. 2010;12(7):676–685. doi: 10.1038/ncb2070. [DOI] [PMC free article] [PubMed] [Google Scholar]
- Kang TW, Yevsa T, Woller N, Hoenicke L, Wuestefeld T, Dauch D, Hohmeyer A, Gereke M, Rudalska R, Potapova A, Iken M, Vucur M, Weiss S, Heikenwalder M, Khan S, Gil J, Bruder D, Manns M, Schirmacher P, Tacke F, Ott M, Luedde T, Longerich T, Kubicka S, Zender L (2011) Senescence surveillance of pre-malignant hepatocytes limits liver cancer development. Nature 479 (7374):547–551. doi:10.1038/nature10599 [DOI] [PubMed]
- Kipling D, Jones DL, Smith SK, Giles PJ, Jennert-Burston K, Ibrahim B, Sheerin AN, Evans AJ, Rhys-Willams W, Faragher RG. A transcriptomic analysis of the EK1.Br strain of human fibroblastoid keratocytes: the effects of growth, quiescence and senescence. Exp Eye Res. 2009;88(2):277–285. doi: 10.1016/j.exer.2008.11.030. [DOI] [PubMed] [Google Scholar]
- Krizhanovsky V, Yon M, Dickins RA, Hearn S, Simon J, Miething C, Yee H, Zender L, Lowe SW (2008) Senescence of activated stellate cells limits liver fibrosis. Cell 134 (4):657–667. doi:10.1016/j.cell.2008.06.049 [DOI] [PMC free article] [PubMed]
- Krtolica A, Parrinello S, Lockett S, Desprez PY, Campisi J. Senescent fibroblasts promote epithelial cell growth and tumorigenesis: a link between cancer and aging. Proc Natl Acad Sci U S A. 2001;98(21):12072–12077. doi: 10.1073/pnas.211053698. [DOI] [PMC free article] [PubMed] [Google Scholar]
- Kuilman T, Michaloglou C, Vredeveld LC, Douma S, van Doorn R, Desmet CJ, Aarden LA, Mooi WJ, Peeper DS (2008) Oncogene-induced senescence relayed by an interleukin-dependent inflammatory network. Cell 133 (6):1019–1031. doi:10.1016/j.cell.2008.03.039 [DOI] [PubMed]
- Kuilman T, Michaloglou C, Mooi WJ, Peeper DS (2010) The essence of senescence. Genes Dev 24 (22):2463–2479. doi:10.1101/gad.1971610 [DOI] [PMC free article] [PubMed]
- Michaloglou C, Vredeveld LC, Soengas MS, Denoyelle C, Kuilman T, van der Horst CM, Majoor DM, Shay JW, Mooi WJ, Peeper DS. BRAFE600-associated senescence-like cell cycle arrest of human naevi. Nature. 2005;436(7051):720–724. doi: 10.1038/nature03890. [DOI] [PubMed] [Google Scholar]
- Mootha VK, Lindgren CM, Eriksson KF, Subramanian A, Sihag S, Lehar J, Puigserver P, Carlsson E, Ridderstrale M, Laurila E, Houstis N, Daly MJ, Patterson N, Mesirov JP, Golub TR, Tamayo P, Spiegelman B, Lander ES, Hirschhorn JN, Altshuler D, Groop LC. PGC-1alpha-responsive genes involved in oxidative phosphorylation are coordinately downregulated in human diabetes. Nat Genet. 2003;34(3):267–273. doi: 10.1038/ng1180. [DOI] [PubMed] [Google Scholar]
- Narita M, Nunez S, Heard E, Lin AW, Hearn SA, Spector DL, Hannon GJ, Lowe SW. Rb-mediated heterochromatin formation and silencing of E2F target genes during cellular senescence. Cell. 2003;113(6):703–716. doi: 10.1016/S0092-8674(03)00401-X. [DOI] [PubMed] [Google Scholar]
- Noda A, Ning Y, Venable SF, Pereira-Smith OM, Smith JR. Cloning of senescent cell-derived inhibitors of DNA synthesis using an expression screen. Exp Cell Res. 1994;211(1):90–98. doi: 10.1006/excr.1994.1063. [DOI] [PubMed] [Google Scholar]
- Osorio FG, Lopez-Otin C, Freije JM. NF-kB in premature aging. Aging (Albany NY) 2012;4(11):726–727. doi: 10.18632/aging.100502. [DOI] [PMC free article] [PubMed] [Google Scholar]
- Riabowol KT. Transcription factor activity during cellular aging of human diploid fibroblasts. Biochem Cell Biol. 1992;70(10–11):1064–1072. doi: 10.1139/o92-151. [DOI] [PubMed] [Google Scholar]
- Salama R, Sadaie M, Hoare M, Narita M. Cellular senescence and its effector programs. Genes Dev. 2014;28(2):99–114. doi: 10.1101/gad.235184.113. [DOI] [PMC free article] [PubMed] [Google Scholar]
- Saretzki G, von Zglinicki T. Replicative aging, telomeres, and oxidative stress. Ann N Y Acad Sci. 2002;959:24–29. doi: 10.1111/j.1749-6632.2002.tb02079.x. [DOI] [PubMed] [Google Scholar]
- Serrano M, Lin AW, McCurrach ME, Beach D, Lowe SW. Oncogenic ras provokes premature cell senescence associated with accumulation of p53 and p16INK4a. Cell. 1997;88(5):593–602. doi: 10.1016/S0092-8674(00)81902-9. [DOI] [PubMed] [Google Scholar]
- Sherr CJ, DePinho RA. Cellular senescence: mitotic clock or culture shock? Cell. 2000;102(4):407–410. doi: 10.1016/S0092-8674(00)00046-5. [DOI] [PubMed] [Google Scholar]
- Shimi T, Butin-Israeli V, Adam SA, Hamanaka RB, Goldman AE, Lucas CA, Shumaker DK, Kosak ST, Chandel NS, Goldman RD (2011) The role of nuclear lamin B1 in cell proliferation and senescence. Genes Dev 25(24):2579–2593. doi:10.1101/gad.179515.111 [DOI] [PMC free article] [PubMed]
- Singh T, Newman AB. Inflammatory markers in population studies of aging. Ageing Res Rev. 2011;10(3):319–329. doi: 10.1016/j.arr.2010.11.002. [DOI] [PMC free article] [PubMed] [Google Scholar]
- Subramanian A, Tamayo P, Mootha VK, Mukherjee S, Ebert BL, Gillette MA, Paulovich A, Pomeroy SL, Golub TR, Lander ES, Mesirov JP. Gene set enrichment analysis: a knowledge-based approach for interpreting genome-wide expression profiles. Proc Natl Acad Sci U S A. 2005;102(43):15545–15550. doi: 10.1073/pnas.0506580102. [DOI] [PMC free article] [PubMed] [Google Scholar]
- Suram A, Kaplunov J, Patel PL, Ruan H, Cerutti A, Boccardi V, Fumagalli M, Di Micco R, Mirani N, Gurung RL, Hande MP, d'Adda di Fagagna F, Herbig U (2012) Oncogene-induced telomere dysfunction enforces cellular senescence in human cancer precursor lesions. EMBO J 31 (13):2839–2851. doi:10.1038/emboj.2012.132 [DOI] [PMC free article] [PubMed]
- Whitfield ML, George LK, Grant GD, Perou CM (2006) Common markers of proliferation. Nat Rev Cancer 6 (2):99–106. doi:10.1038/nrc1802 [DOI] [PubMed]
- Xue W, Zender L, Miething C, Dickins RA, Hernando E, Krizhanovsky V, Cordon-Cardo C, Lowe SW. Senescence and tumour clearance is triggered by p53 restoration in murine liver carcinomas. Nature. 2007;445(7128):656–660. doi: 10.1038/nature05529. [DOI] [PMC free article] [PubMed] [Google Scholar]
- Ye X, Zerlanko B, Kennedy A, Banumathy G, Zhang R, Adams PD. Downregulation of Wnt signaling is a trigger for formation of facultative heterochromatin and onset of cell senescence in primary human cells. Mol Cell. 2007;27(2):183–196. doi: 10.1016/j.molcel.2007.05.034. [DOI] [PMC free article] [PubMed] [Google Scholar]
- Young AR, Narita M, Ferreira M, Kirschner K, Sadaie M, Darot JF, Tavare S, Arakawa S, Shimizu S, Watt FM (2009) Autophagy mediates the mitotic senescence transition. Genes Dev 23(7):798–803. doi:10.1101/gad.519709 [DOI] [PMC free article] [PubMed]
Associated Data
This section collects any data citations, data availability statements, or supplementary materials included in this article.
Supplementary Materials
Confirmation of RS and OIS. (A) Proliferation curve for IMR90 cells cultured to RS. (B) SA β-gal staining of proliferating and RS IMR90 cells. (C) Whole cell lysates from proliferating and RS IMR90 cells were fractionated by SDS-PAGE and Western blotted for markers of proliferation and senescence. GAPDH serves as a loading control. (D) SA β-gal staining of control and H-RASG12V-infected IMR90 cells. (E) Whole cell lysates from control and H-RASG12V-infected IMR90 cells were fractionated by SDS-PAGE and Western blotted for markers of proliferation and senescence. GAPDH serves as a loading control. (PDF 757 kb)
Principal component analysis (PCA) of microarray expression datasets. (A) PCA shows that major separation of array datasets is according to proliferating (PD28) versus RS (PD90). (B) PCA shows that major separation of array datasets is according to control infection versus H-RAS infection (OIS). (PDF 49 kb)
Unsupervised clustering of microarray expression datasets. (A) Unsupervised clustering shows that major separation of array datasets is according to control infection versus H-RAS infection (OIS). (B) Unsupervised clustering shows that major separation of array datasets is according to proliferating (PD28) versus RS (PD90). (PDF 1784 kb)
(XLS 5004 kb)