Abstract
Scleroderma currently affects approximately 75,000–100,000 individuals in the United States. Fibroblasts isolated from lesional skin of scleroderma patients overexpress collagens and other matrix components, and this abnormality is maintained for multiple passages in culture. To understand the molecular basis for matrix gene overexpression, we performed a differential display comparison of fibroblasts from clinically lesional and nonlesional scleroderma skin. The results suggested that protease nexin 1 (PN1), a protease inhibitor, is overexpressed in scleroderma fibroblasts. Northern blot verification showed that lesional and nonlesional scleroderma fibroblasts had three- to five-fold increased levels of PN1 mRNA compared with healthy fibroblasts. Western analysis showed that scleroderma fibroblasts also secreted more PN1. In situ hybridization of skin biopsy specimens demonstrated PN1 expression in the dermis of four out of six scleroderma patients but no PN1 expression in the dermis of six healthy volunteers. Transient or stable overexpression of PN1 in mouse 3T3 fibroblasts increased collagen promoter activity or endogenous collagen transcript levels, respectively. PN1 mutagenized at its active site and antisense PN1 both failed to increase collagen promoter activity. These results suggest that overexpression of enzymatically active PN1 may play a pathogenic role in the development of the scleroderma phenotype.
Introduction
Systemic sclerosis (SSc), or scleroderma, is a disease of extracellular matrix accumulation, vascular injury, and autoimmunity. It is part of a family of connective tissue diseases that includes polymyositis, systemic lupus erythematosus, and rheumatoid arthritis. These disorders share clinical and immunological features, are often found in overlapping forms, and are associated within families. SSc occurs with an annual incidence of 10–20 cases per million (1).
Fibrosis, the increased deposition of extracellular matrix, is a feature of scleroderma skin and visceral tissue (2). Accumulation of extracellular matrix within the skin and internal organs of scleroderma patients may lead to both morbidity and mortality. Skin involvement begins distally in the extremities and may progress, in the diffuse form of the disease, to involve extensive body areas. Cultured fibroblasts from involved skin areas display a number of characteristics termed the scleroderma phenotype. Prominent among the features of the scleroderma phenotype is overexpression of collagens type I, III, and VI, fibronectin, and glycosaminoglycans. In situ hybridization to scleroderma skin has demonstrated that at least part of the accumulation of collagen is the result of the overexpression of collagen type I mRNA (3). Even fibroblasts cultured from clinically uninvolved skin exhibit histological and biochemical abnormalities, including higher-than-normal expression levels of some matrix components such as procollagen α1(I) (4, 5).
The increased expression of matrix genes is not merely an acute response to in vivo stimulatory factors. Fibroblasts derived from scleroderma skin biopsies continue to overexpress matrix genes for 10–12 subpassages in culture (6). We are interested in understanding the molecular basis behind the heritable elevated expression of matrix genes seen in vitro. We postulated that the matrix genes are overexpressed in a fashion that correlates with altered expression of control genes such as matrix gene transcription factors. Therefore, we elected to survey the differentially expressed genes in scleroderma fibroblasts.
We used differential display of expressed genes to compare the mRNA in cultured lesional scleroderma fibroblasts with that in nonlesional scleroderma fibroblasts. By first comparing lesional and nonlesional samples from individual patients, we reduced the possibility of uncovering gene expression differences due to genetic variability. We later examined the differential display of some clones in samples from healthy controls. Differentially expressed bands were candidates for further analysis if the differential expression was reproduced in lesional and nonlesional sample pairs from multiple patients. Verification of the differential expression included Northern blot analysis of total RNA, Western analysis of protein from cultured fibroblasts, and in situ hybridization to scleroderma and healthy skin sections.
Among the first differentially expressed genes found was a sequence initially discovered in human fibroblasts, protease nexin 1 (PN1). PN1 is a serpin class protease inhibitor abundantly expressed in cultured human fibroblasts (7). Its main targets are the proteases thrombin, urinary plasminogen activator (uPA), and plasmin (8). We found that PN1 was overexpressed in scleroderma fibroblasts at both the protein and mRNA level. Using in situ hybridization, we determined that PN1 message is also overexpressed in the dermis of scleroderma skin but not in the skin of healthy individuals. To examine the possibility that PN1 might play a role in increasing collagen gene transcription, we examined the expression of the collagen promoter in transient transfections as well as the endogenous collagen transcript in cells that were stably transfected with a PN1 overexpression construct. Finally, we used site-directed mutagenesis at the active site of PN1 to engineer a gene encoding a nonfunctional protein. We examined whether protein expressed from the mutant PN1 gene or from an antisense wild-type PN1 had any effect on the collagen promoter activity.
Methods
Scleroderma and healthy human fibroblast lines.
All patients had diffuse cutaneous scleroderma (9) of less than five years’ duration. We obtained punch biopsies from the leading edge of clinically lesional skin on the upper torso, upper arm, and proximal forearm. Biopsies of nonlesional skin were obtained from clinically healthy areas of the upper arm or trunk. Biopsies were performed after patient consent and with approval of the Institutional Review Board for Human Studies at Boston University Medical Center. Separate portions of each specimen were fixed in paraformaldehyde and embedded in paraffin for in situ hybridization (see below), cultured to obtain fibroblast strains maintained as previously described (5), and frozen in liquid nitrogen. Specific scleroderma patient samples were designated P1–P10; samples from healthy volunteers were N1–N11.
Cell culture, RNA isolation, and Northern and Western analyses.
Fibroblasts were maintained in 10% FBS, with high-glucose DMEM supplemented with penicillin, streptomycin, and glutamine. For experiments, we starved confluent 10-cm plates of cells in serum-free medium for 24 h to synchronize cell populations before harvesting RNA using Trizol Reagent (GIBCO BRL, Gaithersburg, Maryland, USA) (10).
For Northern analysis, we electrophoresed approximately 10 μg of total RNA from each sample in agarose-formaldehyde gels (11). RNA was transferred to nylon membranes by capillary blotting. Membranes were stained to make total RNA visible for quantitation by soaking 5 min in 5% acetic acid, 5 min in 0.4% methylene blue dissolved in 0.5 M sodium acetate, and rinsing in deionized water to remove excess dye. The positions of the size markers (Ambion Inc., Austin, Texas, USA) and 18S and 28S ribosomal RNA were marked on the filter with pencil.
Actin, GAPDH, and PN1 probes were generated with 32P-dCTP and Ready To Go labeling beads (Pharmacia Biotech AB, Uppsala, Sweden) following the procedure provided by the manufacturer.
For Western analysis, fibroblast cultures on 10-cm plates were allowed to condition serum-free medium for 48 h, or as indicated. Medium was then harvested, and 2-ml aliquots were concentrated to approximately 50 μl using Centricon-30 columns (Amicon, Beverly, Massachusetts, USA). Protein content of concentrated media was determined using BCA reagent (Pierce Chemical Co., Madison, Wisconsin, USA), and equal amounts of protein were loaded onto SDS-PAGE gels alongside prestained molecular weight markers (Bio-Rad Laboratories Inc., Hercules, California, USA). Gels were electrophoretically transferred to nitrocellulose membranes using standard methods (12). Monoclonal antibody 2H8 (kindly provided by D.D. Cunningham, University of California–Irvine, Irvine, California, USA) to PN1, supplied as supernatant from the cultured producing cell line, was diluted 1:2 before probing the membrane. Detection of the antigen-bound α-PN1 antibody was performed using the ECL Western Blotting System (Amersham Pharmacia Biotech, Buckinghamshire, United Kingdom) following the manufacturer’s protocol.
Differential display.
We performed differential display essentially as described by Liang et al. (13). However, we prepared our cDNA at 42°C for 30 min using avian reverse transcriptase (Promega Corp., Madison, Wisconsin, USA) instead of murine reverse transcriptase.
We reamplified the differential display products as described (13) and verified the resulting secondary PCR reactions by gel electrophoresis before cloning the fragments with the TA Cloning Kit (Invitrogen Corp., San Diego, California, USA). To provide templates suitable for sequencing, plasmid DNA was purified with the Wizard Miniprep Kit (Promega Corp.). Clones were sequenced at the Boston University Center for Advanced Biotechnology Research DNA/Protein Sequencing Core, which employs an ABI automated sequencer. We employed a BLAST search at the National Center for Biotechnology Information to compare our sequences with those in GenBank.
In situ hybridization.
We performed in situ hybridization according to the method outlined by Sassoon and Rosenthal (14), incorporating details published previously (5). Tissue sections were deparaffinized, rehydrated, and treated with proteinase K (Boehringer Mannheim Biochemicals, Indianapolis, Indiana, USA). Slides were then refixed with 4% paraformaldehyde, treated with triethanolamine (Sigma Chemical Co., St. Louis, Missouri, USA), and dehydrated and air-dried prior to hybridization. Hybridization was performed in a buffer containing 50% formamide, 0.3 M NaCl, 20 mM Tris-HCl (pH 7.4), 5 mM EDTA, 10 mM NaH2PO4-H2O (pH 8.0), 10% dextran sulfate, 1× Denhardt’s solution, and 0.5 mg/ml yeast RNA. We generated sense and antisense 35S-UTP–labeled RNA probes from the PN1 cDNA–containing plasmid pRSV-PN1, described below.
Labeled probe was purified from unincorporated nucleotides on a Sephadex G50 column, and 20-μl aliquots diluted in hybridization buffer (30,000 cpm/μl) were applied to each tissue sample. Slides were then covered with siliconized coverslips and hybridized at 52°C for 16 h. After hybridization, slides were washed for 30 min with 5× SSC, 10 mM DTT at 50°C; for 20 min with 50% formamide, 2× SSC at 65°C; and twice for 10 min, each time with washing solution (0.4 M NaCl, 0.1 M Tris-HCl, 0.05 M EDTA) at 37°C. Following the treatment with RNase A (Sigma Chemical Co.) (14), slides were washed five minutes with washing solution, 15 min with 2× SSC, and 15 min with 0.1× SSC. Slides were then coated with NTB-2 (Eastman Kodak, Rochester, New York, USA) autoradiography emulsion and exposed in the dark at 4°C. We developed the exposed slides with D-19 developer (Eastman Kodak), stained them, except where noted, with Giemsa stain (Sigma Chemical Co.), and dried and mounted them.
Quantitation of exposed grains was performed using scanned photographs of unstained in situ slides. A low-power objective (×6) was used during photography to encompass the largest practical field from each section. High-resolution (300 dpi) scanned photographs were imported into NIH Image software as black and white PICT images. The density slice method was used with the density parameters set from 230 to 254. The particle size was set to between 30 and 5,000 pixels. The area of each particle was then calculated with the “Analyze Particles” function. Identical settings were used for each sample image. The average particle size (the equivalent of the average number of grains exposed by each cell in situ) was then calculated by importing the NIH Image “Results” data into Microsoft Excel.
Transfection and CAT reporter analysis.
The PN1 cDNA (generously provided by D.D. Cunningham) was excised from the original plasmid (pFLPN1) and inserted downstream of the RSV promoter in the vector pBK-RSV (Stratagene, La Jolla, California, USA) in the sense (pRSV-PN1) or antisense (pRSV-1NP) orientation. The mutant PN1 (R364K, S365T) was inserted into the same expression vector. We electroporated NIH 3T3 cells using standard methods (15) with 80 total μg of DNA, consisting of 40 μg of either the PN1 expression construct or the empty vector and 40 μg of the collagen promoter-chloramphenicol acetyl transferase (CAT) reporter construct pOBColCAT3.6In (16). Alternatively, we used lipofectamine to introduce the DNA into cells in some instances (see Results). In this case, 10 μg of DNA (total) was mixed with 30 μl of lipofectamine and 0.5 ml of DMEM. The mixture was incubated for 20 min at room temperature and then added to a plate of 3T3 cells containing 5 ml of serum-free medium. After four hours, 5 ml of medium containing 20% serum was added. Medium was changed the next day and cell extracts were harvested at 48 h. CAT activity was determined using a standard scintillation fluid overlay method (17, 18). We incubated the vials at 37°C for four hours or 25°C for 8–10 h and measured the acetylated chloramphenicol released into the scintillation fluid every hour. Protein concentrations of each extract were calculated using BCA reagent. CAT activity was divided by the protein concentration to account for variations in electroporation and extract preparation between samples. Normalizing the CAT activity to the protein concentration gave results similar to normalizing the CAT activity to an internal transfection control (data not shown). Where cells were stably transfected, lipofection was performed as described and medium was changed at 24 h; but at 48 h, cells were split to approximately 5 × 10⁵ cells per 10-cm dish, and G418 was added to 400 μg/ml. Colonies of resistant cells were isolated 8–10 d after addition of G418.
PN1 mutagenesis and thrombin binding assay.
The reactive loop of PN1 was previously identified by sequence alignment of PN1 and plasminogen activator inhibitor type I, antithrombin III, and α-1 proteinase inhibitor (19). The human PN1 cDNA was mutagenized at the reactive loop by inserting a duplex 90-bp oligonucleotide with cohesive ends between the HindIII and AccI sites (1198 and 1258 on the nexin sequence; GenBank accession no. I08037). The mutant oligo changed the amino acids arg364 and ser365 to lys364 and thr365, respectively, which was accomplished by changing the nucleotide sequence coding for these amino acids from AGA|TCA to AAG|ACA (three base changes). The sequence of the cloned mutant PN1 [R364K, S365T] was verified by automated DNA sequencing. The function of the mutant PN1 and wild-type PN1 were verified by modifying a thrombin binding assay (20). PN1-thrombin complexes are stable in SDS-PAGE gels. Previous assays measured PN1 binding activity by monitoring the formation of a 125I-labeled PN1-thrombin complex after incubating labeled thrombin with unlabeled PN1. Free thrombin and PN1-complexed thrombin are viewed on the gel. We modified this technique by utilizing in vitro synthesized PN1. We cloned the mutant and wild-type PN1 open reading frames into the vector pT 7Blue-2 (Novagen, Madison, Wisconsin, USA), which facilitates in vitro transcription and translation. We then transcribed and translated each gene using the Single Tube Protein System 2 (Novagen) in the presence of 35S-methionine, following the manufacturer’s protocol. Ten-microliter aliquots of the 50-μl transcription/translation product were incubated with 0.01, 1.0, and 100 μg/ml unlabeled bovine thrombin (Sigma Chemical Co.), each for five minutes at 37°C. SDS-PAGE loading buffer containing β-mercaptoethanol was added, and samples were incubated at 75°C for 10 min and applied to the SDS-PAGE gel. The dried gel was exposed 48 h on a phosphoimage cassette to distinguish the free and thrombin-complexed PN1. The mutant protein was expressed but failed to bind thrombin significantly, as indicated by a lack of shift of its mobility to a higher molecular weight. In contrast, both unbound and thrombin-bound forms of wild-type PN1 were seen in the thrombin binding assay (data not shown).
Results
Differential display of fibroblasts from scleroderma biopsies.
We used differential display (21–23) to compare the RNA populations from lesional and nonlesional scleroderma fibroblasts and fibroblasts from age-matched healthy human skin.
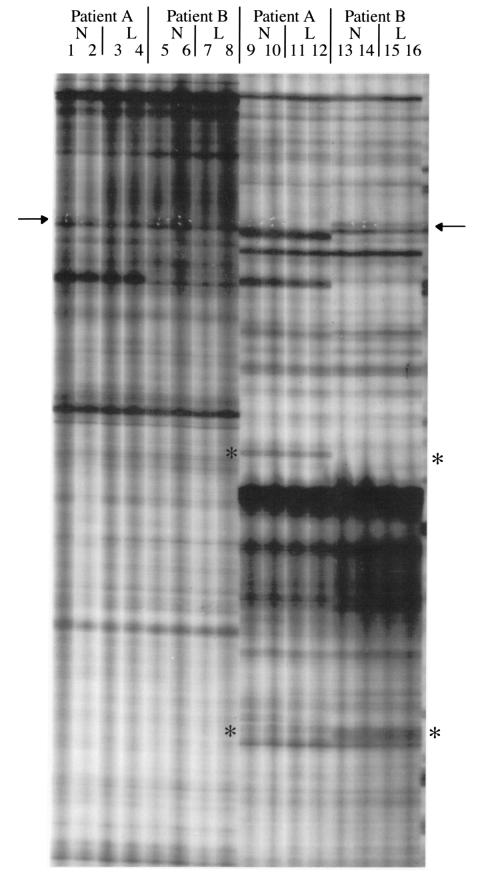
Figure 1 shows a differential display gel containing display patterns from two sets of primers. Duplicate samples were amplified with each primer pair. The figure shows samples from lesional and nonlesional tissue from each of two patients. Although the two patients yielded very similar display patterns overall, they occasionally showed differences. This is indicated by the asterisks in the figure. The differences between patients may reflect genetic variation between individuals and are unlikely to be related to scleroderma. Of greater interest, we found some differentially expressed bands between lesional- and nonlesional-derived mRNA samples (arrows).
Figure 1.
Lanes 1–8 and 9–16 show an example of differential display of RNA from scleroderma biopsy fibroblasts using two primer pairs. The 5′ primer for lanes 1–8 was RDS3, 5′-GAATTCACCAGAC; the 5′ primer for lanes 9–16 was RDS4, 5′-GAATTCGCTCACT; the 3′ primer for all samples shown is the same: HT11A, 5′-AAGCTTTTTTTTTTTA. Duplicate samples of RNA from nonlesional (N) and lesional (L) fibroblasts are shown in the designated lanes. Asterisks represent differential display bands, which are uniformly represented in nonlesional and lesional tissue from a given patient, but which differ between patients. The PN1 band is shown at the arrow and is amplified more in the nonlesional tissue (lanes 13 and 14) than in the lesional (lanes 15 and 16). White puncture marks in the x-ray film, used to define the band on the gel before cloning, are visible for PN1. Fortuitously, PN1 was amplified in all lanes where the 3′ primer HT11A was used, regardless of the sequence of the 5′ primer. We subsequently showed that the band was amplified by using the primer HT11A at both ends of the template (data not shown).
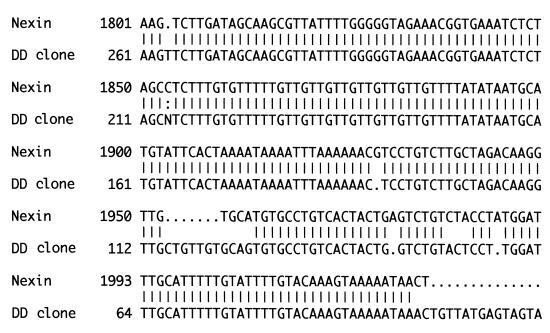
We initially performed all differential display reactions using lesional and nonlesional samples from only two patients. After examining 12 different primer pairs, one band was found to be differentially expressed: it was overexpressed in the nonlesional tissue, compared with the lesional tissue, in both of the patients. The primers that gave rise to this band were retested in separate differential display reactions using RNA from independent scleroderma fibroblast cultures. Three of the four patients tested exhibited strong overexpression of the band in nonlesional tissues relative to lesional tissues. The fourth patient slightly overexpressed the band in nonlesional tissues. After finding the repeated differential expression of the band in lesional and nonlesional samples from four patients, we excised, subcloned, and sequenced it. Its sequence matched that of the 3′ untranslated region of human PN1 (Figure 2).
Figure 2.
The differential display clone was isolated and sequenced as described in Methods. The 3′ region of the human PN1 message is represented on the top line. The sequence of the differential display (DD) clone is represented on the second line. The differential display clone was sequenced using automated fluorescent sequencing. Increasing numbers of mismatches between the database-derived human PN1 sequence and that of the differential display clone toward the bottom of the figure occur because of degradation in the fidelity of the differential display sequence as the distance from the sequencing primer increased.
Northern and Western verification of PN1 differential expression.
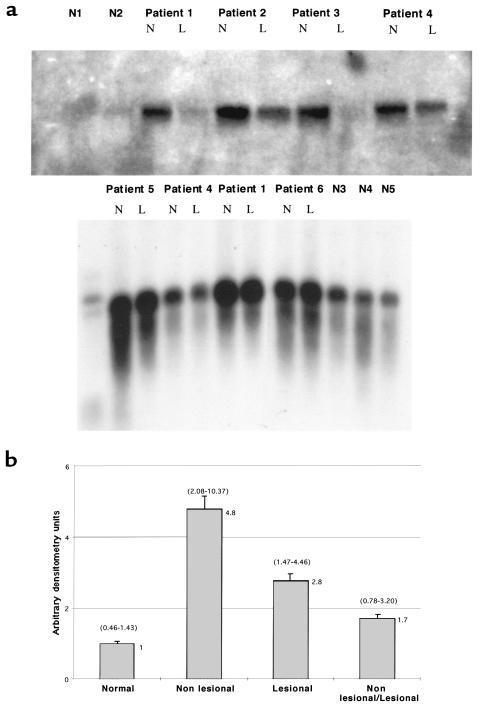
We examined PN1 mRNA in lesional and nonlesional cultured skin fibroblasts and fibroblasts from healthy individuals, using Northern analysis. Figure 3a shows two PN1 Northern analyses with total RNA from six scleroderma patients and five healthy controls. In five of six patients, PN1 mRNA was overexpressed in nonlesional compared with lesional skin, but in most patients the difference was modest. Comparing scleroderma fibroblasts to healthy fibroblasts, however, revealed a more impressive difference in PN1 expression. PN1 steady-state mRNA was significantly overexpressed in both lesional and nonlesional scleroderma fibroblasts relative to healthy controls. The bottom panel of Figure 3a was overexposed to detect the low level of expression of PN1 in the healthy lines and to allow PN1 level in the scleroderma lines to be compared with the healthy lines.
Figure 3.
(a) Northern blots using total RNA isolated from human dermal fibroblasts at low passage from scleroderma patients or healthy volunteers. Nonlesional (N) and lesional (L) fibroblast RNA is shown for each of six independent patients along with site-matched and age-matched biopsy fibroblasts from five normal individuals. Size markers are visible in the left lane of the bottom panel. Overexpression of PN1 of the correct size is shown in the patients compared with the normal individuals. (b) Summary of several Northern analyses performed as in a, incorporating the data from nonlesional and lesional samples from each of 10 patients and site-matched, age-matched samples from seven healthy volunteers. The graph shows the PN1 mRNA ratios for nonlesional and lesional tissues compared with normal tissue (second and third bars). The last bar is the mean ratio for PN1 mRNA from paired nonlesional and lesional fibroblasts. Error bars represent the SEM. The actual mean value represented by each bar is at the top right of the bar. The ranges for each bar are represented in parentheses above the respective bar. PN1 expression levels were quantitated from nonsaturated bands on x-ray film by densitometry and normalized for the amount of RNA loaded in each lane (see Methods). To compare PN1 expression values from different blots, PN1 expression values for normal individuals on a given blot were averaged, and that value was arbitrarily set to 1.0. PN1 values for each of the scleroderma samples were then determined as a factor of the mean of the normal values for each blot. Data from four Northern analyses were combined. Some of the fibroblast lines were assayed multiple times using independent RNA samples from cultures of the same line. Four of the 10 scleroderma lesional and nonlesional lines were each assayed twice; one pair of lesional and nonlesional lines was assayed three times; and two of the normal lines were assayed twice. Multiple values obtained on a single patient were averaged before use in calculating data in the figure.
Figure 3b shows a summary of densitometric analysis of four Northern blot analyses comparing scleroderma lesional, nonlesional, and healthy fibroblasts. We compared fibroblasts from seven healthy individuals with pairs of lesional and nonlesional fibroblasts from each of 10 scleroderma patients. PN1 expression in lesional cells averaged 2.8-fold higher than in healthy cells; expression in nonlesional cells averaged 4.8-fold higher than in healthy cells (P < 0.001, Student’s t-test for both comparisons). Nonlesional cells expressed 1.7-fold higher levels of PN1 mRNA than lesional cells (P < 0.02).
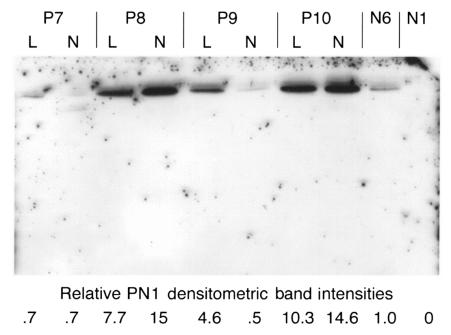
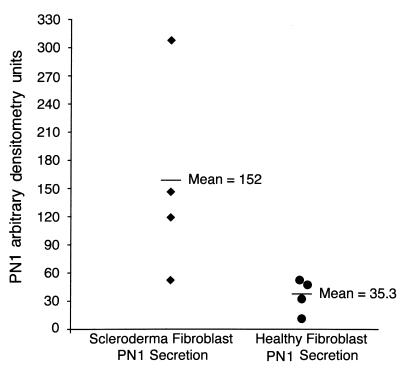
We next sought to determine whether the scleroderma cells exhibited increased PN1 secretion. We assayed PN1 secretion into serum-free medium by collecting medium 48 h after application, concentrating it, and performing Western analyses. Figure 4 shows a Western blot comparing the secreted PN1 levels from lesional and nonlesional fibroblasts of four scleroderma patients with those of lines from two healthy individuals. One of the two healthy lines showed no detectable PN1 signal. PN1 was detected in supernatants of all scleroderma fibroblast cultures, at levels up to 15-fold greater than the healthy line that showed detectable expression. Although we saw higher levels of PN1 mRNA in nonlesional cells, both lesional and nonlesional cells appeared to secrete similar levels of protein (n = 4). In a separate experiment using more healthy cell lines (Figure 5), we compared PN1 secretion of four nonlesional patient fibroblast lines to four healthy fibroblast lines. The graph shows that the four nonlesional scleroderma lines secreted 1.2- to 8.8-fold more protein than the mean secretion of four independent healthy lines (Figure 5; P < 0.05 for SSc versus healthy lines).
Figure 4.
Media (conditioned for 48 h) from four scleroderma fibroblast lines, P7–P10 (lesional and nonlesional; L and N, respectively), and two normal dermal fibroblast lines, N6 and N1, were used for Western blotting. One of the two normal lines showed no detectable PN1 (N1). The other normal line was used as a baseline, and its value for secreted PN1 was arbitrarily set to 1.0. Protein concentrations were determined and equal amounts loaded in each lane. The values for the PN1 levels secreted by the scleroderma lines are shown beneath each lane.
Figure 5.
Summary of data from a second Western blot using 48-h supernatants from four scleroderma nonlesional fibroblast lines (left column) and four normal fibroblast lines (right column). The graph shows the mean PN1 band intensity (horizontal bars). Individual data points represent the individual values for the scleroderma and normal lines. All values were determined in relation to the lowest-expressing normal line, whose value for PN1 expression was set to 1.0.
PN1 message is found in a subpopulation of dermal cells in scleroderma skin sections but not in sections of healthy skin.
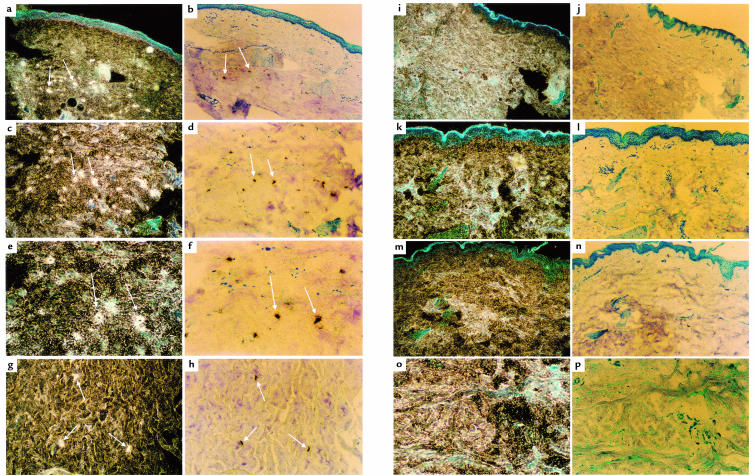
To establish whether the overexpression of PN1 mRNA found in cultured scleroderma fibroblasts reflected PN1 expression in scleroderma skin, we performed in situ hybridization. We used antisense and sense human PN1 as probes. Sections from five lesional and six nonlesional tissues from six scleroderma patients were examined. These were compared with sections from six healthy volunteers. Dermis from three of five lesional skin biopsies showed a strong PN1 hybridization signal with many positive cells. Four of six nonlesional scleroderma skin biopsies also showed cells positive for PN1 mRNA. None of the six biopsies from healthy volunteers showed any detectable PN1 signal. No signal was seen when the control sense PN1 RNA was used as a probe (data not shown).
Figure 6 shows corresponding dark- and bright-field views of PN1 expression from scleroderma patient (a–h) samples. No signal can be seen in the samples from healthy control (i–p) skin biopsies. In the dark-field views, scleroderma cells with cytoplasmic PN1 mRNA surrounding distinct nuclei can be seen (e). The positively stained cells are generally located within the deeper reticular levels of the dermis (a). They are usually well separated from the epidermis and distinct from dermal structures such as blood vessels and hair follicles. They are also distinct from cell clusters that may be immune cell infiltrations found in scleroderma sections. These observations suggest that the labeled cells are fibroblasts. Interestingly, not all fibroblasts are labeled. For example, compare the scleroderma fibroblasts visible by their blue Giemsa-stained nuclei in Figure 6f with their neighboring brown-black PN1 antisense–labeled cells. A distinct subpopulation of the fibroblasts in the deep dermis express PN1 at detectable levels.
Figure 6.
Dark-field and bright-field views of in situ hybridization of scleroderma (a–h) and healthy (i–p) skin, using 35S-labeled antisense PN1 as a probe (see Methods). Pairs of dark-field and bright-field views of each sample are adjacent. A sample of the PN1-expressing positive cells in scleroderma skin (a–h) are identified with white arrows. a, b, i, and j were photographed using a ×6 objective. In these panels, and in some others, the blue uppermost layer is the epidermis. e–h show the deeper, reticular dermis. Blue-stained nuclei in the dermis can be seen in several of the bright-field views. White grains in the dark-field views correspond to the dark-stained cells in the bright-field views and represent hybridization to PN1 mRNA. a and b (×6) represent scleroderma patient P9; c and d (×10) and e and f (×20) represent patient P7; g and h (×10) represent patient P10. i–p represent four normal samples: i and j (×6) represent N11; k and l (×10) represent N10; m and n (×10) represent N7; o and p (×20) represent N9.
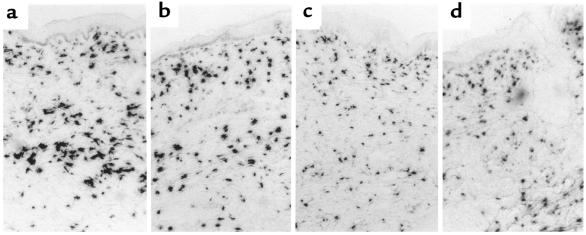
To verify that the scleroderma biopsies used in the PN1 in situ studies also showed overexpression of collagen mRNA, we performed in situ hybridization on several of these same biopsies using a human collagen α1(I) antisense probe. Figure 7 shows these results. Figure 7, a and b, show in situ hybridization to α1(I) procollagen mRNA from lesional tissues of patients P7 (represented in Figure 6, c–f) and P9 (represented in Figure 6, a and b), respectively. Figure 7, c and d, show procollagen mRNA in two biopsies from healthy individuals, N7 (represented in Figure 6, m and n) and N9 (represented in Figure 6, o and p). To objectively compare the in situ collagen signal among the scleroderma and healthy skin samples, we digitized images of these in situs and used computerized image analysis to calculate the average area of each cell exhibiting collagen expression. The two scleroderma lesional samples shown, P7 and P9, exhibited 26.6 and 32.4% of their cells, respectively, with signal areas above 210 pixels. The two healthy lines shown, N7 and N9, exhibited 12.2 and 7.0% of their cells, respectively, with signal areas above 210 pixels. Thus, a significantly higher percentage of the cells in the scleroderma biopsies exposed large areas of silver grains, reflecting higher collagen message expression. This conforms with our earlier data showing that scleroderma fibroblasts have a higher proportion of cells with very high collagen α1(I) mRNA (5).
Figure 7.
Bright-field views of in situ hybridization to scleroderma (a and b) and healthy (c and d) skin, using antisense collagen α1(I) as a probe. a and b represent lesional skin from patients P7 and P9, respectively. c and d are normal samples: N7 and N9, respectively. Each view was made using a ×6 objective, and the epidermis is visible at the top of each panel. No counterstain was used.
PN1 expression induces collagen promoter activity in 3T3 fibroblasts.
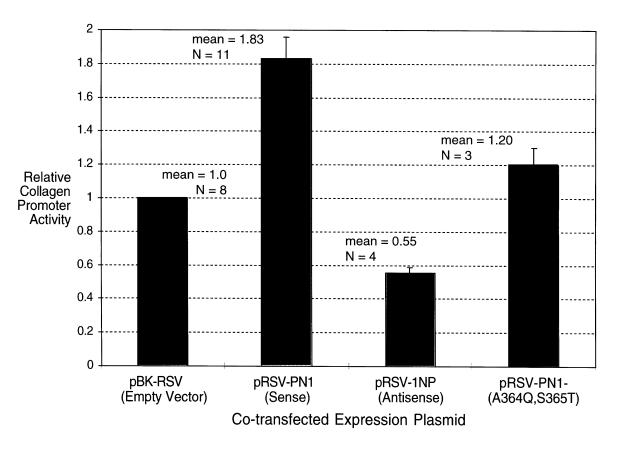
We overexpressed the PN1 gene with a collagen promoter-CAT reporter to establish whether PN1 affects collagen expression. A putative fragment of the human promoter that controls collagen overexpression in scleroderma fibroblasts has been identified (24). We cotransfected a plasmid containing the rat homologue of this region, the collagen α-1(I) promoter driving expression of a CAT marker (pOBColCAT3.6In) (16), with a plasmid containing the PN1 cDNA in either the sense or the antisense orientation. Figure 8 shows that overexpression of PN1 in the sense orientation led to a consistent, nearly twofold increase in the expression of the collagen promoter. Northern analysis confirmed expression of the PN1 cDNA (data not shown). Overexpression of PN1 in the antisense orientation appeared to inhibit expression of the collagen promoter. This supports the notion that PN1 may play a role in the regulation of collagen promoter activity in fibroblasts.
Figure 8.
CAT activity of extracts from NIH 3T3 fibroblasts 48 h after electroporation or lipofection with a 3.6-kb rat collagen α1(I) promoter driving CAT and either an empty control vector (pBK-RSV), a PN1 sense overexpression construct (pRSV-PN1), a PN1 antisense over expression construct (pRSV-1NP), or an inactive PN1 construct (pRSV-PN1–[A364Q, S365T]). n represents the number of independent transfections that were performed in the determination of each data point. Error bars represent the SEM of each data set.
PN1 and other serpins bind to their targets by inserting their reactive loop into the target protease’s substrate binding site. To verify that activation of the collagen promoter by the PN1-expressing plasmid depended on expressed PN1 protein and to determine whether the effect was due to the enzymatic activity of PN1 or simply an ancillary binding activity, we mutated the active site of PN1.
An active-site mutant of PN1 that no longer expresses proteinase inhibitory activity failed to significantly induce collagen promoter activity (Figure 8) (n = 3; 1.2 ± 0.21–fold induction by mutant PN1 [R364K, S365T], mean ± SE), whereas wild-type PN1 did (n = 3; 1.7 ± 0.21–fold induction by wild-type in parallel experiments).
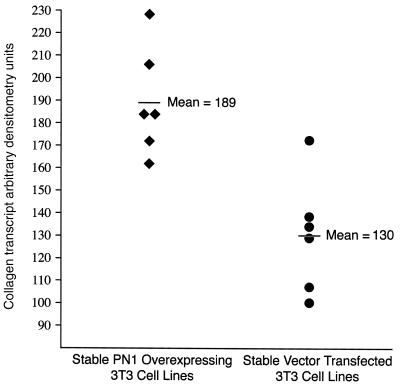
Finally, we examined whether the endogenous level of the type I collagen transcript was altered in mouse 3T3 fibroblasts. Since transient transfection introduces the DNA into only a fraction of the cells, we delivered the PN1 gene overexpression construct into 3T3 cells and stably selected for its permanent expression. We took advantage of the neo gene on the overexpression construct and isolated six G418-resistant colonies transfected with the PN1 overexpression construct and six G418-resistant colonies transfected with the empty pBK-RSV expression vector as a negative control. These colonies were grown as separate isolates under continuous selection. When sufficient cells were obtained, the 12 cultures were plated onto separate 10-cm dishes at 1 × 10⁶ cells per dish, and their RNA was harvested after four days. Northern analysis of the endogenous mouse collagen transcript (Figure 9) showed a modest but consistent and significant difference between the six PN1 overexpression cells and the six lines transfected with the empty vector control. The six PN1 overexpression lines exhibited 1.5-fold higher collagen transcript levels than the six lines stably transfected with the empty vector (two-tailed t test: P < 0.0034).
Figure 9.
The PN1 overexpression vector pBK-RSVPN1 or the empty vector control pBK-RSV were stably introduced into 3T3 fibroblasts. G418 selection for the neo gene on each plasmid gave rise to independent colonies. Six colonies from each transfection were picked and grown. Each line was plated at 1 × 10⁶ cells per 10-cm plate as described in Methods. After four days, total RNA was isolated, and Northern analysis was performed as in Methods using type I collagen as a probe. The PN1-overexpressing lines exhibited 1.5-fold higher levels of the collagen transcript (P < 0.0034).
Discussion
The regions of thickened skin and high collagen gene expression in the extremities of patients with SSc are referred to as lesional, or involved. Clinically uninvolved, or nonlesional, regions exhibit healthy thickness and pliability but may show some of the biochemical abnormalities of lesional skin (presumably reflecting a prelesional state). We performed a differential display comparison of gene expression in scleroderma fibroblasts from lesional and nonlesional skin biopsies. Since we were able to compare two tissues from the same individual, we avoided gene expression differences that might arise because of genetic polymorphisms in different individuals. Furthermore, we took advantage of the fact that cultures of fibroblasts from scleroderma skin maintain high levels of collagen gene expression for several passages in culture. Thus, we hypothesized that one or more gene expression abnormalities in scleroderma skin are responsible for excess collagen expression in the disease and that this abnormality is maintained in fibroblasts cultured from patients with the disease.
One of the first genes revealed by differential display using lesional and nonlesional fibroblasts encoded PN1. Baker et al. (7) first discovered and characterized PN1 secreted from human foreskin fibroblasts as a serpin-class inhibitor of thrombin. In addition to inhibiting thrombin, PN1 has a physiologically significant binding affinity for both plasmin and urokinase (uPA) (8). Thus, although the exact physiological target of PN1 has not been ascertained, the possibilities include several mediators of matrix metabolism.
Initially, the overexpression of PN1 was discovered by virtue of expression differences between lesional and nonlesional skin. However, we subsequently found that PN1 is aberrantly overexpressed in both lesional and nonlesional skin compared with healthy skin fibroblasts. Northern analysis showed that fibroblasts cultured from scleroderma biopsy material expressed steady-state amounts of PN1 mRNA at levels three- to fivefold higher than fibroblasts from healthy individuals.
Western analyses reflected the higher PN1 message levels in scleroderma cells: scleroderma cells secreted significantly more PN1 into serum-free medium than healthy fibroblasts. It was previously shown that PN1 in media conditioned by healthy fibroblasts reaches an equilibrium within 48 h (25). At equilibrium, the cells secrete and take up PN1 at equal rates. Our results demonstrate that medium conditioned by scleroderma cells contained significantly higher levels of PN1 at 48 h and continued to do so at 72 h. Thus, cultured scleroderma cells not only express higher levels of mRNA but synthesize enough protein to increase the equilibrium level of protein in the medium.
To determine whether the in vitro data reflected in vivo PN1 expression, we assayed PN1 expression in situ, using fixed, paraffin-embedded skin sections from lesional and nonlesional areas of scleroderma skin and skin from healthy volunteers. These results showed no detectable levels of PN1 mRNA in any of six healthy skin sections but showed distinct signals from three of five lesional scleroderma samples and four of six nonlesional samples. Previous investigators had reported no detectable expression of PN1 in healthy fresh foreskin (26). The absence of PN1 expression in situ in healthy dermal fibroblasts and foreskin suggests that in vitro expression seen in cells cultured from healthy skin biopsies is a reflection of the activation seen with culture conditions. Indeed, a variety of metabolic activities, ranging from proliferation to collagen biosynthesis, are elevated in vitro. In situ hybridization data are thus a better reflection of in vivo differences between scleroderma and healthy fibroblasts than those obtained from cultured cells.
The in situ labeling of scleroderma skin showed most signal arising from cells in the deep dermis. This, along with the shape of the labeled cells as seen in the dark-field views and the fact that the labeled cells are removed from the locations of other identifiable cells (such as endothelial cells near blood vessels and larger immune cells such as macrophages), indicates that the labeled cells are fibroblasts. The fibroblasts are labeled nonuniformly: a few cells exhibit strong signals, whereas many show none. This is consistent with the hypothesis that the dermal fibroblasts are heterogeneous (5). Since PN1 is a secreted protein, overexpression in a subpopulation of cells may nonetheless affect the neighboring cells’ matrix metabolism through a trans mechanism.
Using transient transfection assays, we also showed that PN1 overexpression led to increased collagen promoter activity. Mutagenized PN1, shown to be expressed and inactive in an in vitro thrombin binding assay, had no significant effect on collagen promoter activity; overexpression of an antisense PN1 construct appeared to reduce it. Transient transfection with promoter-reporter constructs showed that collagen promoter activity increased approximately twofold when PN1 was overexpressed. The levels of the endogenous collagen transcript increased to a smaller extent in cells stably transfected with the PN1 overexpression construct. (We did not examine the level of collagen protein in these lines.) Although the increased level of collagen mRNA in stably transfected cells was only 50% more than in cells stably transfected with the empty overexpression vector, the effect was highly reproducible. Six independent overexpression lines expressed significantly more collagen than six independent controls. Since the level of collagen synthesis in fibroblasts from scleroderma patients (27) or in scleroderma skin (3) is only twofold higher than in healthy individuals, a small effect on collagen levels may be nonetheless very significant in the progression of the disease.
In vitro evidence suggests a role for PN1 as an inhibitor of matrix metalloproteinase (MMP) activation. PN1 binds tightly to and inhibits both plasmin and the plasminogen activator urokinase (7). However, whether plasmin or urokinase play a role in the in vivo activation of MMPs such as procollagenase is not well documented. Therefore, we cannot conclude whether another potential effect of PN1 overexpression in scleroderma is to reduce activation of collagenase or other MMPs. However, if this is the case, then PN1 may regulate both the level of collagen transcript and the rate of collagen degradation. This would further increase its role in the net accumulation of matrix in the pathogenesis of scleroderma.
PN1 mRNA was seen in both lesional and nonlesional skin fibroblasts by in situ hybridization and after in vitro culture. Previous in vitro studies indicated that fibroblasts derived from nonlesional scleroderma skin overexpress collagen RNA, but to a lesser extent than those derived from lesional skin (5). Both scleroderma lesional and nonlesional skin biopsies have been shown to overexpress procollagen protein compared with healthy skin (4). Thus, the overexpression of PN1 in nonlesional skin may either precede or be an early event in the pathogenesis of fibrosis.
In summary, we used differential display to identify a gene (PN1) that is overexpressed in a disease of matrix gene expression. We verified the overexpression of PN1 in fibroblast cultures from scleroderma patient biopsy material using Northern and Western analyses. We also directly showed the expression of PN1 in four of six scleroderma patients by in situ hybridization to skin biopsy material. Skin from six healthy volunteers showed no signal, indicating that the PN1 gene is not expressed in healthy skin. The expression of PN1 mRNA in scleroderma patient skin and the absence of detectable levels of PN1 in skin from healthy volunteers suggest an in vivo role for PN1 in the progression of the scleroderma phenotype. The factors leading to overexpression of PN1 in scleroderma, and the relative role of PN1 and other matrix regulatory factors, deserve further study.
Acknowledgments
We would like to thank D.D. Cunningham for helpful discussions and for providing the PN1 cDNA and the anti-PN1 monoclonal antibody used in these studies. We also gratefully acknowledge the support of the Scleroderma Research Fund of Boston, the Scleroderma Federation, and the United States Public Health Service (National Institutes of Health grants RO1 AR-32343 and P60 AR-20613).
Footnotes
Karen Strehlow's present address is: Department of Pathology, New England Medical Center Hospitals, Boston, Massachusetts 02111, USA.
References
- 1.Silman, A.J., and Hochberg, M.C. 1993. Epidemiology of the rheumatic diseases. Oxford University Press. New York, NY. 192–199.
- 2.Mitchell H, Bolster MB, LeRoy EC. Scleroderma and related conditions. Med Clin North Am. 1997;81:129–149. doi: 10.1016/s0025-7125(05)70508-3. [DOI] [PubMed] [Google Scholar]
- 3.Kahari VM, Sandberg M, Kalimo H, Vuorio T, Vuorio E. Identification of fibroblasts responsible for increased collagen production in localized scleroderma by in situ hybridization. J Invest Dermatol. 1988;90:664–670. doi: 10.1111/1523-1747.ep12560826. [DOI] [PubMed] [Google Scholar]
- 4.Claman HN, Giorno RC, Seibold JR. Endothelial and fibroblastic activation in scleroderma. The myth of the “uninvolved skin”. Arthritis Rheum. 1991;34:1495–1501. doi: 10.1002/art.1780341204. [DOI] [PubMed] [Google Scholar]
- 5.Jelaska A, Arakawa M, Broketa G, Korn JH. Heterogeneity of collagen synthesis in normal and systemic sclerosis skin fibroblasts. Increased proportion of high collagen-producing cells in systemic sclerosis fibroblasts. Arthritis Rheum. 1996;39:1338–1446. doi: 10.1002/art.1780390811. [DOI] [PubMed] [Google Scholar]
- 6.Vuorio TK, Kahari VM, Lehtonen A, Vuorio EI. Fibroblast activation in scleroderma. Scand J Rheumatol. 1984;13:229–237. doi: 10.3109/03009748409100391. [DOI] [PubMed] [Google Scholar]
- 7.Baker JB, Low DA, Simmer RL, Cunningham DD. Protease-nexin: a cellular component that links thrombin and plasminogen activator and mediates their binding to cells. Cell. 1980;21:37–45. doi: 10.1016/0092-8674(80)90112-9. [DOI] [PubMed] [Google Scholar]
- 8.Scott RW, et al. Protease nexin. Properties and a modified purification procedure. J Biol Chem. 1985;260:7029–7034. [PubMed] [Google Scholar]
- 9.LeRoy EC, et al. Scleroderma (systemic sclerosis): classification, subsets and pathogenesis. J Rheumatol. 1988;15:202–205. [PubMed] [Google Scholar]
- 10.Chomczynski P. A reagent for the single-step simultaneous isolation of RNA, DNA and proteins from cell and tissue samples. Biotechniques. 1993;15:532–534, 536–537. [PubMed] [Google Scholar]
- 11.Rosen KM, Lamperti ED, Villa-Komaroff L. Optimizing the Northern blot procedure. Biotechniques. 1990;8:398–403. [PubMed] [Google Scholar]
- 12.Davis, L.G., Dibner, M.D., and Battey, J.F. 1986. Basic methods in molecular biology. Elsevier Science Publishers. New York, NY. 306–314.
- 13.Liang P, Averboukh L, Pardee AB. Distribution and cloning of eukaryotic mRNAs by means of differential display: refinements and optimization. Nucleic Acids Res. 1993;21:3269–3275. doi: 10.1093/nar/21.14.3269. [DOI] [PMC free article] [PubMed] [Google Scholar]
- 14.Sassoon D, Rosenthal N. Detection of messenger RNA by in situ hybridization. Methods Enzymol. 1993;225:384–404. doi: 10.1016/0076-6879(93)25027-y. [DOI] [PubMed] [Google Scholar]
- 15.Chu G, Berg P. Electroporation for the efficient transfection of mammalian cells with DNA. Nucleic Acids Res. 1987;15:1311–1326. doi: 10.1093/nar/15.3.1311. [DOI] [PMC free article] [PubMed] [Google Scholar]
- 16.Bedalov A, et al. Regulation of the alpha 1(I) collagen promoter in vascular smooth muscle cells. Comparison with other alpha 1(I) collagen-producing cells in transgenic animals and cultured cells. J Biol Chem. 1994;269:4903–4909. [PubMed] [Google Scholar]
- 17.Chauchereau A, Astinotti D, Bouton MM. Automation of a chloramphenicol acetyltransferase assay. Anal Biochem. 1990;188:310–316. doi: 10.1016/0003-2697(90)90612-d. [DOI] [PubMed] [Google Scholar]
- 18.Nielsen DA, Chang TC, Shapiro DJ. A highly sensitive, mixed-phase assay for chloramphenicol acetyltransferase activity in transfected cells. Anal Biochem. 1989;179:19–23. doi: 10.1016/0003-2697(89)90193-0. [DOI] [PubMed] [Google Scholar]
- 19.Sommer J, et al. cDNA sequence coding for a rat glia-derived nexin and its homology to members of the serpin superfamily. Biochemistry. 1987;26:6407–6410. doi: 10.1021/bi00394a016. [DOI] [PubMed] [Google Scholar]
- 20.Farrell DH, Cunningham DD. Human fibroblasts accelerate the inhibition of thrombin by protease nexin. Proc Natl Acad Sci USA. 1986;83:6858–6862. doi: 10.1073/pnas.83.18.6858. [DOI] [PMC free article] [PubMed] [Google Scholar]
- 21.Liang P, Pardee AB. Recent advances in differential display. Curr Opin Immunol. 1995;7:274–280. doi: 10.1016/0952-7915(95)80015-8. [DOI] [PubMed] [Google Scholar]
- 22.Liang P, et al. Analysis of altered gene expression by differential display. Methods Enzymol. 1995;254:304–321. doi: 10.1016/0076-6879(95)54022-9. [DOI] [PubMed] [Google Scholar]
- 23.Liang P, et al. Differential display using one-base anchored oligo-dT primers. Nucleic Acids Res. 1994;22:5763–5764. doi: 10.1093/nar/22.25.5763. [DOI] [PMC free article] [PubMed] [Google Scholar]
- 24.Hitraya EG, Jimenez SA. Transcriptional activation of the alpha 1(I) procollagen gene in systemic sclerosis dermal fibroblasts. Role of intronic sequences. Arthritis Rheum. 1996;39:1347–1354. doi: 10.1002/art.1780390812. [DOI] [PubMed] [Google Scholar]
- 25.Howard EW, Knauer DJ. Biosynthesis of protease nexin-I. J Biol Chem. 1986;261:14184–14190. [PubMed] [Google Scholar]
- 26.McGrogan, M., et al. 1990. Structure of the human protease nexin gene and expression of recombinant forms of PN-1. In Serine protease and their serpin inhibitors in the nervous system. B.W. Festoff, editor. Plenum Press. New York, NY. 147–161.
- 27.Eckes B, Mauch C, Huppe G, Krieg T. Differential regulation of transcription and transcript stability of pro-alpha 1(I) collagen and fibronectin in activated fibroblasts derived from patients with systemic scleroderma. Biochem J. 1996;315:549–554. doi: 10.1042/bj3150549. [DOI] [PMC free article] [PubMed] [Google Scholar]


