Abstract
T Regulatory cells (Treg) play crucial roles in the regulation of cellular immunity. The development of Treg cells depends on signals from T cell receptors (TCR) and IL-2 receptors and is influenced by a variety of transcription factors. The basic helix-loop-helix (bHLH) proteins are known to influence TCR signaling thresholds. Whether this property impacts Treg differentiation is not understood. Here, we interrogated the role of bHLH proteins in the production of Treg cells using the CD4 promoter-driven Id1 transgene. We found that Treg cells continued to accumulate as Id1 transgenic mice aged, resulting in a significant increase in Treg cell counts in the thymus as well as in the periphery compared to wild type controls. Data from mixed-bone marrow assays suggest that Id1 acts intrinsically on developing Treg cells. We made a connection between Id1 expression and CD28 co-stimulatory signaling because Id1 transgene expression facilitated the formation of Treg precursors in CD28−/− mice and the in vitro differentiation of Treg cells on thymic dendritic cells despite the blockade of costimulation by anti-CD80/CD86. Id1 expression also allowed in vitro Treg differentiation without anti-CD28 co-stimulation, which was at least in part due to enhanced production of IL-2. Notably, with full strength of co-stimulatory signals, however, Id1 expression caused modest but significant suppression of Treg induction. Finally, we demonstrate that Id1 transgenic mice were less susceptible to the induction of experimental autoimmune encephalomyelitis (EAE), thus illustrating the impact of Id1-mediated augmentation of Treg cell levels on cellular immunity.
Introduction
T Regulatory (Treg) cells play important roles in maintaining immune homeostasis and preventing organ-specific autoimmune diseases (1,2). Augmentation of the number and activity of Treg cells in the periphery represents a potential strategy for treating autoimmune diseases. On the other hand, increased Treg function causes immune suppression and is associated with chronic or persistent infection and tumor progression (3,4). CD4+ Tregs can be categorized as naturally occurring and induced subsets, both of which are characterized by the expression of a key transcription factor, FoxP3, and IL-2 receptor α, CD25 (5,6).
Differentiation of Treg cells (Treg) in the thymus is thought to be a two-step process (7-9). TCR signaling resulting from relatively high affinity stimulation by self antigens instructs CD4 single positive T cells to up-regulate CD25 and other molecules to become Treg precursors. These CD4+CD25+ cells can then turn on the FoxP3 gene in the presence of IL-2 but independently of TCR signaling. As such, defects in IL-2 receptor signaling compromise Treg cell production, possibly by impairing cell survival (10-13). CD28-mediated co-stimulatory signaling is also necessary for Treg differentiation as mice deficient in co-stimulatory receptors such as CD28 have significantly reduced numbers of Treg cells (14-17). Although triggering CD28 receptors leads to induction of IL-2 secretion, CD28 was shown to have additional functions during Treg differentiation (18). Conversion of naive T cells into inducible Treg (iTreg) cells in vitro or during infection also requires these signals as well as TGFβ (19-22). Together, activation of these signaling pathways results in the recruitment of various transcription factors such as c-Rel, FOXO and STAT5 to the regulatory sequences of the FoxP3 gene to stimulate its transcription (10,23,24). Therefore, influencing any or all of these signaling pathways could impact Treg differentiation and homeostasis.
E proteins, including products of the E2A,HEB and E2-2 genes, are important transcription factors in lymphocyte development (25-27). They bind E boxes as homo or heterodimers to activate transcription. Their function can be hindered by a family of naturally occurring dominant-negative inhibitors, called Id proteins (Id1-4). Id3 expression is dramatically induced by pre-TCR signaling, whereas E proteins are shown to control the thresholds of cellular responses to pre-TCR signaling (28,29). Inhibition of E protein function by overexpression of Id1 also reduces the signaling threshold in thymocytes and facilitates the proliferation and survival of CD4+ T cells from the thymus or in the periphery in the absence of exogenous co-stimulation (30-32). Whether the capacity of bHLH proteins to influence TCR signaling thresholds can impact Treg differentiation and homeostasis has not been investigated.
E and Id proteins are known to play pivotal roles in conventional T cell development in the thymus during T cell commitment, β selection and positive selection, as well as γδ T cell differentiation (33-38). The function of these proteins in the production and maintenance of Treg cells is less well understood. Maruyama et al. showed that Id3 deficient mice possess fewer T regulatory cells at three weeks of age and naïve T cells from these mice exhibited impaired Treg induction in vitro (39). As the mice age, Treg cells accumulate to a normal or higher than normal level. However, this phenotype may be complicated by the fact that Id3−/− mice develop autoimmune diseases and exhibit abnormal γδ T cell differentiation at later stages of adult life (40,41). Intriguingly, these authors have demonstrated that E2A proteins promote the transcription of the FoxP3 gene. To reconcile the disconnect between a potential increase in E protein activity in Id3 deficient cells and a reduction in Treg differentiation, they proposed that elevation of IL-4 and GATA3 expression in Id3−/− mice has a dominant suppressive effect on FoxP3 expression and Treg differentiation (39). Notably, these studies were mostly based on models of iTreg differentiation. The mechanisms remains to be defined how Id3 deficiency impairs the generation of Treg cells in vivo.
To further illustrate the role of E proteins and Id molecules in Treg differentiation, we made use of our transgenic mice in which Id1 cDNA is driven by the CD4 promoter, and examined Treg differentiation under the condition of gain-of-Id function (42). Since Id1 and Id3 share extensive homology and have been shown to be functionally redundant (43), over expression of Id1 should mimic the situation of Id3 up-regulation upon TCR signaling. Indeed, we observed opposite effects of Id1 overexpression to that of Id3 deficiency, namely, an overall increase of Treg cell counts in the Id1 transgenic animals in a T cell-intrinsic manner. Accordingly, these mice developed experimental autoimmune encephalomyelitis (EAE) with less severity. We showed that Id1 transgenic mice have a higher frequency of CD4+CD25+CD122+GITR+FoxP3− cells in the thymus, which are thought to be enriched in Treg precursors and whose formation depends on CD28 signaling (7,16). Id1 expression in CD28−/− mice partially corrected the deficit of these cells. Moreover, we show that Id1-expressing naïve T cells have a higher propensity to differentiate into iTreg cells in the absence of CD28-mediated TCR co-stimulation. On the contrary, Treg induction with robust co-stimulation was found to be suppressed by the Id1 transgene. Since Id3 is up-regulated by TCR and CD28 signaling, Id proteins play a distinct role during Treg differentiation.
Materials and Methods
Mice
The CD4-Id1 transgenic strain was as previously described and backcrossed onto the C57BL/6J background for 6-8 generations and littermates were used as wild type controls (32). CD28−/− mice (stock number 2666) and OT-II mice (B6.Cg-Tg(TcraTcrb)425cbn/J, stock number 004194) on the C57BL/6J background were purchased from the Jackson laboratory (Bar Harbor, Maine) and crossed with Id1 transgenic mice.
Culture medium, antibodies and reagents
RPMI1640 medium containing 10% FCS was used for CD4 naïve T cell cultures. The following antibodies were purchased from BD BioSciences (San Jose, CA): anti-mouse CD3 (145-2C11), anti-mouse CD28 (37.51), anti-mouse IL-2, anti-CD4-PerCP, anti-CD4-PECy7, anti-CD8-FITC, anti-CD25-APC, anti-CD25-PE, anti-CD44-FITC, anti-CD62L-PE, anti-BrdU-FITC. Anti-FoxP3-APC, anti-IFNγ-APC, and anti-IL-17A-PE were from eBioscience (San Diego, CA). Anti-Helios, anti-CD122 and anti-GITR were from Biolegend (San Diego, CA). Recombinant mouse IL-2 and IL-7 were purchased from R&D Systems (Minneapolis, MN) and ovalbumin was from Sigma-Aldrich (St Louis, MO).
Isolation of naïve CD4 cells and in vitro Treg induction
Lymphocytes from lymph nodes were stained with fluorochrome-conjugated antibodies for 30 minutes at 4°C. CD4+CD62LhiCD44loCD25− cells were sorted using a BD FACS Aria II. The anti-CD3 antibody was coated onto 96-well flat-bottom plates at 1 μg/ml in PBS overnight and washed once with PBS. Naïve CD4 cells in 100 μl of complete medium were then added into the well at a density of 2×10⁶ cells/ml. The culture medium was supplemented with TGFβ (1ng/ml) plus or minus anti-CD28 (2 μg/ml or as indicated otherwise). For some experiments, exogenous IL-2 or anti-IL-2 was added into the culture. The cells were incubated at 37°C in an atmosphere containing 5% CO2 for 72 hours followed by intracellular staining for FoxP3 expression.
FACS Analysis
Lymphocytes were usually stained for the expression of surface markers for 30 minutes in PBS containing anti-CD4-PerCP, anti-CD8-FITC, and anti-CD25-PE. Cells were then washed twice with PBS and intracellular FoxP3 staining was performed with the FoxP3 staining Buffer set (eBioscience) according to the manufacturer’s instructions. After fixation and permeabilization, anti-FoxP3-APC was added and incubated for 30 minutes. For detection of thymus-derived Treg cells, anti-Helios-PE was also included.
To detect cytokine production by lymphocytes from mice immunized with peptides derived from myelin oligodendrocyte glycoprotein (MOG), cells were cultured with PMA (50 ng/ml) and ionomycin (1 μg/ml) for 4 hours with brefeldin A (3 μg/ml; Sigma-Aldrich) in complete medium. After staining for surface markers, cells were fixed with IC fixation Buffer (eBioscience) for 1 hour, and washed twice with permeabilization buffer (eBioscience), and then incubated with anti-IFNγ-APC and anti-IL-17A-PE antibodies. Samples were analyzed on a FACSCalibur using CellQuest software (BD Biosciences) or LSRII with the FlowJo software.
BrdU labeling and detection
Mice were provided with drinking water containing 1 mg/ml BrdU for 7 days and the water was changed daily. Thymocytes were fixed with 4% paraformaldehyde in PBS, pH 7.4, for 10 minutes at 25°C, washed with PBS, treated with 4 N hydrochloric acid for 15 minutes, and then neutralized with 0.1 M sodium borate, pH 8.5 for 20 minutes. Cells were incubated with anti-BrdU-FITC and anti-FoxP3-APC in PBS containing 0.2% Triton X-100 for 30 minutes at 25°C. Cells were then washed and resuspended into PBS. BrdU incorporation was quantified using a BD FACSCalibur.
In vitro differentiation of Treg cells
To generate Treg cells in vitro, 2 × 10⁵ CD4+CD25−CD69+ thymocytes sorted from OT-II/Id1tg or OT-II mice were co-cultured with 2 × 10⁴ sorted thymic dendritic cells in the presence of 40 μg/ml of ovalbumin, 10 ng/mL recombinant IL-2 and 1ng/ml IL-7 with or without anti-CD80 and anti-CD86 (5 μg/ml each) for 4 days. FoxP3 expression of the cells was then measured as described above.
To obtain thymic dendritic cells, thymuses (3-4) were chopped into small fragments with scissors and washed. The fragments were then digested with collagenase IV (2 mg/ml) and DNAse I (0.05 mg/ml), in 7.5 ml RPMI 1640 with FCS for 30 minutes at 37°C with continuous agitation. Cells were then washed and resuspended in Ficoll-paque (ρ=1.077), and centrifuged for 10 minutes at 1700 g. A low-density cell fraction was collected and the cells were stained with CD45 and CD11c antibodies for 30 minutes at 4°C. CD45+CD11chigh cells were sorted using a BD FACS Aria II.
Generation of mixed-bone marrow chimera
Bone marrow cells from CD45.1+ C57BL/6 (competitor) mice were mixed at a 1:1 ratio with CD45.2+ tester bone marrow cells from wild type or Id1tg mice. A total of 1 × 10⁷ bone marrow cells were injected intravenously into lethally irradiated (900rad) CD45.1+ recipients. The spleen and thymus of the mixed-bone marrow chimera were analyzed by flow cytometry 12 weeks after the bone marrow transplantation.
EAE mouse model
MOG35-55 peptide (2mg/ml) was emulsified with an equal volume of Complete Freund’s Adjuvant (Sigma-Aldrich, St Louis MO). The mixture was injected subcutaneously into each of the four areas near the draining lymph nodes and at 50 μl per site, follwed by intraperitoneal injection of 200 ng of pertussis toxin on Days 1 and 2. Disease progression was monitored daily. The scoring criteria were as follows: 1. Weakness of the tail; 2. Tail paralysis and hind limb weakness; 3. Partial paralysis of hind limbs; 4. Complete paralysis of hind limbs; 5. Complete paralysis of hind limbs with partial or complete paralysis of fore limbs; 6. Death.
Enzyme-linked immunosorbent assay (ELISA)
Culture supernatants were collected 2 days after Treg induction and IL-2 concentration was measured by using the Mouse IL-2 ELISA Ready-SET-Go! Kit (eBioscience, San Diego, CA) according to the manufacturer’s instruction. Each sample was assayed in triplicates. The concentration of IL-2 was calculated using a standard curve.
Statistical Analysis
Statistical analysis of the data between WT and TG samples was carried out using Student’s t test. Two-way Anova was used for multiple variant comparisons. All analyses were carried out using the Prism software.
Results
Increased representation of CD4+FoxP3+ cells in Id1tg mice
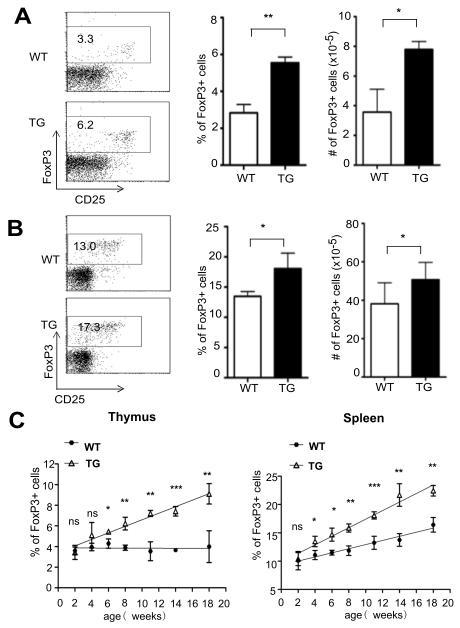
To evaluate the effects of Id up-regulation on Treg development, we made use of our CD4-Id1tg mice, in which the Id1 cDNA is driven by the CD4 promoter (32). These mice have been shown to exhibit largely normal steady-state T cell development in the thymus and periphery and live a healthy life. We examined Treg cells in the thymus of 8-week old Id1 transgenic mice and their wild type littermates by staining the cells with antibodies against CD4, CD8 and CD25 followed by intracellular staining for FoxP3. We found that both the percentage and absolute number of FoxP3+ Treg cells were increased by about 2-fold in Id1 transgenic mice (Fig. 1A). Likewise, the percentage and number of Treg cells in the spleen were also elevated, albeit not as dramatically as in the thymus (Fig. 1B).
Figure 1. Id1 transgenic mice accumulate higher levels of Treg cells.
Treg cells in the thymus (A) and spleen (B) of 8-week-old littermate wild type (WT) and CD4-Id1tg (TG) mice were measured by intracellular staining for FoxP3. Representative FACS plots of FoxP3 and CD25 expression in CD4 single positive T cells are shown on the left. Numbers in the gates show the percentage. The average percentage and number of FoxP3+ cells in 6-8 weeks old WT and TG littermates (n=4) analyzed in independent experiments are shown on the right. Results are presented as mean with SD. (C). FoxP3 expression in thymus (left) and spleen (right) of mice of different ages were examined. Each time point represents the average of 4 WT or TG littermates analyzed in independent experiments. The percentages of FoxP3+ cells in CD4+ cells are shown as mean with SD. The time course was drawn based on linear regression analysis. Unpaired Student’s t tests were performed to determine the p values at different time points. ***p<0.001; **p<0.01; *p<0.05; ns, not significant. In addition, the statistical significance of the difference between WT and TG over the time course was also determined using two-way Anova. The p value (<0.001) indicates significant interaction between the genotype and age.
We next monitored the kinetics of Treg cell production as the wild type and transgenic littermate aged. While the percentages of Treg cells in the thymus of wild type and transgenic mice were in similar ranges in neonates and young animals, transgenic mice accumulated significantly more Treg cells as they aged from 6 to 18 weeks (Fig. 1C). In contrast to a relatively stable level of thymic Treg cells in wild type mice, the percentages of transgenic Treg cells continued to increase in adulthood. Similarly, Id1 transgenic mice exhibited significant increases in the splenic Treg cell population from 4 weeks of age and the gap widened thereafter (Fig. 1C).
Augmented production of Treg cells in Id1 transgenic thymus
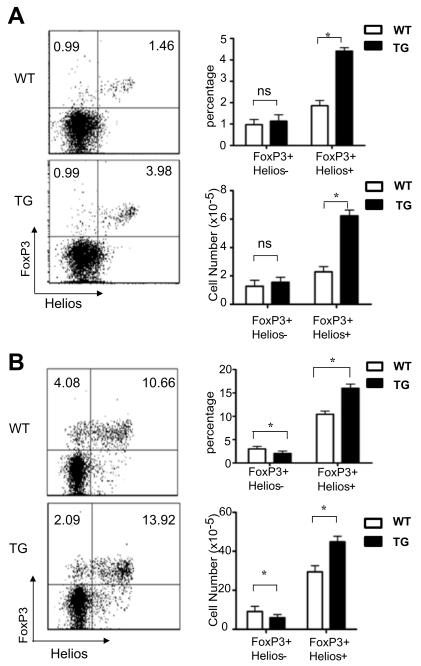
Expression of the Helios transcription factor has been shown to distinguish Treg cells derived from the thymus and periphery (44). Treg cells derived from the thymus express Helios whereas those originating in the periphery or in vitro do not. We therefore analyzed CD4+ thymocytes and splenocytes for FoxP3 and Helios expression (Fig. 2). In the thymus, the percentage and number of FoxP3+Helios+ cells were 2.4 and 2.7-fold higher in Id1 transgenic mice compared to wild type controls (Fig. 2A). In contrast, FoxP3+Helios− cells were similar between the two strains. In the spleen, the abundance of FoxP3+Helios+ cells was also increased in Id1 transgenic mice. The FoxP3+Helios− cells, on the other hand, were even found to be underrepresented in the transgenic spleen (Fig. 2B). These data suggests that the elevated level of peripheral Treg cells is mainly due to increased thymic output of Treg cells.
Figure 2. Id1 transgenic mice have more thymus-derived Treg cells.
Lymphocytes from the thymus (A) and spleen (B) of 8-week-old wild type (WT) and CD4-Id1tg (TG) littermates were analyzed by intracellular staining for FoxP3 and Helios. Representative FACS plots of FoxP3 and Helios expression in CD4 single positive T cells are shown on the left. The average percentage and number of FoxP3+ cells WT and TG littermates (n=4) analyzed in three independent experiments are shown on the right. Results are presented as mean with SD. *p<0.05; ns, not significant.
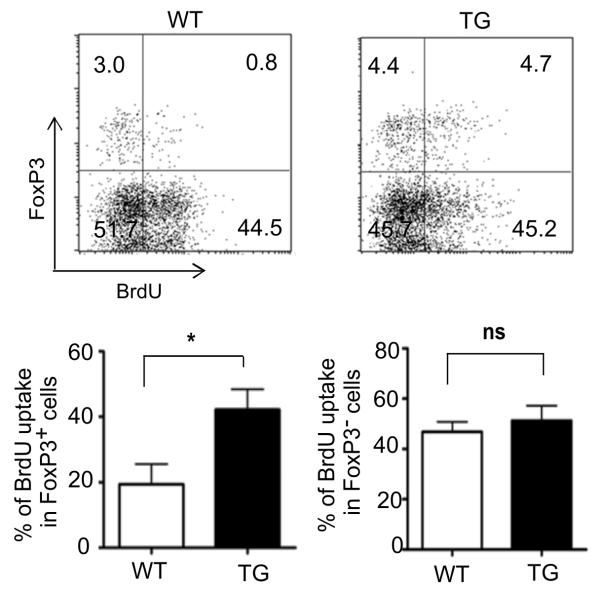
To monitor Treg production in the thymus, we performed a BrdU labeling assay by providing the mice with BrdU in drinking water for 7 days. CD4 single positive thymocytes were then analyzed for FoxP3 expression and BrdU incorporation (Fig. 3). We then determined the percentages of BrdU+ cells in the FoxP3+and FoxP3-populations separately. As shown in the bar graphs, BrdU uptake by Id1-expressing FoxP3+ cells was twice as high as the wild type counterparts, whereas BrdU labeling in the FoxP3− fraction was comparable between wild type and transgenic mice (Fig. 3). As Treg cells are thought not to proliferate in thymus (45), the BrdU labeled cells likely represent newly made Treg cells. The two-fold increase in BrdU uptake in Id1 transgenic thymuses also corresponded to the increases in total FoxP3+ cells or FoxP3+Helios+ cells shown in Figs. 1 and 2.
Figure 3. Increased production of Treg cells in the Id1 transgenic thymus.
Seven-week-old WT and TG littermate mice were labeled with BrdU-containing (1mg/ml) drinking water for one week. BrdU incorporation in CD4 single positive thymocytes were measured along with FoxP3 expression. The bar graphs show the average percentages of BrdU+ cells in FoxP3+ (left) and FoxP3− populations in four independent experiments. Data are presented as mean with SD. *p<0.05; ns, not significant.
Id1 potentiates Treg differentiation in a cell-intrinsic manner
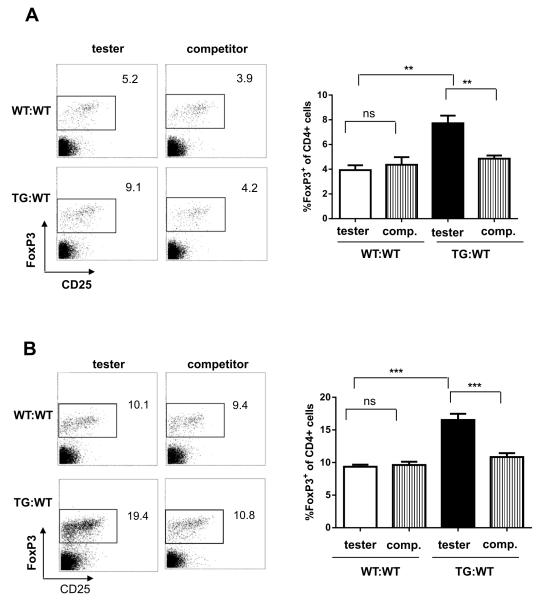
To determine if the effect of Id1 in augmenting Treg production is intrinsic to developing Treg cells themselves, we generated mixed-bone marrow chimera by co-transplanting CD45.2+ wild type or Id1 transgenic bone marrows (tester) with an equal number of competitor cells isolated from CD45.1+C57BL/6 mice. Twelve weeks later, Treg cells are scored by staining thymocytes and splenocytes with antibodies against CD4, CD25 and FoxP3 (Fig. 4A and 4B). As expected, wild type tester cells produced similar percentages of Treg cells as the competitors. In contrast, Id1 transgenic testers generated twice as many Treg cells compared to the competitors in both the thymus and spleen. Importantly, the competitors in the wild type and Id1 transgenic chimera behaved similarly, suggesting that they were not influenced by any potential extrinsic factors secreted by Id1 transgenic T cells. Rather, cell intrinsic Id1 expression was required to endow T cells with enhanced potential to differentiate into Treg cells.
Figure 4. T cell intrinsic-effect of Id1 expression on Treg production.
Bone marrow cells from CD45.1+ wild-type mice were used as competitors (comp.) and mixed at a 1:1 ratio with CD45.2+ bone marrow cells from wild-type or Id1tg mice (tester). Cells were injected into lethally irradiated CD45.1+ recipient mice. The thymus (A) and spleen (B) of the mixed bone marrow chimeras were analyzed by flow cytometry 12 weeks after transplantation. Representative FACS plots of FoxP3 and CD25 expression in CD4 single positive T cells are shown on the left. Data from cohorts of 7 mice are presented as mean with SD on the right. ***p<0.001; **p<0.01; ns, not significant.
Id1 expression increases Treg differentiation in co-culture with thymic dendritic cells
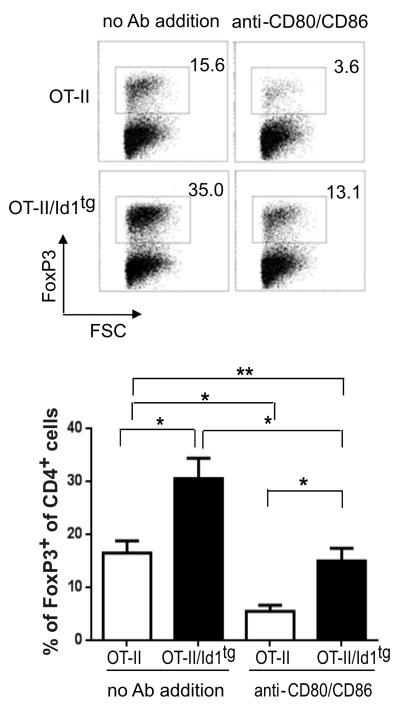
To mimic thymic Treg differentiation in vitro, we examined Treg differentiation from CD4+CD25− thymocytes from OTII or OTII/Id1tg mice on wild type thymic dendritic cells pulsed with OVA. As observed in vivo, OTII/Id1tg thymocytes exhibited a greater differentiation potential than OTII thymocytes (30.5% vs. 16.5%, Fig. 5). This result verifies that Id1 expression facilitates thymocyte differentiation into the Treg lineage and provides further support for the notion that the effect of Id1 is T cell-intrinsic.
Figure 5. In vitro Treg differentiation on thymic dendritic cells.
CD4+CD25−CD69+ thymocytes sorted from OT-II or OT-II/Id1tg mice were co-cultured with purified thymic DC in the presence of 40 μg/ml ovalbumin, 10 ng/mL recombinant IL-2 and 1ng/ml IL-7 for 4 days. Representative FACS plots of FoxP3 expression in CD4 single positive T cells are shown on the top. Data from five independent experiments are presented as mean with SD at the bottom. **p<0.01; *p<0.05; ns, not significant.
Moreover, we carried out the co-culture experiments in the absence or presence of antibodies against CD80 and CD86 to block TCR co-stimulatory signals from the dendritic cells. These antibodies markedly diminished Treg production from OTII thymocytes. Treg production from OTII/Id1tg thymocytes, on the other hand, is less severely affected, remaining at a level similar to cultures of OTII thymocytes without antibody treatment (Fig. 5). Apart from confirming a crucial role of TCR co-stimulation for Treg differentiation, these results provide the first clue that Id1 may exert its effect by regulating the co-stimulatory signal.
Id1 expression promotes the generation of thymic Treg precursors by partially substituting for CD28 signaling
It is shown that the differentiation of Treg cells in the thymus can be divided into TCR dependent and independent steps (7,9). First, newly formed CD4 single positive T cells up-regulate CD25 upon TCR signaling to become Treg precursors, which are characterized as CD4+CD8−CD25+FoxP3−. These precursors then differentiate into FoxP3+ cells, and this step is facilitated by signaling from the IL-2 receptor in vivo or in vitro. Vang et al. has used a more refined definition of Treg precursors and Treg cells by including two additional markers, CD122 and GITR and demonstrated that CD28-mediated signaling is important for the formation of Treg precursors (17). We have previously shown that Id1 expression could substitute for exogenous CD28 stimulation and allow CD4+ T cells to proliferate when treated with anti-CD3 antibody alone (31,32). Therefore, we used the scheme described by Vang et al. to determine if Id1 expression promotes the generation of Treg precursors and if it can rescue the defect in CD28−/− mice.
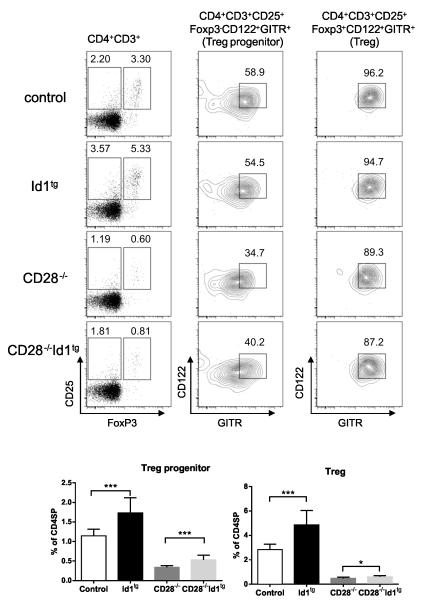
Cohorts of 7 week-old mice of the genotypes of Id1tg, CD28−/− and CD28−/−Id1tg were analyzed along with negative controls (Fig. 6). Thymocytes were stained with antibodies against CD4, CD8, CD3, CD25, CD122 and GITR followed by intracellular staining for FoxP3. CD4+CD3+ cells were then analyzed for CD25 and FoxP3 expression. The expression of CD122 and GITR was further examined in cells within the CD25+FoxP3− or CD25+FoxP3+ gate. CD122+GITR+ cells in each of these two populations were considered Treg precursors and Treg cells, respectively.
Figure 6. Id1 expression augments the frequency of Treg precursors in wild type and CD28−/− mice.
Thymocytes from mice of indicated genotypes were stained with antibodies against CD3, CD4, CD8, CD25, CD122 and GITR followed by intracellular staining for FoxP3. CD4+CD3+ cells were analyzed for expression of CD25 and FoxP3. CD25+FoxP3− or CD25+FoxP3+ cells (defining Treg precursor or Treg) were then separately examined for CD122 and GITR levels. Representative plots are shown on the top. Data shown at the bottom are the average percentages from control (WT or CD28+/− n=11), Id1tg (n=11), CD28−/− (n=6) and CD28−/−Id1tg (n=14) analyzed in 4 independent experiments. Error bar shows SD. Unpaired Student’s t test was performed to determine the significance between two indicated groups. ****p<0.0001; ***p<0.001; **p<0.01; *p<0.05. In addition, the one-way Anova analysis indicates a statistical significance among the four groups (p< 0.0001).
Compared to controls, the frequency of both Treg precursors and Treg cells were found to be higher in Id1tg mice (Fig. 6). CD28 deficiency led to dramatic reduction in both populations. Expression of Id1 in CD28−/− mice resulted in a 60% increase in the percentage of Treg precursors compared to CD28−/− mice, whereas the generation of phenotypically mature Treg cells was only increased by 20%. These results suggest that Id1 expression created effects that can partially substitute for the loss of CD28 in promoting the formation of Treg precursors. However, differentiation into Treg cells likely demands stronger CD28 signaling or additional downstream events, which Id1 expression is not able to provide.
Id1 promotes in vitro Treg induction in the absence of CD28-mediated co-stimulation
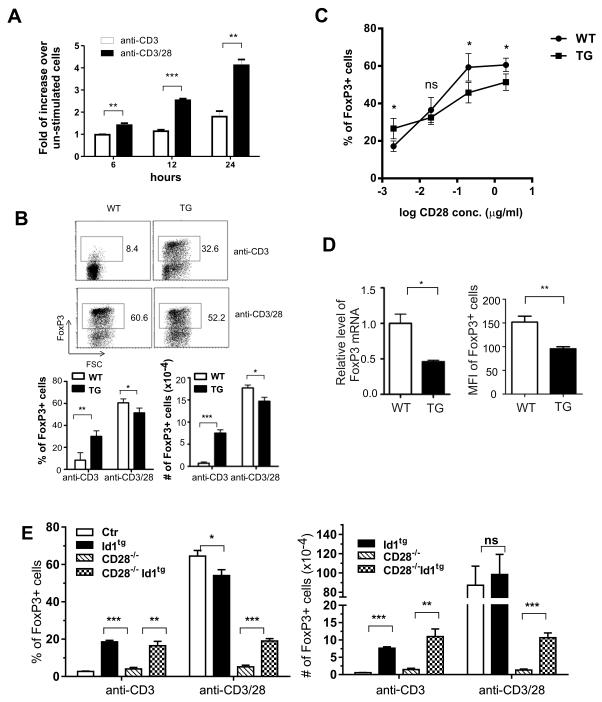
To further examine the effect of Id1 expression in TCR-mediated Treg differentiation, we utilized an in vitro differentiation system to induce iTreg formation from naive CD4+ T cells in the periphery. In this system, naive T cells are cultured in the presence of anti-CD3 and anti-CD28 plus TGFβ. We first tested the induction of Id3 by culturing CD4+CD62LhiCD44loCD25− naïve T cells from the lymph nodes of wild type mice for different lengths of time and found Id3 expression was dramatically stimulated not by anti-CD3 alone but by anti-CD3 plus anti-CD28 (Fig. 7A). This result suggests that Id3 up-regulation by TCR co-stimulation occurs during Treg differentiation.
Figure 7. Id1 expression promotes in vitro Treg induction of naïve CD4+ T cells.
(A) Wild type CD4+CD62LhiCD44loCD25− naïve T cells were stimulated with anti-CD3 (1μg/ml), with or without anti-CD28 (2 μg/ml), for indicated hours. Id3 levels were normalized against those of GAPDH. The graph shows the increase in normalized Id3 expression after stimulation for indicated length of time over that in un-stimulated cells. ***p<0.001; **p<0.01. (B) Naïve T cells (200,000 cells) from the lymph nodes of wild type and Id1 transgenic mice were cultured on plated-bound anti-CD3 (1 μg/ml) in the medium containing 1 ng/ml TGFβ plus or minus 2 μg/ml of anti-CD28. Three days later, FoxP3 expression was measured and plotted against forward scatter. Average percentages (left) and number (right) of FoxP3+ cells were calculated from data of 4 independent experiments. Results are presented below the FACS plots as mean with SD. (C) Different concentrations of anti-CD28 ranging from 0.002 μg/ml to 2 μg/ml were added in cultures described for (B). The average percentages of FoxP3+ cells at each concentration from 4 independent experiments were plotted against CD28 concentration in log scale. Results are presented as mean with SD. Unpaired Student’s t tests were performed to determine the p values at different concentrations. *p<0.05; ns, not significant. In addition, the statistical significance of the difference between WT and TG with different concentration of anti-CD28 was also determined using two-way Anova. The p value (<0.001) indicates significant interaction between the genotype and anti-CD28 concentration. (D) Id1 inhibits FoxP3 expression. Left: WT and TG naïve CD4 cells were cultured with 1 μg/ml anti-CD3 and 1 μg/ml CD28 plus 0.25 ng/ml TGFβ for 12 hours and total RNA was isolated from the cells. Levels of FoxP3 and GAPDH mRNA were measured using quantitative RT-PCR. FoxP3 levels were normalized against those of GAPDH. The graph shows the normalized FoxP3 level relative to that in WT cells, which is a representative of three independent experiments. Right: Treg differentiation cultures were set up with 1 μg/ml anti-CD3, 2 μg/ml anti-CD28 and 0.25 ng/ml TGFβ. Levels of FoxP3 expression were measured by determining the mean fluorescence intensity (MFI) of Foxp3+ cells. Results are presented as mean with SD of data from 3 independent experiments.**p<0.01; *p<0.05. (E) Naïve T cells from the lymph nodes of mice of the indicated genotypes were cultured and analyzed as described for (B). Average percentages and numbers of FoxP3+ cells produced (n=4) are shown as mean with SD and are representative for 5 independent experiments.
We then cultured naïve T cells on plate-bound anti-CD3 antibodies in media containing TGFβ plus or minus anti-CD28. FoxP3 expression was scored as an indication of Treg differentiation. When stimulated with anti-CD3 alone, wild type cells differentiated poorly but Id1-expressing cells generated a significantly higher percentage and number of FoxP3+ cells (Fig. 7B). In contrast, when both anti-CD3 and anti-CD28 were provided, wild type and transgenic naïve T cells both exhibited robust differentiation (Fig. 7B). These results suggest that Id1 expression could substitute at least in part the signaling events triggered by anti-CD28 stimulation in promoting Treg differentiation.
To further illustrate the effect of Id1 expression on Treg induction under the influence of TCR co-stimulation, we titrated the amount of anti-CD28 added to the culture, ranging from 0.002 μg/ml to 2μg/ml (Fig. 7C). Like the result from the culture without anti-CD28, in the presence of 0.002 μg/ml of the antibody, Id1 transgenic cells differentiated more efficiently than wild type controls. Interestingly, when the concentration of anti-CD28 reached 0.2 or 2 μg/ml, the transgenic cells displayed a slightly impaired capacity for Treg induction. Therefore, Id1 expression imposed a differential influence on Treg induction dependent on the strength of co-stimulatory signals. The inhibitory effect at the high end is probably because of the direct counteraction of Id1 on E protein-mediated transcription of FoxP3 gene expression (39). Indeed, we found lower levels of FoxP3 mRNA and mean fluorescence intensity of FoxP3 staining in Id1 expressing cells in the Treg-inducing condition with optimal concentrations of anti-CD3 and anti-CD28 (Fig. 7D).
To confirm the connection between CD28 signaling and Id1 expression, we cultured naïve T cells from wild type, Id1tg, CD28−/− and CD28−/−Id1tg mice under Treg-inducing conditions as described above. As expected, naïve T cells from CD28−/− mice gave rise to very few FoxP3+ cells either in the presence or absence of co-stimulation. On the other hand, CD28−/−Id1tg cells were as efficient as Id1tg cells to develop into Treg cells in cultures with anti-CD3 alone. Moreover, expression of Id1 transgene partially restored the impaired Treg induction from CD28−/− cells under stimulation with both anti-CD3 and anti-CD28 (Fig. 7E). Therefore, these results suggest that Id1 expression exerts effects similar to those delivered by CD28-mediated signaling to promote Treg differentiation.
Enhanced IL-2 production by Id1-expressing cells contributes to Treg induction in the absence of co-stimulation
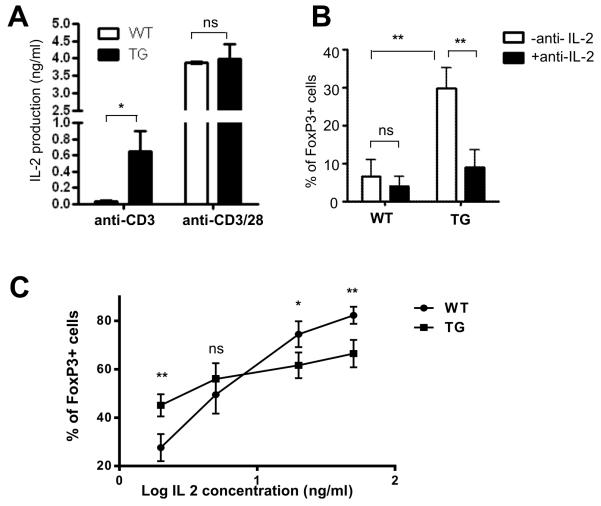
It is well established that Treg differentiation depends on signaling from IL-2 receptors. As one of the downstream events elicited by CD28 signaling is the production of IL-2, we determine the effect of Id1 on IL-2 production when naïve T cells were stimulated with TGFβ along with anti-CD3 alone or with anti-CD3 plus anti-CD28. We collected the culture supernatants 48 hours after the cells were plated and detected the level of IL-2 secreted by wild type and Id1 transgenic cells. Although the levels of IL-2 produced by wild type and transgenic cells were similar in the presence of anti-CD3 and anti-CD28, Id1-expressing cells generated a much higher level of IL-2 compared to wild type controls when stimulated with anti-CD3 alone (Fig. 8A).
Figure 8. Elevated IL-2 contributes to the augmented Treg induction of Id1-expressing cells in the absence of anti-CD28 co-stimulation.
(A) ELISA was used to measure IL-2 levels in the supernatants collected 48 hours after culturing indicated naïve T cells with anti-CD3 and TGFβ with or without anti-CD28. The experiment was set up in triplicates and repeated 3 times. Results are presented as mean with SD. (B) Percentage of FoxP3+ cells in cultures of WT and TG naïve T cells in the presence of anti-CD3 and TGFβ supplemented with or without anti-IL-2. Results from 4 independent experiments are presented as mean with SD. (C) IL-2 at different concentrations ranging from 2 ng/ml to 50 ng/ml was added to the cultures of WT and TG naïve T cells in the presence of anti-CD3 and TGFβ. Average percentage of FoxP3+ cells for each concentration from 4 independent experiments are shown as mean with SD. Unpaired Student’s t tests were performed to determine the p values at different concentrations. **p<0.01; *p<0.05; ns, not significant. In addition, the statistical significance of the difference between WT and TG with different concentration of IL-2 was also determined using two-way Anova. The p value (<0.001) indicates significant interaction between the genotype and IL-2 concentration.
To test if this elevated IL-2 production by Id1-expressing cells contributed to their increased differentiation capacity, we cultured naïve T cells on plate-bound anti-CD3 in medium containing TGFβ plus or minus a neutralizing antibody against IL-2. Wild type cells differentiated poorly under this condition and addition of the IL-2 antibody had little effects (Fig. 8B). However, the augmented differentiation from Id1-expressing cells was dramatically diminished by the anti-IL-2 antibody (Fig. 8B), which suggests that Id1-mediated elevation of IL-2 secretion facilitates Treg differentiation in the absence of anti-CD28 co-stimulation.
Furthermore, we examined the response of wild type and transgenic T cells to exogenous IL-2 of various concentrations in cultures stimulated with anti-CD3 and TGFβ (Fig. 8C). At a low concentration of IL-2 (2 ng/ml), Id1-expressing cells exhibited superior differentiation potential over wild type cells, similarly to that seen without IL-2 supplementation (Fig. 8B). Such a difference disappeared when IL-2 concentration was raised to 5 ng/ml. In fact, the effect was even reversed with further increase of IL-2 concentration. This was analogous to what were observed with different concentrations of anti-CD28 (Fig. 7C). Collectively, we have obtained several lines of evidence to suggest that elevation of IL-2 production resulting from Id1 expression contributes to the increased capacity for Treg differentiation of Id1 transgenic mice.
Reduced susceptibility of Id1 transgenic mice to EAE induction
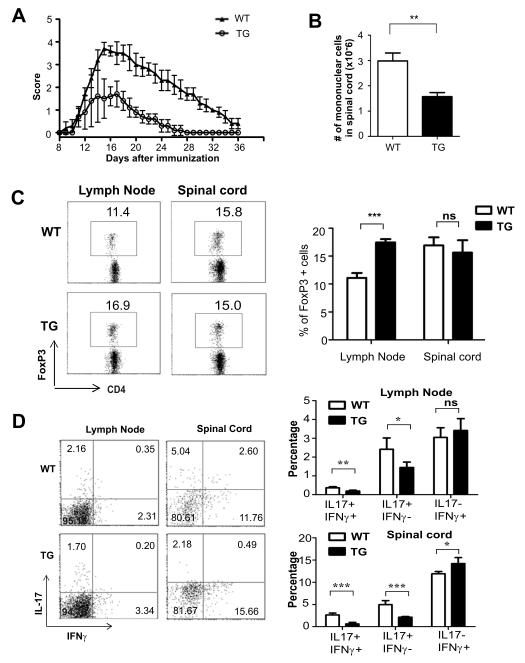
To evaluate the biological significance of augmented Treg production in Id1 transgenic mice, we utilized the EAE model. Wild type and Id1 transgenic littermates were immunized subcutaneously with the MOG peptide followed by administration of Pertussis toxin. Disease progression was monitored daily for 36 days. As shown in Fig. 9A, Id1 transgenic mice exhibited a considerably attenuated response to the immunization compared to wild type littermates. Fourteen days after immunization, we examined lymphocyte infiltration in the spinal cord and found a significantly lower cell counts in Id1 transgenic mice (Fig. 9B). In the draining lymph nodes of the transgenic mice, we detected a significant increase in FoxP3+ cells (Fig. 9C). However, the frequency of FoxP+ cells in spinal cord was not significantly different in wild type and transgenic mice (Fig. 9C). Furthermore, we analyzed CD4+ effector T cells in the lymph nodes and spinal cord by staining for IL-17 and interferon γ production at this time point. Interestingly, the frequency of IL-17+ cells was dramatically reduced in Id1 transgenic mice, suggesting that Th17 cell differentiation was suppressed (Fig. 9D). Of particular note, the frequency of IL-17+IFNγ+ cells, which are considered encephalitogenic (46,47), was markedly reduced in both the lymph nodes and spinal cord. In contrast, the percentages of IFNγ+IL-17− cells, which are likely Th1 cells, were similar or slightly higher in the lymph nodes and spinal cord of the transgenic mice, respectively (Fig. 9D). Overall, these results suggest that Id1 expression leads to increased levels of Treg cells in the animals, which may be responsible for an elevated immune suppressive function and reduced susceptibility to EAE, possibly through inhibition of Th17 production in vivo.
Figure 9. Attenuated EAE development in Id1 transgenic mice is associated with increased Treg counts and reduced encephalitogenic effector T cells.
(A) EAE was induced in 7-week-old WT and TG female littermates using MOG peptide and pertussis toxin. Disease progression was scored daily for 36 days using the criteria described in Materials and Methods. Results are presented as mean with SD. (B) The numbers of mononuclear cells harvested from the spinal cord after proteolytic digestion of the tissue are shown as mean with SD. (C) Expression of FoxP3 in draining lymph nodes and spinal cord was measured on day 14 after immunization and representative dot plots and average percentages of the indicated subsets are shown. (D) Examination of CD4+ effector T cells in draining lymph nodes and spinal cord. Cells were stimulated with PMA (50 ng/ml) and ionomycin (1 μg/ml) for 4 hours. IL-17A and IFNγ expression was detected using intracellular staining. Average percentages of the indicated subsets are shown.
Discussion
In this study, we demonstrate that Id1 expression in CD4+ cells promotes Treg differentiation in vivo and in vitro by augmenting events that are in common with those triggered by CD28-mediated signaling. As CD28-mediated co-stimulation plays an important role in up-regulating Id3 gene expression (Fig. 7A), our data have significant implications in the biogenesis of Treg cells. Although Id1 itself is not stimulated by TCR signaling, it shares extensive structural and functional similarities with Id3 (48). Hence, the Id1 gain-of-function studies described here can shed light on the role of basic helix-loop-helix proteins in Treg differentiation. This is analogous to the investigation into the role of these proteins in TCR β selection, where both ablation of the E2A gene and overexpression of Id1 lower the threshold of TCR signaling and enable RAG1 deficient thymocytes to progress to the CD4 and CD8 double positive stage (30,49). With regard to the role of these bHLH proteins in Treg differentiation, Id1 transgenic and Id3 deficient mice appeared to display the opposite phenotypes (39). Namely, the former have increased Treg counts whereas the latter show a deficit of Treg cells at ages before the onset of autoimmune diseases. In vitro, Id1 transgenic naïve T cells can differentiate without anti-CD28 co-stimulation but Id3 deficient cells fail to produce FoxP3+ cells even when stimulated with both anti-CD3 and anti-CD28.
Different underlying mechanisms have been invoked to ascribe the roles of bHLH proteins in Treg development. For example, E2A proteins are found to bind to the promoter of the FoxP3 gene (39), and Id1 expression inhibits FoxP3 expression in vitro when naïve T cells were cultured in the presence of anti-CD3 and anti-CD28 as well as TGFβ (Fig. 7D). Here, we present data to highlight the impact of bHLH proteins on TCR-mediated effects on Treg differentiation. According to the “two-step” model, the generation of Treg precursors depends on TCR/CD28 signaling (7). Id1 transgenic mice possess a larger number of CD122+GITR+CD25+FoxP3− Treg precursors and expression of Id1 transgene in CD28−/− mice partially rescues the deficit of this population of cells due to CD28 deficiency (16,17). In vitro, Id1 expression also promoted Treg differentiation without events triggered by CD28. The ability of Id1 to substitute for or mimic CD28 signaling could be highly significant in the animals. Numerous studies have demonstrated that the strength of TCR signaling is critical for developing T cells to commit to the Treg lineage as opposed to undergoing negative or positive selection (8). Id1 expression may contribute to the elevation of net TCR signaling strength by augmenting unknown downstream effects, which could then lead to increases in Treg production and/or homeostasis. Similarly, Id3 up-regulation by TCR/CD28 signaling may be instrumental for Treg differentiation as ablation of the Id3 gene impedes Treg development (39). Our data would support the notion that Id3 is a key effector downstream of TCR/CD28 signaling in Treg cell production.
It should be noted that expression of the Id1 transgene could not fully rescue the defect in Treg production in CD28−/− mice. There could be several explanations. First of all, Id1 expression may not impact all aspects of CD28 signaling required for Treg differentiation. Alternatively, quantitative limitations of the effects of Id1 on CD28 signaling may exist. With physiological strengths of TCR signaling, Id1 expression could partially facilitate the formation of Treg precursors but the production of FoxP3+ cells might demand stronger co-stimulation. In the case of artificial stimulation of the TCR with anti-CD3 in vitro, Id1 enabled the generation of Treg cells from naive T cells without anti-CD28, although the production was less robust than that when the cells were stimulated with anti-CD3 and anti-CD28. Considering the broad impacts of CD28 signaling on various cellular processes (50), an incomplete rescue of Treg differentiation by Id1 expression in CD28−/− mice is not surprising.
The molecular mechanism whereby Id1 promotes Treg differentiation is not well understood. In addition to an increased frequency of Treg precursors present in Id1 transgenic mice, we have shown that Id1 expression resulted in elevated production of IL-2 under in vitro Treg differentiation conditions without anti-CD28. Signaling from IL-2 receptors is known to be essential for Treg differentiation (10,11,51). One of the major downstream events of CD28 signaling is to stimulate IL-2 production, which facilitates the survival of Treg cells (52). However, using mixed-bone marrow chimeras, we have shown that the effect of Id1 on Treg differentiation is intrinsic to the developing Treg cells rather than a by-stander effect of IL-2 production by other T cells. It is thus likely that increased IL-2 production by the differentiating Treg cells promotes their own differentiation in an autocrine fashion. Another downstream effect of CD28 signaling is the activation of NF-κB, which is also crucial for Treg differentiation (23,53). We have previously shown that naïve T cells from Id1 transgenic mice exhibit elevated NF-κB activity upon anti-CD3 stimulation (42). Similar effects of Id1 have also been observed in thymocytes and a T cell line (30,31,54). However, how NF-κB is activated by Id1 and how the effects of Id1 converge with those of with the CD28 signaling pathways are questions whose answers remain elusive.
By using the EAE model, we obtained evidence to suggest that increased levels of Treg cells offered Id1 transgenic mice protection from autoimmune disease. We have detected elevated Treg counts in the draining lymph nodes in Id1 transgenic mice, which likely contributes to the inhibition of the differentiation and migration of autoreactive effector T cells to the central nervous system as demonstrated by Shevach and colleagues (55). This illustrates the importance of maintaining healthy homeostasis of Treg populations under normal conditions as reduced levels of Treg cells could let to increased susceptibility to autoimmunity. On the other hand, during microbial infection, strong TCR reactions against foreign antigens may take place, in which case up-regulation of Id genes such as Id3 could dampen Treg differentiation by inhibiting FoxP3 expression and thus enabling the function of effector T cells. This would be reminiscent of the situation we observed that Id1-expressing naïve T cells exhibited reduction in FoxP3 expression when induced to differentiate by anti-CD3 and anti-CD28. Overall, our studies on the role of Id proteins in Treg development and induction have shed light on the importance of bHLH proteins in regulating cellular immunity in normal and pathologic situations.
Acknowledgements
We thank Dr. Linda Thompson for critical reading of the manuscript and Ying Zhao for technical assistance.
This work was supported by grants from National Basic Research Program of China (2011CB946100), National Natural Sciences Foundation of China (31330025) and the 111 Project of China (B07001), and from the National Institute of Health (AI56129). XHS holds the Lew and Myra Chair in Biomedical Research.
Reference List
- 1.Fontenot JD, Gavin MA, Rudensky AY. Foxp3 programs the development and function of CD4+CD25+ regulatory T cells. Nat. Immunol. 2003;4:330–336. doi: 10.1038/ni904. [DOI] [PubMed] [Google Scholar]
- 2.Sakaguchi S, Sakaguchi N. Regulatory T cells in immunologic self-tolerance and autoimmune disease. Int. Rev. Immunol. 2005;24:211–226. doi: 10.1080/08830180590934976. [DOI] [PubMed] [Google Scholar]
- 3.Belkaid Y. Role of Foxp3-positive regulatory T cells during infection. Eur. J. Immunol. 2008;38:918–921. doi: 10.1002/eji.200738120. [DOI] [PMC free article] [PubMed] [Google Scholar]
- 4.Mills KH. Regulatory T cells: friend or foe in immunity to infection? Nat. Rev. Immunol. 2004;4:841–855. doi: 10.1038/nri1485. [DOI] [PubMed] [Google Scholar]
- 5.Fontenot JD, Rudensky AY. A well adapted regulatory contrivance: regulatory T cell development and the forkhead family transcription factor Foxp3. Nat. Immunol. 2005;6:331–337. doi: 10.1038/ni1179. [DOI] [PubMed] [Google Scholar]
- 6.Josefowicz SZ, Lu LF, Rudensky AY. Regulatory T cells: mechanisms of differentiation and function. Annu. Rev. Immunol. 2012;30:531–564. doi: 10.1146/annurev.immunol.25.022106.141623. [DOI] [PMC free article] [PubMed] [Google Scholar]
- 7.Lio CW, Hsieh CS. A two-step process for thymic regulatory T cell development. Immunity. 2008;28:100–111. doi: 10.1016/j.immuni.2007.11.021. [DOI] [PMC free article] [PubMed] [Google Scholar]
- 8.Hsieh CS, Lee HM, Lio CW. Selection of regulatory T cells in the thymus. Nat. Rev. Immunol. 2012;12:157–167. doi: 10.1038/nri3155. [DOI] [PubMed] [Google Scholar]
- 9.Burchill MA, Yang J, Vang KB, Moon JJ, Chu HH, Lio CW, Vegoe AL, Hsieh CS, Jenkins MK, Farrar MA. Linked T cell receptor and cytokine signaling govern the development of the regulatory T cell repertoire. Immunity. 2008;28:112–121. doi: 10.1016/j.immuni.2007.11.022. [DOI] [PMC free article] [PubMed] [Google Scholar]
- 10.Burchill MA, Yang J, Vogtenhuber C, Blazar BR, Farrar MA. IL-2 receptor beta-dependent STAT5 activation is required for the development of Foxp3+ regulatory T cells. J. Immunol. 2007;178:280–290. doi: 10.4049/jimmunol.178.1.280. [DOI] [PubMed] [Google Scholar]
- 11.Barron L, Dooms H, Hoyer KK, Kuswanto W, Hofmann J, O’Gorman WE, Abbas AK. Cutting edge: mechanisms of IL-2-dependent maintenance of functional regulatory T cells. J. Immunol. 2010;185:6426–6430. doi: 10.4049/jimmunol.0903940. [DOI] [PMC free article] [PubMed] [Google Scholar]
- 12.Fontenot JD, Rasmussen JP, Gavin MA, Rudensky AY. A function for interleukin 2 in Foxp3-expressing regulatory T cells. Nat. Immunol. 2005;6:1142–1151. doi: 10.1038/ni1263. [DOI] [PubMed] [Google Scholar]
- 13.Furtado GC, Curotto de Lafaille MA, Kutchukhidze N, Lafaille JJ. Interleukin 2 signaling is required for CD4(+) regulatory T cell function. J. Exp. Med. 2002;196:851–857. doi: 10.1084/jem.20020190. [DOI] [PMC free article] [PubMed] [Google Scholar]
- 14.Tang Q, Henriksen KJ, Boden EK, Tooley AJ, Ye J, Subudhi SK, Zheng XX, Strom TB, Bluestone JA. Cutting edge: CD28 controls peripheral homeostasis of CD4+CD25+ regulatory T cells. J. Immunol. 2003;171:3348–3352. doi: 10.4049/jimmunol.171.7.3348. [DOI] [PubMed] [Google Scholar]
- 15.Guo F, Iclozan C, Suh WK, Anasetti C, Yu XZ. CD28 controls differentiation of regulatory T cells from naive CD4 T cells. J. Immunol. 2008;181:2285–2291. doi: 10.4049/jimmunol.181.4.2285. [DOI] [PMC free article] [PubMed] [Google Scholar]
- 16.Lio CW, Dodson LF, Deppong CM, Hsieh CS, Green JM. CD28 facilitates the generation of Foxp3(−) cytokine responsive regulatory T cell precursors. J. Immunol. 2010;184:6007–6013. doi: 10.4049/jimmunol.1000019. [DOI] [PMC free article] [PubMed] [Google Scholar]
- 17.Vang KB, Yang J, Pagan AJ, Li LX, Wang J, Green JM, Beg AA, Farrar MA. Cutting edge: CD28 and c-Rel-dependent pathways initiate regulatory T cell development. J. Immunol. 2010;184:4074–4077. doi: 10.4049/jimmunol.0903933. [DOI] [PMC free article] [PubMed] [Google Scholar]
- 18.Tai X, Cowan M, Feigenbaum L, Singer A. CD28 costimulation of developing thymocytes induces Foxp3 expression and regulatory T cell differentiation independently of interleukin 2. Nat. Immunol. 2005;6:152–162. doi: 10.1038/ni1160. [DOI] [PubMed] [Google Scholar]
- 19.Rubtsov YP, Rudensky AY. TGFbeta signalling in control of T-cell-mediated self-reactivity. Nat. Rev. Immunol. 2007;7:443–453. doi: 10.1038/nri2095. [DOI] [PubMed] [Google Scholar]
- 20.Kretschmer K, Apostolou I, Hawiger D, Khazaie K, Nussenzweig MC, von Boehmer H. Inducing and expanding regulatory T cell populations by foreign antigen. Nat. Immunol. 2005;6:1219–1227. doi: 10.1038/ni1265. [DOI] [PubMed] [Google Scholar]
- 21.Chen W, Jin W, Hardegen N, Lei KJ, Li L, Marinos N, McGrady G, Wahl SM. Conversion of peripheral CD4+ J. Exp. Med. 2003;198:1875–1886. doi: 10.1084/jem.20030152. [DOI] [PMC free article] [PubMed] [Google Scholar]
- 22.Yamagiwa S, Gray JD, Hashimoto S, Horwitz DA. A role for TGF-beta in the generation and expansion of CD4+CD25+ regulatory T cells from human peripheral blood. J. Immunol. 2001;166:7282–7289. doi: 10.4049/jimmunol.166.12.7282. [DOI] [PubMed] [Google Scholar]
- 23.Ruan Q, Kameswaran V, Tone Y, Li L, Liou HC, Greene MI, Tone M, Chen YH. Development of Foxp3(+) regulatory t cells is driven by the c-Rel enhanceosome. Immunity. 2009;31:932–940. doi: 10.1016/j.immuni.2009.10.006. [DOI] [PMC free article] [PubMed] [Google Scholar]
- 24.Ouyang W, Li MO. Foxo: in command of T lymphocyte homeostasis and tolerance. Trends Immunol. 2011;32:26–33. doi: 10.1016/j.it.2010.10.005. [DOI] [PMC free article] [PubMed] [Google Scholar]
- 25.Sun XH. Multitasking of helix-loop-helix proteins in lymphopoiesis. Adv. Immunol. 2004;84:43–77. doi: 10.1016/S0065-2776(04)84002-1. [DOI] [PubMed] [Google Scholar]
- 26.Murre C. Helix-loop-helix proteins and lymphocyte development. Nat. Immunol. 2005;6:1079–1086. doi: 10.1038/ni1260. [DOI] [PubMed] [Google Scholar]
- 27.Kee BL. E and ID proteins branch out. Nat. Rev. Immunol. 2009;9:175–184. doi: 10.1038/nri2507. [DOI] [PubMed] [Google Scholar]
- 28.Bain G, Cravatt CB, Loomans C, Alberola-Ila J, Hedrick SM, Murre C. Regulation of the helix-loop-helix proteins, E2A and Id3, by the Ras- ERK MAPK cascade. Nat. Immunol. 2001;2:165–171. doi: 10.1038/84273. [DOI] [PubMed] [Google Scholar]
- 29.Engel I, Murre C. Disruption of pre-TCR expression accelerates lymphomagenesis in E2A- deficient mice. Proc. Natl. Acad. Sci. U. S. A. 2002;99:11322–11327. doi: 10.1073/pnas.162373999. [DOI] [PMC free article] [PubMed] [Google Scholar]
- 30.Kim D, Xu M, Nie L, Peng XC, Jimi E, Voll RE, Nguyen T, Ghosh S, Sun XH. Helix-loop-helix proteins regulate pre-TCR and TCR signaling through modulation of Rel/NF-kappaB activities. Immunity. 2002;16:9–21. doi: 10.1016/s1074-7613(02)00264-9. [DOI] [PubMed] [Google Scholar]
- 31.Qi Z, Sun XH. Hyperresponse to T-cell receptor signaling and apoptosis of Id1 transgenic thymocytes. Mol. Cell Biol. 2004;24:7313–7323. doi: 10.1128/MCB.24.17.7313-7323.2004. [DOI] [PMC free article] [PubMed] [Google Scholar]
- 32.Liu C, Jin R, Wang HC, Tang H, Liu YF, Qian XP, Sun XY, Ge Q, Sun XH, Zhang Y. Id1 expression promotes peripheral CD4+ T cell proliferation and survival upon TCR activation without co-stimulation. Biochem. Biophys. Res. Commun. 2013;436:47–52. doi: 10.1016/j.bbrc.2013.05.054. [DOI] [PMC free article] [PubMed] [Google Scholar]
- 33.Kim D, Peng XC, Sun XH. Massive apoptosis of thymocytes in T-cell-deficient Id1 transgenic mice. Mol. Cell. Biol. 1999;19:8240–8253. doi: 10.1128/mcb.19.12.8240. [DOI] [PMC free article] [PubMed] [Google Scholar]
- 34.Rivera RR, Johns CP, Quan J, Johnson RS, Murre C. Thymocyte selection is regulated by the helix-loop-helix inhibitor protein, Id3. Immunity. 2000;12:17–26. doi: 10.1016/s1074-7613(00)80155-7. [DOI] [PubMed] [Google Scholar]
- 35.Barndt R, Dai MF, Zhuang Y. A novel role for HEB downstream or parallel to the pre-TCR signaling pathway during alpha beta thymopoiesis. J. Immunol. 1999;163:3331–3343. [PubMed] [Google Scholar]
- 36.Jones ME, Zhuang Y. Acquisition of a functional T cell receptor during T lymphocyte development is enforced by HEB and E2A transcription factors. Immunity. 2007;27:860–870. doi: 10.1016/j.immuni.2007.10.014. [DOI] [PMC free article] [PubMed] [Google Scholar]
- 37.Wojciechowski J, Lai A, Kondo M, Zhuang Y. E2A and HEB are required to block thymocyte proliferation prior to pre-TCR expression. J. Immunol. 2007;178:5717–5726. doi: 10.4049/jimmunol.178.9.5717. [DOI] [PMC free article] [PubMed] [Google Scholar]
- 38.Jones-Mason ME, Zhao X, Kappes D, Lasorella A, Iavarone A, Zhuang Y. E protein transcription factors are required for the development of CD4(+) lineage T cells. Immunity. 2012;36:348–361. doi: 10.1016/j.immuni.2012.02.010. [DOI] [PMC free article] [PubMed] [Google Scholar]
- 39.Maruyama T, Li J, Vaque JP, Konkel JE, Wang W, Zhang B, Zhang P, Zamarron BF, Yu D, Wu Y, Zhuang Y, Gutkind JS, Chen W. Control of the differentiation of regulatory T cells and T(H)17 cells by the DNA-binding inhibitor Id3. Nat. Immunol. 2011;12:86–95. doi: 10.1038/ni.1965. [DOI] [PMC free article] [PubMed] [Google Scholar]
- 40.Li H, Dai M, Zhuang Y. A T cell intrinsic role of Id3 in a mouse model for primary Sjogren’s syndrome. Immunity. 2004;21:551–560. doi: 10.1016/j.immuni.2004.08.013. [DOI] [PubMed] [Google Scholar]
- 41.Ueda-Hayakawa I, Mahlios J, Zhuang Y. Id3 restricts the developmental potential of gamma delta lineage during thymopoiesis. J. Immunol. 2009;182:5306–5316. doi: 10.4049/jimmunol.0804249. [DOI] [PMC free article] [PubMed] [Google Scholar]
- 42.Liu C, Jin R, Wang HC, Tang H, Liu YF, Qian XP, Sun XY, Ge Q, Sun XH, Zhang Y. Id1 expression promotes peripheral CD4(+) T cell proliferation and survival upon TCR activation without co-stimulation. Biochem. Biophys. Res. Commun. 2013;436:47–52. doi: 10.1016/j.bbrc.2013.05.054. [DOI] [PMC free article] [PubMed] [Google Scholar]
- 43.Lyden D, Young AZ, Zagzag D, Yan W, Gerald W, O’Reilly R, Bader BL, Hynes RO, Zhuang Y, Manova K, Benezra R. Id1 and Id3 are required for neurogenesis, angiogenesis and vascularization of tumour xenografts. Nature. 1999;401:670–677. doi: 10.1038/44334. [DOI] [PubMed] [Google Scholar]
- 44.Thornton AM, Korty PE, Tran DQ, Wohlfert EA, Murray PE, Belkaid Y, Shevach EM. Expression of Helios, an Ikaros transcription factor family member, differentiates thymic-derived from peripherally induced Foxp3+ T regulatory cells. J. Immunol. 2010;184:3433–3441. doi: 10.4049/jimmunol.0904028. [DOI] [PMC free article] [PubMed] [Google Scholar]
- 45.Fohse L, Reinhardt A, Oberdorfer L, Schmitz S, Forster R, Malissen B, Prinz I. Differential Postselection Proliferation Dynamics of alphabeta T Cells, Foxp3+ Regulatory T Cells, and Invariant NKT Cells Monitored by Genetic Pulse Labeling. J. Immunol. 2013;191:2384–2392. doi: 10.4049/jimmunol.1301359. [DOI] [PubMed] [Google Scholar]
- 46.Suryani S, Sutton I. An interferon-gamma-producing Th1 subset is the major source of IL-17 in experimental autoimmune encephalitis. J. Neuroimmunol. 2007;183:96–103. doi: 10.1016/j.jneuroim.2006.11.023. [DOI] [PubMed] [Google Scholar]
- 47.Kebir H, Ifergan I, Alvarez JI, Bernard M, Poirier J, Arbour N, Duquette P, Prat A. Preferential recruitment of interferon-gamma-expressing TH17 cells in multiple sclerosis. Ann. Neurol. 2009;66:390–402. doi: 10.1002/ana.21748. [DOI] [PubMed] [Google Scholar]
- 48.Lyden D, Young AZ, Zagzag D, Yan W, Gerald W, O’Reilly R, Bader BL, Hynes RO, Zhuang Y, Manova K, Benezra R. Id1 and Id3 are required for neurogenesis, angiogenesis and vascularization of tumour xenografts. Nature. 1999;401:670–677. doi: 10.1038/44334. [DOI] [PubMed] [Google Scholar]
- 49.Engel I, Johns C, Bain G, Rivera RR, Murre C. Early thymocyte development is regulated by modulation of E2A protein activity. J. Exp. Med. 2001;194:733–745. doi: 10.1084/jem.194.6.733. [DOI] [PMC free article] [PubMed] [Google Scholar]
- 50.Acuto O, Michel F. CD28-mediated co-stimulation: a quantitative support for TCR signalling. Nat. Rev. Immunol. 2003;3:939–951. doi: 10.1038/nri1248. [DOI] [PubMed] [Google Scholar]
- 51.Davidson TS, DiPaolo RJ, Andersson J, Shevach EM. Cutting Edge: IL-2 is essential for TGF-beta-mediated induction of Foxp3+ T regulatory cells. J. Immunol. 2007;178:4022–4026. doi: 10.4049/jimmunol.178.7.4022. [DOI] [PubMed] [Google Scholar]
- 52.Powell JD, Ragheb JA, Kitagawa-Sakakida S, Schwartz RH. Molecular regulation of interleukin-2 expression by CD28 co-stimulation and anergy. Immunol. Rev. 1998;165:287–300. doi: 10.1111/j.1600-065x.1998.tb01246.x. [DOI] [PubMed] [Google Scholar]
- 53.Long M, Park SG, Strickland I, Hayden MS, Ghosh S. Nuclear factor-kappaB modulates regulatory T cell development by directly regulating expression of Foxp3 transcription factor. Immunity. 2009;31:921–931. doi: 10.1016/j.immuni.2009.09.022. [DOI] [PubMed] [Google Scholar]
- 54.Yang Y, Liou HC, Sun XH. Id1 potentiates NF-kappaB activation upon T cell receptor signaling. J. Biol. Chem. 2006;281:34989–34996. doi: 10.1074/jbc.M608078200. [DOI] [PubMed] [Google Scholar]
- 55.DiPaolo RJ, Glass DD, Bijwaard KE, Shevach EM. CD4+CD25+ T cells prevent the development of organ-specific autoimmune disease by inhibiting the differentiation of autoreactive effector T cells. J. Immunol. 2005;175:7135–7142. doi: 10.4049/jimmunol.175.11.7135. [DOI] [PubMed] [Google Scholar]


