Abstract
Depth-dependent fluorescence quenching by lipid-attached quenchers (e.g., bromine atoms or doxyl groups) is an important tool for determining the penetration of proteins and peptides into lipid bilayers. Extracting quantitative information and accurate calculations of the depth of the fluorophore are complicated by thermal disorder, resulting in broad distributions of the transverse positions of both quenchers and fluorophores. Twenty-one years ago a methodology called Distribution Analysis (DA) was introduced, based on the emerging view of the complexity of the transverse organization of lipid bilayer structure. The method is aimed at extracting quantitative information on membrane penetration, such as position and width of fluorophore's distribution along the depth coordinate and its exposure to the lipid phase. Here we review recent progress in refining the DA method and illustrate its applications to protein-membrane interactions. We demonstrate how basic assumptions of the DA approach can be validated using molecular dynamics simulations and how the precision of depth determination is improved by applying a new protocol based on a combination of steady-state and time-resolved fluorescence quenching. Using the example of the MPER fragment of the membrane-spanning domain of the HIV-1 gp41 fusion protein, we illustrate how DA applications and computer simulations can be used together to reveal the molecular organization of a protein-membrane complex.
1. Introduction to depth-dependent fluorescence quenching
Accurate determination of the depth of membrane penetration is an important step in characterizing membrane interactions of proteins and peptides. Knowledge of the immersion depth of an intrinsic fluorophore or a site-selectively attached external probe can help elucidate membrane orientation, topology and folding of a membrane protein. Depth-dependent fluorescence quenching (DDFQ) with either bromine atoms or doxyl groups attached to lipid molecules at specific positions can be used to obtain this information. The idea behind DDFQ experiments is a simple one: the stronger the quenching observed with a particular quencher, the closer the depth of the probe to the depth of this quencher. In reality, estimating the exact transverse location of the fluorophore in the lipid bilayer is complicated by multiple factors, such as a limited number of available quenchers of variable depth, deficient knowledge of the quenchers’ depths, etc. The most fundamental challenge, however, originates from the thermally disordered nature of the lipid bilayer. As a result, various lipid and protein moieties of the membrane are distributed over the ranges of depth. Thus, in order to capture the physical reality of membrane penetration, one needs to describe it in terms of distributions of depth. To answer this call within a specific application to depth-dependent fluorescence quenching, a method named Distribution Analysis (DA) was introduced 21 year ago (1-5). Over this period DA evolved into a popular tool in many research labs (6-15). Here we review recent progress in DA maturation connected to the application of advanced experimental schemes and the cross-pollination with molecular dynamics (MD) simulations, rapidly expanding into the area of membrane studies.
2. Overview of lipid-attached quenchers
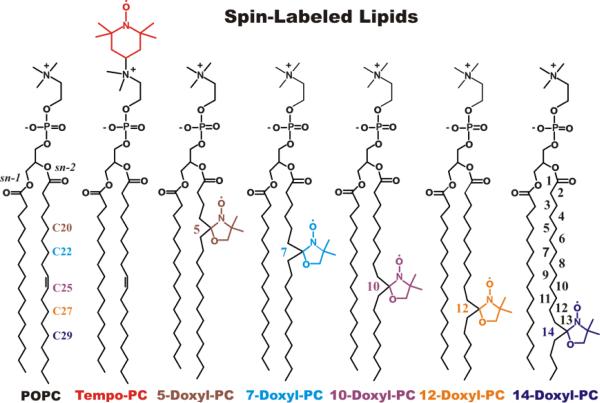
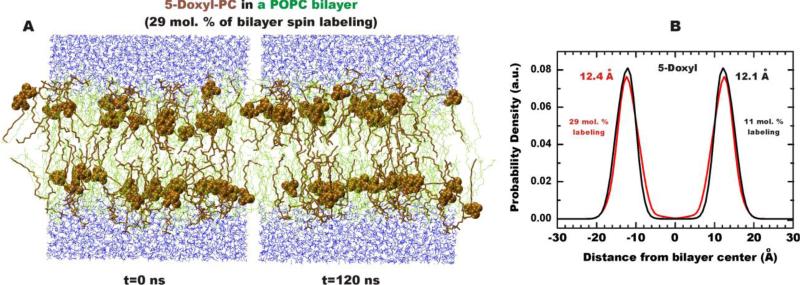
The two main types of quenchers used in DDFQ experiments are bromolipids and lipids with attached spin label groups. In the early years, when mainly tryptophan fluorescence was used, bromolipids were often considered choice quenchers, because McIntosh and Holloway had accurately characterized their positions in the bilayer using X-ray diffraction (16). The increased applications of site-selective labeling with various bright fluorescent probes caused a surge in the use of spin-labeled lipids (Fig. 1), which can quench probes that bromolipids can't (e.g., NBD and bimane). Another advantage of spin-labeled lipids is that the quenching group can also be attached to the headgroup region (TEMPO-PC) in addition to lipid acyl chains (Fig. 1), allowing examination of a shallower interfacial membrane penetration. This brought demand for a better characterization of the depth of the lipid-attached doxyl and TEMPO groups, which was achieved with various experimental approaches (17-22) and later with MD simulations (23). Because practical applications of DDFQ require relatively high concentration of quenchers, it was important to verify that the presence of multiple bulky quenching groups does not perturb the bilayer. The recent MD simulation of a series of spin-labeled lipids has confirmed that increasing the concentration of lipid quenchers to experimentally relevant levels of about 30 molar percent did not affect the location of the quenching group (Fig. 2), nor the dynamic properties of the bilayer (23).
Figure 1.
Spin-labeled lipids used for Depth-Dependent Fluorescence Quenching. Structure and atom numbering of unlabeled POPC, Tempo-PC (1-palmitoyl-2-oleoyl-sn-glycero-3-phospho(TEMPO)choline), n-Doxyl-PC (1-palmitoyl-2-stearoyl-(n-Doxyl)-sn-glycero-3-phosphocholine) spin-labeled lipids. A Tempo label (in red) is covalently attached to a headgroup and a Doxyl moiety (color-coded) is introduced to a variety of positions down to the sn-2 acyl chain of the host lipid. The transverse distributions and the dynamic properties of these quenchers incorporated into POPC bilayer at concentrations relevant for DDFQ experiments have been characterized by MD simulations (23).
Figure 2.
Distribution of 5-Doxyl-PC in POPC bilayer. (A) MD snapshots of lipid bilayers composed of 5-Doxyl-PC (brown) and POPC (green) with a ratio of 34:94 (29% of bilayer spin-labeling). The Doxyl labels are shown using van der Waals representation. (B) Probability densities of 5-Doxyl label and positions of peak densities are shown for the spin label concentrations of 11 (black) and 29 (red) mol %, respectively. Probability density peaks calculated from the center of a POPC bilayer are also shown (23).
3. Principles of data analysis
In the DDFQ experiment one determines the fluorescence intensity, F, or lifetime, τ, of a probe as a function of the known depth of the quencher, h. These data are usually normalized to the corresponding values measured in the absence of quenching (F0 and τ0) and are used to generate a depth-dependent quenching profile, QP(h), which provides visual reference of the quenching (e.g., Figs. 6b and 8). In the past, several definitions of the quenching profile were used, depending on the assumptions with regard of the nature of quenching process. The exact choice was shown to result in negligible (~ 0.1 Å) variations in calculated depth (24), however. Because the collisional dynamic nature of the quenching in membranes has been firmly established for both bromolipids and spin-labeled lipids (7, 14, 15), we suggest that the quenching profile should be defined as QP(h)=F0/F(h)-1, and as QP(h)=τ0/τ(h)-1, for intensity and lifetime measurements, respectively (this is further discussed in section 6).
Figure 6.
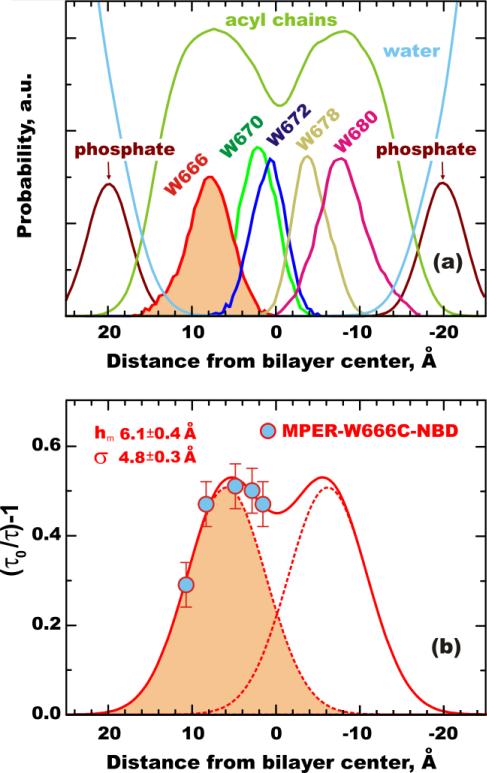
Example of combined application of DDFQ and MD simulation to study membrane penetration of peptide derived from MPER sequence of gp41 of HIV-1 (15). (a) Mass density distribution of the MPER peptide Trp residues along the TM direction. The Trp distributions are superimposed with the distribution of the lipid acyl chains (green), forming the hydrophobic core of the lipid bilayer. The distributions of the lipid phosphate groups (wine) and waters (cyan) are also shown, marking the interfacial region of the membrane. (b) Application of DA's Eq. 1 to DDFQ of NBD-labeled MPER mutant W666C. The fluorescence decays after pulsed excitation were measured for the MPER peptide in the presence of n-Doxyl-PC lipids (n equals 5, 7, 10, 12 or 14) co-incorporated into POPC vesicles by coextrusion. The averaged lifetimes with and without quenchers were used to generate a quenching profile (circles), which were fitted to a sum (solid line) of two mirror-imaged Gaussian distributions (dotted lines). The transverse distributions of W666 and W666C-NBD obtained in simulation and experiment, shown respectively as shaded profiles in panels (a) and (b), correspond well to each other.
Figure 8.
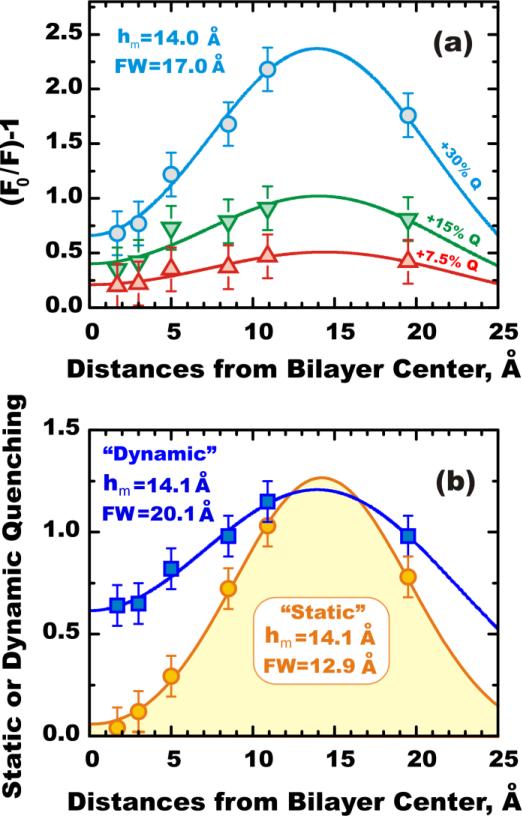
Application of DA to quenching profiles of NBD-PE obtained with a series of the spin-labeled lipids. The following quencher depths (defined as a distance from bilayer center) were used for n-Doxyl-PCs with n=14, 12, 10, 7, 5, and Tempo-PC: 1.7 Å, 3.0 Å, 5.0 Å, 8.5 Å, 10.9 Å and 18.2 Å, respectively. DA parameters for most probable position of the fluorophore (hm) and for the width of transverse distribution (FW) are shown on the graphs. (a) Application of DA methodology to steady-state fluorescence quenching of NBD-PE in vesicles containing (bottom-to-top) 7.5, 15, and 30 mol% quenchers. (b) Application of DA methodology to lifetime quenching (squares) and static quenching (circles) calculated as the difference between total quenching (circles in top panel) and dynamic (squares) profiles. Accounting for dynamic broadening on the wings of the quenching profile produces better-defined narrower “static” distributions of the depth of membrane penetration of the probe. See text and (14) for details.
The DA methodology approximates the transverse quenching profile with a sum of two symmetrical Gaussian functions:
| Eq. (1) |
where hm = the center (mean) of the quenching profile, σ = the width of the distribution, and S = the area of the quenching profile. The second component, G(-h), is an exact mirror image of the first one taken with respect to the bilayer center (h=0) and accounts for trans-leaflet quenching in the case of the deeply penetrating fluorophores(3) (e.g., see Fig. 6). Note that either single or coupled double Gaussian fits use only three fitting parameters: hm, σ and S, corresponding to the most probable depth of penetration, fluctuations in the transverse position, and overall accessibility to quenching (i.e., quenching efficiency), respectively.
While in many studies the goal is to determine the most probable position of the fluorophore (hm), the other two DA parameters provide important characterization of membrane penetration and can be further analysed in a procedure known as extended DA (2). The area under the quenching profile S provides a measure of lipid exposure of the fluorophore, while σ reports on depth's thermal envelope. The overall quenching efficiency in a particular sample is proportional to the concentration of quencher in the membrane C (usually expressed as a mole fraction to the total lipid), inherent quenching constant γ, excited-state lifetime in the absence of quenching τ0, and the degree of exposure of the probe to the lipid phase ω: S=Cγτ0ω. Consider a protein undergoing a conformational change in which the average depth of the probe is not changed, but fluorophore becomes less shielded from the lipid phase by the protein moiety. This will result in an increase in overall quenching parameter S. One can quantitate the degree of lipid exposure for a probe in a particular protein by comparing S parameter to that obtained for a reference compound, such as tryptophan octyl ester (TOE) (2, 7). In another example, the conformational change could produce a less restrictive anchoring of the protein, resulting in an increased width of the quenching profile σ. Indeed both cases described above were identified from quenching experiments using DA methodology (4).
The full width at half maximum of the quenching profile can be calculated from DA fit as . Note that the width of the quenching profile, FW(QP), is always larger than the width of the underlying distribution of the fluorophore, FW(F). Previously we have suggested that the latter can be estimated if the width of the quencher distribution, FW(Q), is similar for all quenchers using the following equation (2):
| Eq. (2) |
Consequently, it is possible to estimate the actual width of the distribution of the fluorophore from the quenching profile, if the broadening introduced by the distribution of quenchers is known from independent non-fluorescence experiments or a computer simulation. For example, the width associated with the size and thermal envelope of two bromine atoms in bromolipids is about 8 Å, as reported by X-ray diffraction (25). Our recent MD simulation of the lipid-attached doxyl quenchers suggest the width associated with the distribution of the oxygen atom to be about 7 Å, which is probably a lower end estimate of the corresponding width of the quencher distribution. Therefore, we suggest that FW(Q) ≈ 8 Å is a reasonable approximation to be used to estimate the width of the transverse distribution of the fluorophore from quenching data obtained with these quenchers using Eq. 2.
4. Validation of DA with MD simulations
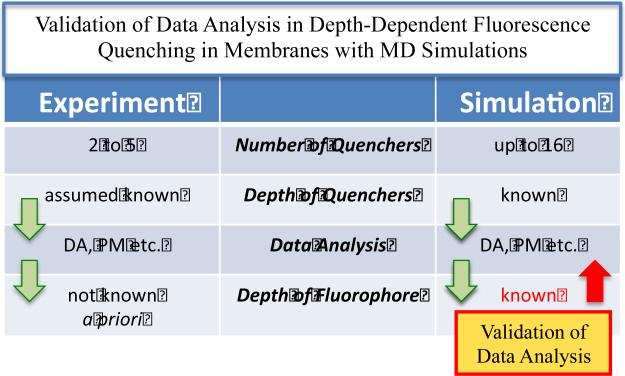
Any method of data analysis requires certain assumptions about the physical nature of the experimental system. For example, most methods for analyzing DDFQ make either explicit (e.g., extended DA (2)) or implicit (e.g., regular DA and Parallax Method (26, 27)) assumptions that transverse distributions of quenchers differ only by their depth and that the knowledge of the average depth of the quencher is sufficient for accurate analysis. Recently we suggested that various methods of data analysis can be compared and their underlying assumptions can be validated using MD simulations (5). The advantages of such a simulation-based validation vs. an experiment-based one are illustrated in a flow-chart, presented in Fig. 3. First, while experimental measurements are restricted to a limited number of available quenchers, MD simulations allow for the use of multiple quenchers (23) and pseudo-quenchers (i.e., regular atoms assigned quenching ability for the purpose of the simulation) (5). Second, the experimental validation would require determination of depth of the fluorophore with an additional, independent non-fluorescence technique (e.g., NMR or EPR) to which DDFQ results can be compared. In contrast, the MD-based validation does not have this requirement, as the exact depth distribution of the fluorophore is known from the same simulation.
Figure 3.
Flow chart illustrating differences in experimental and MD approaches for validating depth-dependent quenching methodology. Because MD operates with a vastly superior number of potential quenchers of known depth and because the target distribution of the fluorophore is also explicitly known, the MD-based validation of data analysis is preferable to experiment-based validation. Examples of simulation-based validation of different aspects of DDFQ data analysis are shown in Fig. 4 (comparison of DA and PM) and Fig. 5 (comparison of results obtained with the extended DA procedure and underlying depth distribution of the model fluorophore).
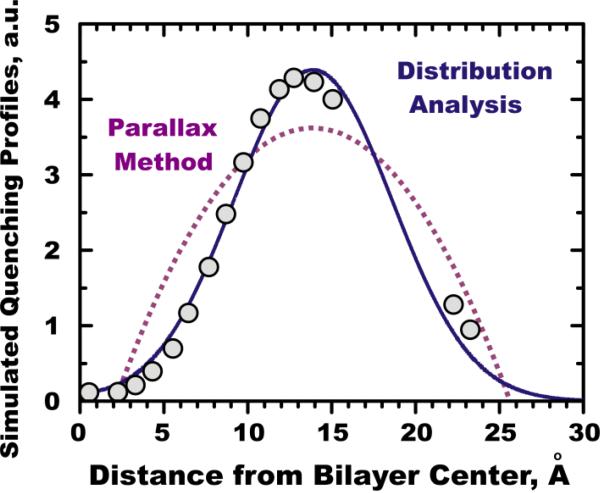
We illustrate the MD-based validation using a simulation of a model fluorophore tryptophan octyl ester (TOE) in a lipid bilayer (5). The two-step validation of data analysis is simple and straightforward: 1) the simulation is used to produce virtual quenching data, which are analyzed using various methods and the quality of fit is compared; 2) the results of the analysis are compared to the underlying distribution of the fluorophore. The results of the first step are illustrated in Fig. 4, depicting a simulated quenching profile (symbols) fitted with the equations corresponding to the two most popular methods in DDFQ: DA (solid line) and PM (dotted line). While PM is normally used as an analytical formula for a pair of quenchers, we have used an underlying equation to fit the data (details are described in (5)). Both curves have three fitting parameters (we used the quencher concentration as an additional floating parameter in PM, thus improving the fit to some degree), yet the quality of fit is dramatically different. While DA gives reasonably accurate description of the idealized quenching profile, PM fails to capture the physics of membrane motion responsible for the quenching. While the average depth reported by PM is not very far off, it is only due to the fact that the 16 data points used in the fitting procedure held the fit together to some extent. The errors would be much more dramatic were a limited number of quenchers used, as in experimental applications of PM, which are normally based on measurements with just two quenchers. In addition, the width recovered by the PM is much wider than the actual width of the quenching profile.
Figure 4.
Comparison of the two main methods of the DDFQ analysis using idealized MD-simulated quenching data of TOE in POPC bilayer. Depth-overlap probability integrals were calculated between TOE's indole fluorophore and each of the 16 carbon “pseudo quencher” atoms of POPC (circles). Solid line represents DA's fit with Equation 1 and dotted line represents fit with the basic equation of the PM (for further details see text and (5)).
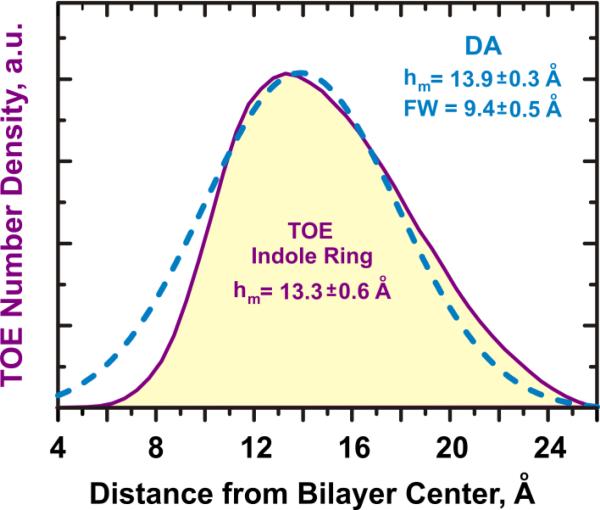
The second step of MD validation of DA is shown in Fig. 5 and consists of comparing the transverse distribution of the probe (indole ring of the TOE, in this case) estimated in a simulated quenching experiment (dashed line) with the actual distribution known directly from the MD (shaded distribution). We emphasize that the dashed line in Fig. 5 is not a direct fit to the actual distribution of TOE's indole depth, but is obtained by applying DA's equation 1 and 2 to a series of simulated pseudo-quenching data (Fig. 4) (5). The two profiles are quite similar with respect to the main position and the width, demonstrating that DA methodology accurately describes depth-dependent quenching in membranes.
Figure 5.
Validation of DA methodology using MD simulations of DDFQ of TOE in lipid bilayer. MD-generated distribution (density profile) of the TOE indole ring (shaded), is compared to the distribution generated from pseudo-quenching data (circles in Fig. 4) by the extended DA procedure utilizing Eqs. 1 and 2 (dashed line). Close resemblance of the two profiles demonstrates that DA is capable not only of accurately estimating the average depth but also the width of the depth distribution. See text and (5) for details.
5. Membrane interaction of MPER: example of combined application of experiment and computer simulation
We illustrate the application of DA using membrane interaction of the peptide derived from the so-called MPER region of membrane-interacting C-terminal domain of the HIV-1 gp41 fusion protein. This aromatic-rich MPER sequence covering residues 662-683 is an important target for neutralizing anti-HIV monoclonal antibodies (28). While the overall topology of the membrane-interacting domain of gp41 remains controversial (29), the MPER sequence was considered to have an interfacial topology. Our recent fluorescence and oriented circular dichroism results, however, demonstrated that, depending on experimental conditions, the isolated MPER peptide can also exist in a membrane-spanning helical conformation (15). To examine the conformation and orientation of this transmembrane form of MPER, we performed an MD simulation of the peptide in a fully hydrated POPC bilayer. Based on these simulations, we have estimated the transverse distributions of each of the five Trp residues of MPER and compared them with the distributions of acyl chains, lipid phosphate groups, and interfacially penetrating water molecules in Fig. 6a. To verify the features of the MPER penetration revealed by the MD simulation, we prepared a single-cysteine mutant of the peptide, replacing W666, and labeling it with an NBD fluorophore. This peptide enables us to conduct a selective DDFQ experiment of the NBD fluorophore using lipid-attached doxyl probes.
As discussed above, DDFQ allows one to estimate the membrane penetration of a fluorophore attached to a site of interest on a protein or peptide by measurements of the changes in intensity or lifetime upon addition of the lipid-attached quenchers of known depth. Here we have used fluorescence lifetime measurements for a series of MPER/LUV samples where we incorporated into a POPC matrix identical fractions of the lipids labeled with doxyl probes attached along the sn-2 acyl fatty chain at positions 5, 7, 10, 12 or 14, respectively. Lifetime measurements are more reliable than standard intensity measurements, as they are independent of the concentration of the fluorophores, and hence are better suited for membrane studies dealing with hydrophobic sequences subject to losses due to precipitation (30). We have used the DA's Eq. 1 for quantitative analysis of quenching, i.e., fitted the experimental quenching profiles to a symmetrical sum of two mirror-image Gaussian distributions, each representing penetration into a single leaflet, as illustrated in Fig 6b. The lifetime quenching data are shown as symbols, and the principle Gaussian distribution for the quenching profile of NBD attached to W666C mutant of MPER peptide is highlighted, with the mirror-image shown by a dotted line. The recovered distribution has an average transverse position of about 6 Å from the center of the bilayer and a substantial width due to the thermal motion. It is very close to the average distribution of the W666 from MD simulation (compare highlighted distributions in Figs. 6a,b), providing reasonable experimental validation of our MD simulation. Taken together the variety of computational and experimental results characterizes previously unknown conformational arrangement of the MPER peptide positioned across the lipid bilayer (15).
6. Refining methodology through a combination of steady-state and lifetime measurements
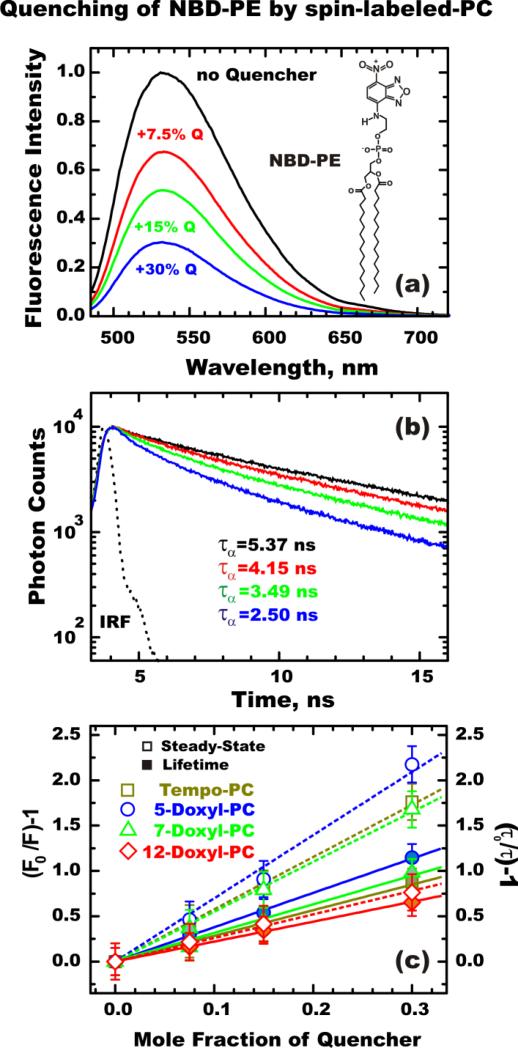
In order to evaluate the interplay of static and dynamic quenching in the depth-dependent measurements, we have measured steady-state and time-resolved fluorescence of NBD-PE (Fig. 7a), which is a popular model compound often used as a reference for fluorescence of membrane proteins site-selectively labeled with NBD (14, 30-32). NBD-PE was incorporated into POPC large unilamellar vesicles by co-extrusion along with various amounts of one of the following quenchers: Tempo-PC, 5-Doxyl-PC, 7-Doxyl-PC, 10-Doxyl-PC, 12-Doxyl-PC and 14-Doxyl-PC. The examples of steady-state (Fig. 7a) and time-resolved quenching (Fig. 7b) with Tempo-PC clearly illustrate that the total loss in intensity is stronger than the reduction of the lifetime, which indicates a substantial static quenching. The contribution of static quenching becomes even more apparent when reductions in intensity and lifetime are plotted in Stern-Volmer coordinates, in Fig. 7c. Note that for quenchers localized in a lipid bilayer, the proper units of concentration are the fractions of quencher-labeled lipids in total lipid, therefore the corresponding Stern-Volmer constants are dimensionless (they correspond to the reciprocal value of quencher concentration, resulting in a 50% reduction in fluorescence intensity or lifetime for total or dynamic quenching, respectively). The following Stern-Volmer constants correspond to intensity measurements (Fig. 7c, open symbols): 5.8 for Tempo-PC; 7.0 for 5-Doxyl-PC; 5.5 for 7-Doxyl-PC and 2.6 for 12-Doxyl-PC. The dynamic Stern-Volmer constants for the same sequence of quenchers estimated from lifetime measurements (closed symbols) are: 2.8; 3.8; 3.2 and 2.2, respectively.
Figure 7.
Depth-dependent fluorescence quenching of NBD-PE in large unilamellar vesicles (14). (a) Examples of the steady-state fluorescence quenching of NBD-PE coextruded with spin quencher Tempo-PC into POPC vesicles. The concentration of Tempo-PC was varied from 7.5 mol% to 30 mol%, leading to a gradual decrease in the fluorescence intensity of the NBD fluorophore. (b) Fluorescence decays followed after the pulsed excitation demonstrate the shortening of NBD lifetime by quenching. The amplitude-averaged lifetime τα estimated by double exponential fitting of the decay curves are shown for the samples containing (top-to-bottom) no quencher (black), and in the presence of 7.5 (red), 15 (green), and 30 mol% (blue) Tempo-PC, respectively. (c) Stern-Volmer plots for the steady-state (open symbols and dotted lines) and lifetime (solid symbols and lines) quenching of NBD-PE in vesicles containing various spin-labeled lipids. F0/F and τ0/τ are the ratios of the fluorescence intensities and the lifetimes in the absence and in the presence of the quenchers, respectively.
The difference between the two clearly indicates variable contribution of static quenching, which is further illustrated below with appropriate depth-dependent quenching profiles (Fig. 8). Increasing quencher concentration results in more distinct quenching profiles indicating a wide distribution with the most probable position of the fluorophore at about 14 Å from bilayer center (Fig. 8a). Our results are also consistent with those of Molecular Dynamics simulations of NBD-PE in POPC bilayer (Kyrychenko and Ladokhin, in preparation).
The deconvolution of the total quenching profile of NBD-PE obtained with a series of lipid-attached quenchers into dynamic and static components is shown in Figure 8b (14). Dynamic profile (squares) is defined as a quenching efficiency observed in a lifetime quenching experiment, while a static profile (solid circles) is the difference between total quenching efficiency (open circles in Fig. 8a) and the dynamic component. While the average position is the same, the static distribution is much narrower than the dynamic profile. We suggest that this dynamic broadening reflects the nature of the quenching process in the bilayer. If the position of quencher matches well to that of the excited fluorophore, than quenching occurs very fast and will be observed as static quenching in our experiments (for our experimental setup any lifetime component shorter than 100 ps will be indistinguishable from the scattering caused by vesicles and will be excluded from the analysis (30, 32). Dynamic quenching is obviously never completely eliminated because of the lateral diffusion, which contributes even for samples containing high concentrations of quenchers (7). Additional diffusion in a direction normal to the bilayer occurs when fluorophore and quencher are separated on the depth scale but come together during excited state lifetime. This results in dynamic broadening of the quenching profile, clearly apparent in Fig. 8b.
The DDFQ study of a model compound NBD-PE, summarized in Fig. 8, clearly demonstrates how a combination of steady-state and time-resolved measurements can be used to generate a static depth-dependent quenching profile that reduces the contribution from the transverse diffusion occurring during the excited-state lifetime. As a result, we calculate narrower, better-defined quenching profiles, compared to those obtained by traditional measurements of intensity or lifetime. This approach can be applied to studies of membrane proteins to improve the precision of the determination of bilayer penetration of the site-selectively attached probes.
7. Summary
Determination of membrane penetration of proteins and peptides is a challenging task, complicated by the disordered nature of the lipid bilayer. DA methodology, applied to fluorescence quenching in membranes, has become an established tool in such studies. In recent years, the method's underlying assumptions have been validated with the help of MD simulations and its resolution improved by combining steady-state and lifetime fluorescence measurements. Further efforts in method development will be aimed at designing integrated approaches combining various experimental and computational techniques.
Highlights.
Membrane penetration is characterized by depth-dependent fluorescence quenching
Distribution Analysis method is used to extract quantitative information
Manuscript reviews principles and applications of Distribution Analysis
Molecular dynamics simulations are used to validate method's assumptions
Intensity and lifetime measurements are used to refine membrane penetration depth
ACKNOWLEDGMENT
The author is grateful to Dr. Alexander Kyrychenko for his multiple contributions to the described work and for helping with figure preparations and to Mr. M.A. Myers for his editorial assistance.
Funding Sources
This research was supported by NIH grant GM-069783.
ABBREVIATIONS
- DAy
Distribution Analysis
- PM
Parallax Method
- DDFQ
depth-dependent fluorescence quenching
- QP
quenching profile
- FW
full width on half maximum
- POPC
1-palmitoyl-2-oleoyl-sn-glycero-3-phosphocholine
- TOE
tryptophan octyl ester
- MPER
membrane proximal ectodomain region of gp41 HIV envelope protein
Footnotes
Publisher's Disclaimer: This is a PDF file of an unedited manuscript that has been accepted for publication. As a service to our customers we are providing this early version of the manuscript. The manuscript will undergo copyediting, typesetting, and review of the resulting proof before it is published in its final citable form. Please note that during the production process errors may be discovered which could affect the content, and all legal disclaimers that apply to the journal pertain.
References
- 1.Ladokhin AS. Distribution analysis of membrane penetration by depth dependent fluorescence quenching. Biophys.J. 1993;64:A290–A290. doi: 10.1007/BF00862742. [DOI] [PubMed] [Google Scholar]
- 2.Ladokhin AS. Distribution analysis of depth-dependent fluorescence quenching in membranes: A practical guide. Methods Enzymol. 1997;278:462–473. doi: 10.1016/s0076-6879(97)78024-8. [DOI] [PubMed] [Google Scholar]
- 3.Ladokhin AS. Analysis of protein and peptide penetration into membranes by depth-dependent fluorescence quenching: Theoretical considerations. Biophys.J. 1999;76:946–955. doi: 10.1016/S0006-3495(99)77258-9. [DOI] [PMC free article] [PubMed] [Google Scholar]
- 4.Ladokhin AS. Evaluation of lipid exposure of tryptophan residues in membrane peptides and proteins. Anal.Biochem. 1999;276:65–71. doi: 10.1006/abio.1999.4343. [DOI] [PubMed] [Google Scholar]
- 5.Kyrychenko A, Tobias DJ, Ladokhin AS. Validation of Depth-Dependent Fluorescence Quenching in Membranes by Molecular Dynamics Simulation of Tryptophan Octyl Ester in POPC Bilayer. The journal of physical chemistry. B. 2013;117:4770–4778. doi: 10.1021/jp310638f. [DOI] [PMC free article] [PubMed] [Google Scholar]
- 6.Ladokhin AS, Holloway PW, Kostrzhevska EG. Distribution analysis of membrane penetration of proteins by depth-dependent fluorescence quenching. J.Fluorescence. 1993;3:195–197. doi: 10.1007/BF00862742. [DOI] [PubMed] [Google Scholar]
- 7.Ladokhin AS, Holloway PW. Fluorescence of membrane-bound tryptophan octyl ester: A model for studying intrinsic fluorescence of protein-membrane interactions. Biophys.J. 1995;69:506–517. doi: 10.1016/S0006-3495(95)79924-6. [DOI] [PMC free article] [PubMed] [Google Scholar]
- 8.Ladokhin AS, Holloway PW. Fluorescence quenching study of melittin-membrane interactions. Ukrainian Biochemical Journal. 1995;67:34–40. [PubMed] [Google Scholar]
- 9.Breukink E, van Kraaij C, van Dalen A, Demel RA, Siezen RJ, de Kruijff B, Kuipers OP. The orientation of nisin in membranes. Biochemistry. 1998;37:8153–8162. doi: 10.1021/bi972797l. [DOI] [PubMed] [Google Scholar]
- 10.Kleinschmidt JH, Tamm LK. Time-resolved distance determination by tryptophan fluorescence quenching: Probing intermediates in membrane protein folding. Biochemistry. 1999;38:4996–5005. doi: 10.1021/bi9824644. [DOI] [PubMed] [Google Scholar]
- 11.van Heusden HE, de Kruijff B, Breukink E. Lipid II induces a transmembrane orientation of the pore-forming peptide lantibiotic nisin. Biochemistry. 2002;41:12171–12178. doi: 10.1021/bi026090x. [DOI] [PubMed] [Google Scholar]
- 12.Phillips LR, Milescu M, Li-Smerin Y, Mindell JA, Kim JI, Swartz KJ. Voltage-sensor activation with a tarantula toxin as cargo. Nature. 2005;436:857–860. doi: 10.1038/nature03873. [DOI] [PubMed] [Google Scholar]
- 13.Jung HH, Jung HJ, Milescu M, Lee CW, Lee S, Lee JY, Eu YJ, Kim HH, Swartz KJ, Kim JI. Structure and orientation of a voltage-sensor toxin in lipid membranes. Biophysical journal. 2010;99:638–646. doi: 10.1016/j.bpj.2010.04.061. [DOI] [PMC free article] [PubMed] [Google Scholar]
- 14.Kyrychenko A, Ladokhin AS. Refining membrane penetration by a combination of steady-state and time-resolved depth-dependent fluorescence quenching. Analytical biochemistry. 2014;446:19–21. doi: 10.1016/j.ab.2013.10.015. [DOI] [PMC free article] [PubMed] [Google Scholar]
- 15.Kyrychenko A, Freites JA, He J, Tobias DJ, Wimley WC, Ladokhin AS. Structural plasticity in the topology of the membrane-interacting domain of HIV-1 gp41. Biophysical journal. 2014;106 doi: 10.1016/j.bpj.2013.12.032. [DOI] [PMC free article] [PubMed] [Google Scholar]
- 16.McIntosh TJ, Holloway PW. Determination of the depth of bromine atoms in bilayers formed from bromolipid probes. Biochemistry. 1987;26:1783–1788. doi: 10.1021/bi00380a042. [DOI] [PubMed] [Google Scholar]
- 17.Dalton LA, McIntyre JO, Fleischer S. Distance estimate of the active center of D-β-hydroxybutyrate dehydrogenase from the membrane surface. Biochemistry. 1987;26:2117–2130. doi: 10.1021/bi00382a009. [DOI] [PubMed] [Google Scholar]
- 18.Vogel A, Scheidt HA, Huster D. The distribution of lipid attached spin probes in bilayers: Application to membrane protein topology. Biophys.J. 2003;85:1691–1701. doi: 10.1016/S0006-3495(03)74599-8. [DOI] [PMC free article] [PubMed] [Google Scholar]
- 19.Nielsen RD, Che K, Gelb MH, Robinson BH. A ruler for determining the position of proteins in membranes. J.Am.Chem.Soc. 2005;127:6430–6442. doi: 10.1021/ja042782s. [DOI] [PubMed] [Google Scholar]
- 20.Klug CS, Feix JB. Methods and applications of site-directed spin labeling EPR spectroscopy. Methods in cell biology. 2008;84:617–658. doi: 10.1016/S0091-679X(07)84020-9. [DOI] [PubMed] [Google Scholar]
- 21.Al-Abdul-Wahid MS, Neale C, Pomes R, Prosser RS. A solution NMR approach to the measurement of amphiphile immersion depth and orientation in membrane model systems. Journal of the American Chemical Society. 2009;131:6452–6459. doi: 10.1021/ja808964e. [DOI] [PubMed] [Google Scholar]
- 22.Chu S, Maltsev S, Emwas AH, Lorigan GA. Solid-state NMR paramagnetic relaxation enhancement immersion depth studies in phospholipid bilayers. J Magn Reson. 2010;207:89–94. doi: 10.1016/j.jmr.2010.08.012. [DOI] [PMC free article] [PubMed] [Google Scholar]
- 23.Kyrychenko A, Ladokhin AS. Molecular Dynamics Simulations of Depth Distribution of Spin-Labeled Phospholipids within Lipid Bilayer. The journal of physical chemistry. B. 2013;117:5875–5885. doi: 10.1021/jp4026706. [DOI] [PMC free article] [PubMed] [Google Scholar]
- 24.London E, Ladokhin AS. Measuring the depth of amino acid residues in membrane-inserted peptides by fluorescence quenching. Current Topics in Membranes. 2002;52:89–115. [Google Scholar]
- 25.Wiener MC, White SH. Transbilayer distribution of bromine in fluid bilayers containing a specifically brominated analog of dioleoylphosphatidylcholine. Biochemistry. 1991;30:6997–7008. doi: 10.1021/bi00242a027. [DOI] [PubMed] [Google Scholar]
- 26.Chattopadhyay A, London E. Parallax method for direct measurement of membrane penetration depth utilizing fluorescence quenching by spin-labeled phospholipids. Biochemistry. 1987;26:39–45. doi: 10.1021/bi00375a006. [DOI] [PubMed] [Google Scholar]
- 27.Abrams FS, London E. Extension of the parallax analysis of membrane penetration depth to the polar region of model membranes: Use of fluorescence quenching by a spin-label attached to the phospholipid polar headgroup. Biochemistry. 1993;32:10826–10831. doi: 10.1021/bi00091a038. [DOI] [PubMed] [Google Scholar]
- 28.Song L, Sun ZY, Coleman KE, Zwick MB, Gach JS, Wang JH, Reinherz EL, Wagner G, Kim M. Broadly neutralizing anti-HIV-1 antibodies disrupt a hinge-related function of gp41 at the membrane interface. Proceedings of the National Academy of Sciences of the United States of America. 2009;106:9057–9062. doi: 10.1073/pnas.0901474106. [DOI] [PMC free article] [PubMed] [Google Scholar]
- 29.Steckbeck JD, Kuhlmann AS, Montelaro RC. C-terminal tail of human immunodeficiency virus gp41: functionally rich and structurally enigmatic. The Journal of general virology. 2013;94:1–19. doi: 10.1099/vir.0.046508-0. [DOI] [PMC free article] [PubMed] [Google Scholar]
- 30.Posokhov YO, Ladokhin AS. Lifetime fluorescence method for determining membrane topology of proteins. Analytical biochemistry. 2006;348:87–93. doi: 10.1016/j.ab.2005.10.023. [DOI] [PubMed] [Google Scholar]
- 31.Ladokhin AS, Isas JM, Haigler HT, White SH. Determining the membrane topology of proteins: Insertion pathway of a transmembrane helix of annexin 12. Biochemistry. 2002;41:13617–13626. doi: 10.1021/bi0264418. [DOI] [PubMed] [Google Scholar]
- 32.Kyrychenko A, Posokhov YO, Rodnin MV, Ladokhin AS. Kinetic intermediate reveals staggered pH-dependent transitions along the membrane insertion pathway of the diphtheria toxin T-domain. Biochemistry. 2009;48:7584–7594. doi: 10.1021/bi9009264. [DOI] [PMC free article] [PubMed] [Google Scholar]


