Abstract
Objective
Intra-retinal placement of stimulating electrodes can provide close and stable proximity to target neurons. We assessed improvement in stimulation thresholds and selectivity of the direct and network-mediated retinal stimulation with intraretinal electrodes, compared to epiretinal and subretinal placements.
Approach
Stimulation thresholds of the retinal ganglion cells (RGCs) in wild-type rat retina were measured using patch-clamp technique. Direct and network-mediated responses were discriminated using various synaptic blockers.
Main results
Three types of RGC responses were identified: short latency (SL, τ<5ms) originating in RGCs, medium latency (ML, 3<τ<70ms) originating in the inner nuclear layer and long latency (LL, τ>40ms) originating in photoreceptors. Cathodic epiretinal stimulation exhibited the lowest threshold for direct RGC response and the highest direct selectivity (network/direct thresholds ratio), exceeding a factor of 3 with pulse durations below 0.5ms. For network-mediated stimulation, the lowest threshold was obtained with anodic pulses in OPL position, and its network selectivity (direct/network thresholds ratio) increased with pulse duration, exceeding a factor of 4 at 10ms. Latency of all three types of responses decreased with increasing strength of the stimulus.
Significance
These results define optimal range of pulse durations, pulse polarities and electrode placement for the retinal prostheses aiming at direct or network-mediated stimulation of RGCs.
Introduction
Retinal degenerative diseases, such as age-related macular degeneration and retinitis pigmentosa, lead to blindness due to the loss of photoreceptors (Ferris et al. 1984, Phelan and Bok 2000, Daiger et al. 2007). However, a significant number of the inner retinal neurons survive in such diseases (Stone et al. 1992, Kim et al. 2002, Mazzoni et al. 2008), raising the possibility of a functional restoration of vision by stimulation of the remaining inner retinal neurons. Multiple approaches to restoration of sight in individuals affected by these diseases are being explored, including optogenetics (Busskamp and Roska 2011, Reutsky-Gefen et al. 2013), molecular photoswitches (Polosukhina et al. 2012), stem cells-based therapy (Schraermeyer 2001, Enzmann et al. 2009) and electronic retinal prostheses (Rizzo et al. 2001; Zrenner 2002, Weiland et al. 2005; Palanker et al. 2005; Klauke et al. 2011, Fujikado et al. 2011, Hadjinicolaou et al. 2012). Recent clinical trials of epiretinal electronic implants (Humayun et al. 2011, da Cruz et al. 2013) in patients blinded by retinitis pigmentosa demonstrated equivalent visual acuity up to 20/1260 in the most successful patient, leading to clinical approval in US and Europe. Even better visual acuity of 20/550 has been recently demonstrated with subretinal implant (Stingl et al. 2013).
The epiretinal approach to retinal prosthetics aims at direct stimulation of the retinal ganglion cells (RGCs) using electrodes placed on the inner limiting membrane of the retina. Encoding visual information by direct activation of RGCs implies that each stimulation pulse produces a single action potential (AP) with a latency of about 1 ms (Sekirnjak et al. 2006, Boinagrov et al. 2010, Eickenscheidt et al. 2012). On the contrary, stimulation of the inner retinal neurons in many cases results in the generation of bursts of spikes (Stett et al. 2000, Tsai et al. 2009), resembling ON retinal response to a short pulse of light. Epiretinal stimulation can evoke both, the early (direct) responses (~1 ms) and late (network-mediated) responses. The network-mediated origin of the latter was proven by inhibiting neurotransmitter release with cadmium or postsynaptic glutamate receptor antagonists (Stett et al. 2000, Margalit and Thoreson 2006). RGCs can accurately follow electrical stimulation with rates up to 250 Hz, which corresponds to the maximum spike frequencies in the natural light responses (Fried et al. 2006). Therefore, direct RGC stimulation may allow precise mimicking of RGC bursts characteristic to normal vision (Sekirnjak et al. 2006, Hottowy et al. 2012), so long as the network response is avoided. Such strategy requires (a) knowledge of the retinal code for each RGC type, (b) identification of each cell type, and (c) accessibility of each RGC to selective stimulation with a proper sequence of pulses. However, (a) the retinal code is not yet well understood, (b) it is not clear how to identify various RGC types in degenerate retina, especially in-vivo, and (c) not every cell in the multilayered ganglion cell layer (GCL) can be selectively approached and stimulated. Moreover, as epiretinal electrodes are positioned on top of the nerve fiber layer and axonal stimulation thresholds are similar to that of RGC somas, axonal stimulation is hard to avoid. It is likely the cause of arcuate or wedged visual percepts in patients stimulated with single epiretinal electrodes (Nanduri et al. 2012).
An alternative approach is to stimulate the first layer of neurons after photoreceptors – the inner nuclear layer, and rely on the retinal network conversion of single pulse stimuli into RGC bursting (Mathieson et al. 2012, Mandel et.al. 2013). Retinal reorganization associated with degeneration though will likely alter the normal network responses to subretinal stimulation (Jones and Marc 2005), potentially limiting the benefits of engaging the retinal circuitry. Both types of stimulation result in retinal signals very different from the natural retinal code, so both strategies rely on brain’s ability to learn the new signaling code over time, as it happens with the cochlear implants. Both approaches produced very encouraging results in clinical trials, and subretinal approach yielded the most encouraging results with the best visual acuity of 20/550 in the most successful patient (Stingl et al. 2013).
It remains unclear though to what extent the direct and network-mediated responses are involved in epi- and sub-retinal stimulation with various pulse parameters. In this paper we describe two types of selectivity of the RGC stimulation – direct and network-mediated. Direct selectivity defines a dynamic range over which a direct response of RGCs can be elicited without activation of the inner retinal network. It is defined as a ratio of the thresholds of the network-mediated and direct responses. Network selectivity quantifies the opposite effect: the ability of eliciting a network-mediated response without direct activation of RGCs. It is defined as a ratio of the stimulation thresholds of direct and network-mediated responses for a given stimulus duration, polarity and electrode location. In the present study we examined direct and network selectivities of RGC stimulation as a function of the stimulus polarity, pulse width and electrode location in the rat retina.
To achieve closer proximity to the target neurons in subretinal approach 3-dimensional implants with either chamber arrays (Palanker et al. 2004, Palanker et al. 2005, Butterwick et al. 2009), pillar arrays (Loudin et al. 2007, Mathieson et al. 2012) or other 3D shapes (Khraiche et al. 2011, Bendali et al. 2012) have been proposed. In such arrangements, the electrodes can be placed in the middle of the retina, close to the inner nuclear layer (INL). Similarly, penetrating electrodes have also been proposed for epiretinal approach (Ganesan et al. 2010, Gefen 2012). To assess potential advantages of intraretinal electrodes, we compared the thresholds and selectivity of direct and network-mediated stimulation with electrodes placed inside the retina (just above and just below the INL) to the thresholds measured in epiretinal and subretinal positions.
Materials and Methods
Retinal Preparation
Male wild-type Long-Evans rat (Charles River Laboratories International, Inc., Wilmington, MA) retinas were used for these experiments. Rats were handled humanely, according to the guidelines of the Association for Research in Vision and Ophthalmology (ARVO) and protocols approved by the Institutional Animal Care and Use Committee at Stanford Medical School. P45-P80 animals were anesthetized by inhalation of evaporated isoflurane (1 g/liter, Baxter Healthcare Corporation, Deerfield, IL) and subsequently euthanized with an intraperitoneal injection of Beuthanasia-D (1 ml/kg of animal weight, Schering-Plough Animal Health Corp., Union, NJ). The eyes were enucleated and hemisected in the Ames medium (Sigma-Aldrich, St. Louis, MO) bubbled with a mixture of 95% O2 and 5% CO2 (Airgas, Redwood City, CA). After hemisecting the eye, lens and vitreous humor were removed, and the retina was detached from the pigment epithelium. Subsequently, retina was cut into pieces ~2 mm2 in size, attached to filter paper, and kept at room temperature under ambient light conditions before being placed in the perfusion chamber photoreceptor side down (see Figure 1). A hole (~ 1 mm in diameter) was cut in the center of the filter paper to allow imaging of the RGCs via differential interference contrast (DIC) microscope in transmitted illumination. Artificial cerebrospinal fluid (ACSF, containing in mM: NaCl 126, glucose 10, KCl 2.5, NaH2PO4*H2O 1.25, MgSO4*7H2O 1, CaCl2*2H2O 2, NaHCO3 26), bubbled with 95% O2 and 5% CO2 (pH 7.3) was heated via inline heater and delivered to the perfusion chamber (bath) at a rate of ~3 ml/min to maintain the bath temperature at 31 ± 1 °C. In pharmacological experiments, synaptic blockers were applied to the ACSF.
Figure 1.
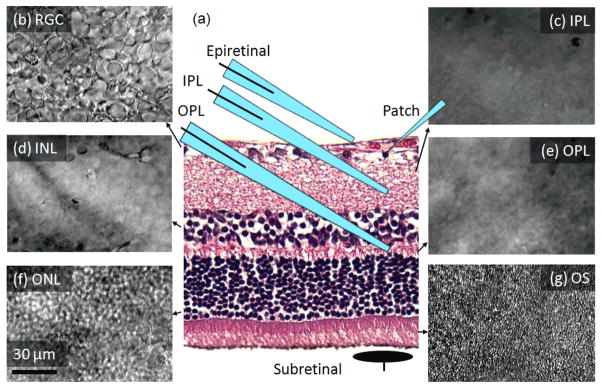
Long-Evans rat retina. (a) Retinal histology illustrating positioning of the patch pipette, and four positions of the stimulation electrodes: epiretinal, IPL, OPL and subretinal. (b)– (g) – appearance of the retinal layers in the DIC microscope, (b) RGC, (c) inner plexiform (IPL), (d) inner nuclear (INL), (e) outer plexiform (OPL), (f) outer nuclear (ONL), (g) photoreceptors outer segments (OS).
Recording from RGCs
Cells were classified as ganglion based on their location in the ganglion cell layer and presence of prominent fast inward sodium currents, although occasional occurrence of some displaced amacrine cells cannot be completely excluded (Jeon et al. 1998). The patch-clamp technique (Sakmann and Neher 1984) was used to record the cell potential of individual RGCs with soma diameters larger than average (>15μm). Micropipettes with tips of ~1 μm outer diameter and resistance values of 5–15 MOhm were pulled from borosilicate glass tubes using a Sutter P-2000 pipette puller (Sutter Instrument Co., Novato, CA). The pipette electrolyte solution contained: 116 mM KCH3SO4; 10 mM KCl, 10 mM HEPES; 1 mM CaCl2; 0.5 mM EGTA; 4 mM Mg2-ATP; 0.5 mM Na2-GTP (pH 7.3; 270 mOsm osmolarity, all from Sigma-Aldrich, St. Louis, MO). A silver-chloride electrode was immersed in the patch pipette, and a large silver wire placed in the perfusion chamber served as a reference electrode. Signal recording in the current clamp mode was performed with a Multiclamp 700A Amplifier (Molecular Devices, Sunnyvale, CA), digitized with a Digidata 1440 (Molecular Devices), and recorded on a PC with PClamp 10.2 Software (Molecular Devices). The health of recorded RGC was verified by assuring that its resting potential was in the range of −70±10 mV, that it did not shift by more than 10 mV during the course of recordings, and that the amplitude of AP did not decrease by more than half of its initial value.
Retinal Stimulation
Stimulation was performed with electrodes placed in 4 different positions in the retina: epiretinal, 2 intraretinal (in IPL and OPL) and subretinal (see Figure 1). For epiretinal and intraretinal stimulation, electrical current was delivered by a micropipette of 4–8 μm diameter, filled with ACSF and containing an immersed thick silver or platinum wire electrode. An epiretinal pipette was placed 10–20 μm away from the recorded RGC, without penetrating the nerve fiber layer. The intraretinal stimulation pipettes were placed under the recorded RGCs, with a lateral displacement within 20–40 μm. Vertical positioning of the stimulating pipette at proper depth was controlled by focusing the microscope on individual retinal layers (Figure 1). Typically, for IPL placement the pipette tips were immersed at a depth of 20–30 μm, while for OPL – at 70–80 μm. Subretinal stimulation electrode was a 40 μm disc coated with sputtered iridium oxide film (SIROF), and wired by an insulated lead deposited on a glass base placed under the retina. A large electrode placed in the bath far away from the active electrode was used as a return. Rectangular monophasic cathodic and anodic pulses of 0.1–100 ms in duration were generated with an isolated pulse stimulator, Model 2100 (A-M Systems, Carlsborg, WA) and delivered at a repetition rate of 1 Hz. Latency of an elicited AP was defined as a time interval between the stimulus onset and the peak voltage of the AP. 20 consecutive pulses were delivered for any given current and duration to calculate the probability of eliciting a response. Stimulation threshold was defined as a setting corresponding to a 50% probability of eliciting AP. The charge in monophasic waveform was balanced by a low-amplitude long discharge between consecutive pulses. The strength-duration relationship of direct and network-mediated stimulation thresholds was determined for each location.
Data analysis
Stimulation thresholds were measured for each stimulation configuration (duration, polarity, electrode location) and response type (short-, medium-, and long-latency: SL, ML, LL). Thresholds varied from cell to cell, and for the purpose of statistical analysis they were assumed to be distributed log-normally. Thus, an estimate for the mean threshold value was calculated as a geometric mean of individual thresholds, and the estimate for the error of mean was done using the geometric standard deviation. According to the log-normal statistics, 70% of the data lie within the estimated error of the mean value. Statistical significance of hypotheses were verified using two-tailed two-sample Student’s t-test, assuming unequal variances.
RGC classification
The type of the RGC (ON vs. OFF) was determined by extending the method described in Margolis et al. (2010) to RGCs in our experiment. We injected hyperpolarizing intracellular current, which exhibited a characteristic rebound spike selectively in OFF RGCs. Intracellular injection of a long anodic pulse performed with the patch pipette resulted in immediate spiking (Figure 2). Cathodic current suppressed any spiking during the pulse, but elicited the rebound spike in OFF RGCs, but not in ON cells. This rebound spiking is attributed to inactivating voltage sensitive calcium ion channels in the RGC dendrites, which are absent in ON RGCs (Margolis et al. 2010). To validate the Margolis classification, the RGC responses to green light stimuli have been recorded in a subset of cells (n=6) using 200 ms pulses of 2 nW/mm2. Rebound spike to hyperpolarizing current has been observed only in cells which decreased their spiking rate under light (OFF response), while in the cells exhibiting increase in the spiking rate upon illumination (ON response), the rebound spike was absent, confirming applicability of Margolis test to large RGCs in the rat retina. Since Margolis’ classification was not established for all RGC subtypes, it can be considered a tentative one.
Figure 2.
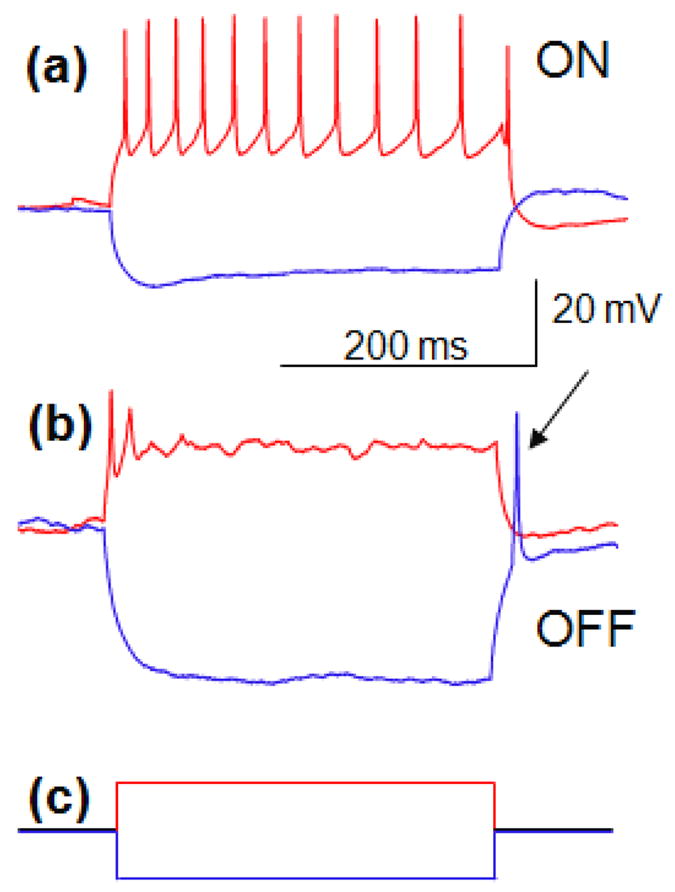
Response of RGCs to intracellular stimulation. (a) +100 pA current injected into ON cell for 300 ms elicits spiking during the pulse (red), while −100 pA current results in no spiking during and after the pulse (blue). (b) Injection of +100 pA of current into the OFF cell results in initial spiking (red), while −100 pA of current produces a rebound spike after the end of stimulus (blue, indicated by the arrow). (c) Cathodic (blue) and anodic (red) intracellular pulses injected.
Results
Three types of responses
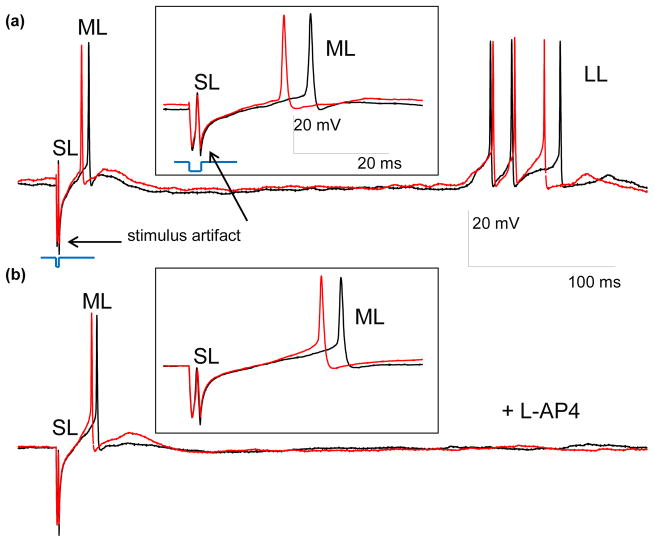
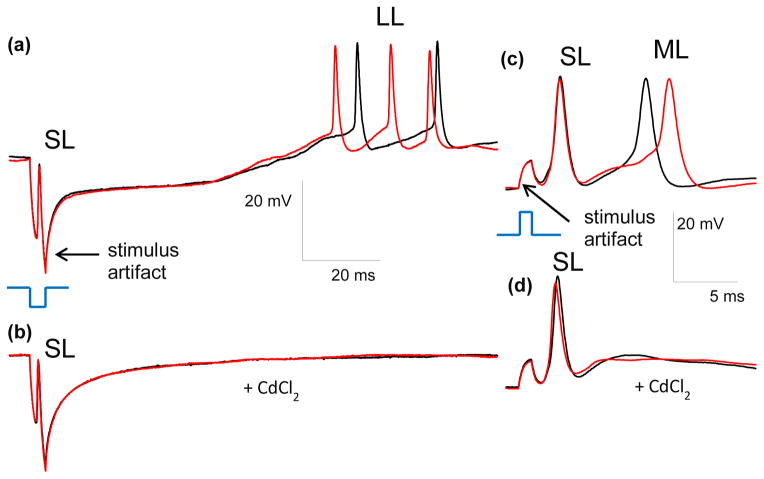
Time-locked RGC responses with latency in the 0.5–400 ms range were classified in three groups – short (SL), medium (ML) and long latency (LL). Some cells exhibited all three types of response (Figure 3(a)), while others had just two (Figure 4(a, c)) or one type, depending on electrode location, stimulus strength, duration and polarity. Addition of pharmacological agents was used to classify the responses. ML and LL responses disappeared upon addition of 100 μM of CdCl2, which blocks synaptic transmission (Sekirnjak et al. 2006, Tsai et al. 2009), while SL responses remained (Figure 4). This confirms that SL responses are elicited directly in RGCs, while ML and LL originate in the retinal network and are transmitted to RGCs via synaptic connections.
Figure 3.
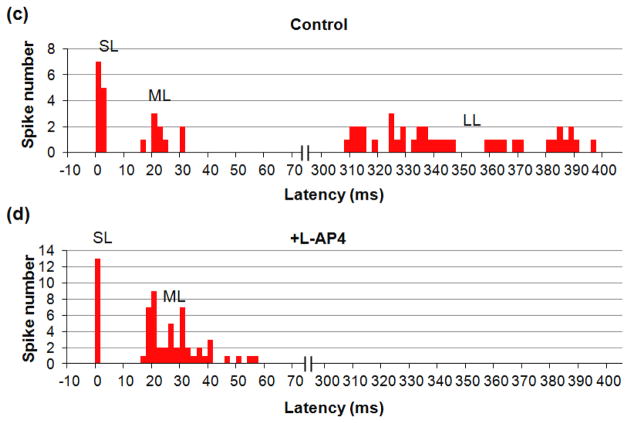
Traces illustrating three types of RGC responses to 2 ms, 10 μA cathodic stimuli with electrode located in OPL. (a) Two control traces including the stimulation artifact and the SL, ML and LL responses. (b) Two traces with L-AP4 blocker, demonstrating the SL and ML spiking, but no LL response. The insets show magnified view of the SL and ML responses. Stimulating pulses are shown in blue, and scale bars are the same for (a) and (b). (c) and (d) PSTH for 20 traces before (c) and after (d) L-AP4 application, with stimulus applied at 0 ms. No events were detected in the cut-out section of 70–300 ms.
Figure 4.
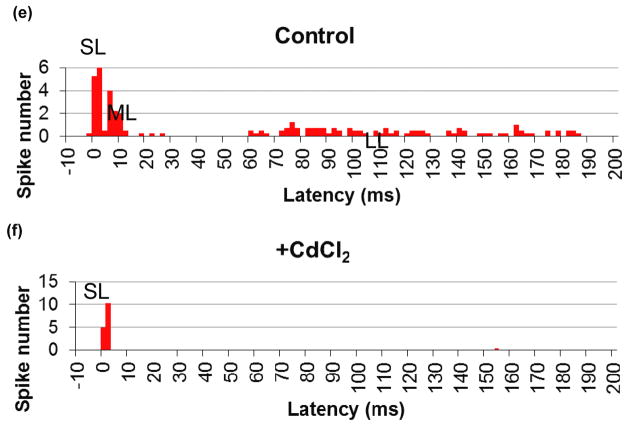
Effect of CdCl2 on stimulation. (a) The SL and LL responses of RGCs to 4 ms, 25 μA cathodic stimuli applied via subretinal electrode. (b) After addition of CdCl2 the LL responses disappear, while the SL remain. Stimulus is shown in blue, and scale bars are the same for (a) and (b). (c) SL and ML responses to anodic stimuli of 1 ms, 4 μA applied via electrode in OPL position. (d) After addition of CdCl2 the ML responses disappear, while the SL remain. Stimulus is shown in blue, and scale bars are the same for (c) and (d). (e) and (f) Disappearance of LL and ML, and preservation of SL response upon addition of CdCl2. PSTH represents 4 RGCs with 20 traces per cell.
LL responses in ON RGCs (N=7) disappeared upon addition of 100 μM of L-AP4, even with stimuli stronger than the original threshold, while ML and SL responses remained (Figure 3). Since L-AP4 blocks the metabotropic receptors (Pin and Duvoisin 1995) in synapses connecting photoreceptors to ON bipolar cells, disappearance of the LL spiking and preservation of ML firing is likely to indicate that LL responses originate in photoreceptors, while ML stimulation originates in the inner retinal neurons (bipolar, horizontal or amacrine cells). However, one cannot completely exclude a possibility that LL responses arise from the lateral spread of the electrical stimulation via horizontal and amacrine cells, which might also be affected by the L-AP4 blocker, either directly or via ON bipolar cells.
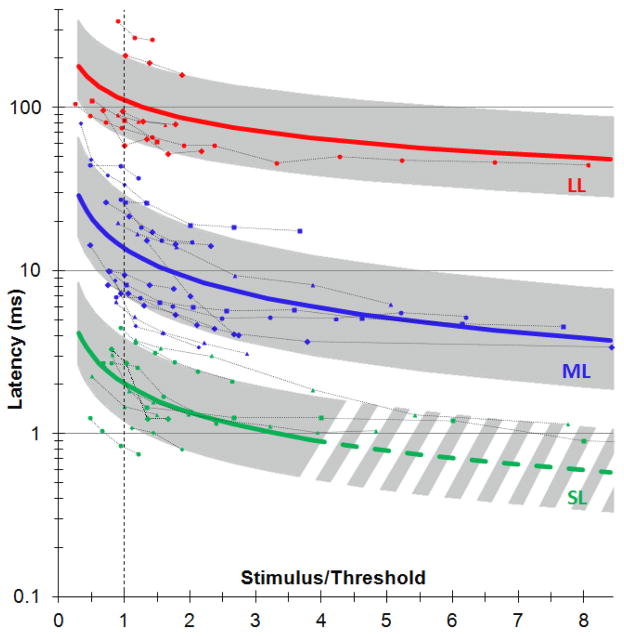
Latency of each type of response (SL, ML and LL) was measured as a function of the stimulus amplitude for 30 cells with little spontaneous activity, using stimulus durations of 0.5–4 ms for SL response and 0.2–10 ms for ML and LL responses. Figure 5 shows the minimum latency as a function of the ratio of the pulse amplitude to stimulation threshold, measured in 20 trials per cell for each stimulus settings. In cases of a burst response, latency of the first spike in the train was considered. For each cell, the data was then fitted with a power function and these fits were averaged for each type of response. In Figure 5, the average fit for each type of response is plotted as a solid line with the corresponding standard deviation shown as a shaded area. Since latencies could not be measured with high precision below 1 ms (especially for high stimulus strength), the trend line for direct response (SL) extrapolated below 1 ms is shown in dash. For all types of response the latencies decreased with increasing stimulus strength.
Figure 5.
Dependence of the RGC response latency on stimulus strength. Pulse amplitude is expressed as a ratio to stimulation threshold. For each response type, the average is plotted as a solid line, and standard deviation as a shaded area. Traces of individual cells (N=30) with different stimulation thresholds, pulse durations and electrode locations are shown with dash lines.
Strength-duration Relationship of the Stimulation Threshold
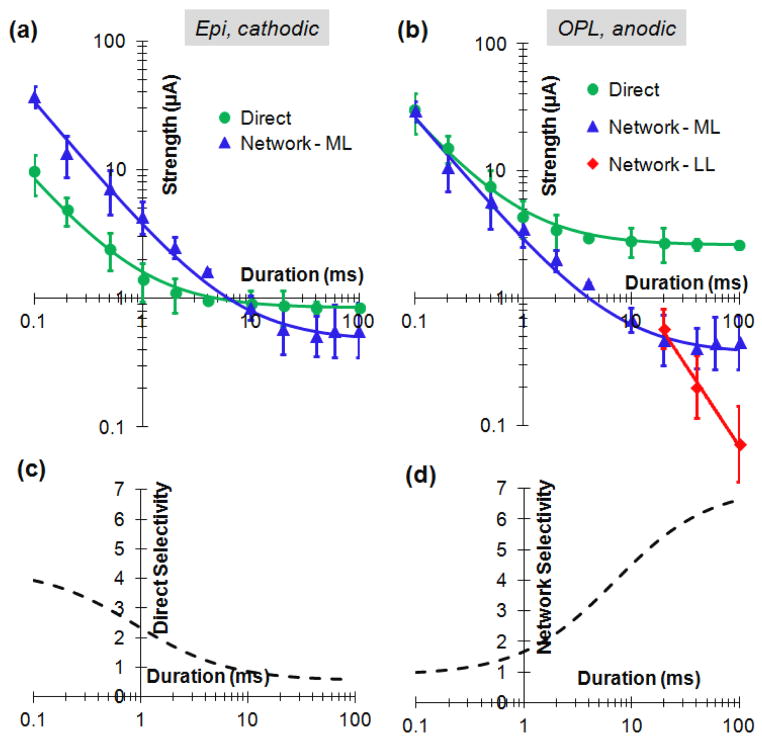
Stimulation thresholds strongly varied with pulse polarities, electrode location and type of the response, but the shape of the strength-duration (S-D) relationship for each type of response was independent of pulse polarity and electrode location. Thresholds were measured as a function of pulse duration for all 3 types of responses: direct (SL, N=17) and two types of network-mediated responses – ML (N=14) and LL (N=7). For averaging, the S-D relationship curve for each cell and stimulation condition was first normalized by its value at 4 ms, and then averaged among multiple cells. To restore absolute values of the S-D curves for each stimulation condition the geometrical average of the stimulation thresholds at 4 ms was calculated for each response type, pulse polarity and electrode location. Multiplying the normalized S-D curve by the average threshold at 4 ms restores the absolute thresholds for each stimulation condition, as shown in Figure 6(a, b).
Figure 6.
Strength-duration relationships of the network-mediated and direct responses. (a) epiretinal cathodic stimuli. Direct response curve was fitted with Weiss equation I = 0.85 (1 + 0.9/τ), and the network with I = 0.47 (1 + 7/τ). (b) S-D curves for OPL electrode and anodic pulse. Direct curve (SL) was fitted with I = 2.6 (1 + 0.9/τ), ML with I = 0.37 (1 + 7/τ), LL with I = 26 τ−1.3. (c) Selectivity for direct response to epiretinal cathodic pulse. D. Selectivity of the network response to anodic pulse applied via electrode in OPL.
Figure 6(a) shows the strength-duration relationships for epiretinal stimulation with cathodic pulses. The direct stimulation threshold exhibited chronaxy of about 1 ms (in agreement with previous measurements by Jensen et al. 2005), while the network (ML) threshold continued a constant-slope decrease with increasing pulse duration up to about 10 ms, and started approaching rheobase beyond that duration. Both strength-duration relationships were well approximated with the Weiss equation (solid lines in Figure 6).
Since the shape of the strength-duration curves is defined only by the type of stimulation (direct or network) and does not depend on pulse polarity and electrode location, it can be calculated for any other polarity and location by multiplying the epiretinal cathodic curves in Figure 6a by the ratio of the corresponding thresholds listed in Table 1. Figure 6(b) shows the strength-duration relationships for intraretinal (OPL) stimulation with anodic pulses. In this condition, the threshold of the network-mediated response was always lower than that of direct stimulation. LL response became dominant (had lowest threshold) at pulse durations exceeding 20 ms, and it continued a constant-slope decline with increasing pulse duration, at least up to 100 ms.
Table 1.
Thresholds of the direct and network-mediated (ML) responses with anodic and cathodic stimuli and electrodes located in epiretinal, IPL, OPL and subretinal positions. 0.5 ms pulses were used for targeting direct stimulation of RGCs: Optimum configuration for direct stimulation (epiretinal cathodic) is outlined with red. 4 ms pulses were used for targeting network-mediated stimulation in IPL, OPL and subretinal positions. Optimum configuration for network stimulation (OPL anodic) is outlined with red.
| 0.5 ms | 4 ms | |||||||||
|---|---|---|---|---|---|---|---|---|---|---|
|
| ||||||||||
| Epiretinal (μA) | IPL (μA) | IPL (μA) | OPL (μA) | Subretinal (μA) | ||||||
|
|
||||||||||
| Direct | Network | Direct | Network | Direct | Network | Direct | Network | Direct | Network | |
| Anodic | 10±5.6 | 21±12 | 7.6±3.9 | 14±8 | 3.0±1.5 | 3.2±1.8 | 3.0 ±1.8 | 1.3±0.6 | 4.0±1.7 | 2.9±1.8 |
| Cathodic | 2.4±1.4 | 7.2±4.3 | 5.3±3.1 | 8.2±5.4 | 2.1±1.2 | 1.9±1.2 | 4.0±1.9 | 3.2±2.1 | 23±11 | 25±13 |
Selectivity of Epi-, Sub- and Intra-retinal Stimulation
To elicit a specific type of response from RGC while avoiding another effect, the threshold of the desired effect should be lower than that of the undesired one. The span of stimuli strength between these thresholds (undesired to desired) represents the dynamic range for selective stimulation. Figure 6(c) depicts the ratio of the network and direct stimulation thresholds from the Figure 6a, illustrating how the direct selectivity increases with decreasing pulse duration for epiretinal cathodic stimuli.
Average stimulation thresholds for epiretinal (N=8) and IPL (N=11) positions with cathodic and anodic pulses of 0.5 ms in duration are shown in Figure 7(a) and in Table 1. For example, the threshold for direct response to epiretinal cathodic pulse was 2.4 μA, and for the network 7.2 μA, corresponding to direct selectivity of 3. Insertion of the electrode into IPL increased cathodic thresholds at 0.5 ms for both, the direct and network responses: to 5.3 and 8.2 μA, respectively, but decreased anodic thresholds: from 10 μA and 21 μA to 7.6 μA and 14 μA, respectively. Cathodic stimulus in epiretinal position had the highest direct selectivity at pulse durations of 0.5 ms and shorter (Figure 6(c) and Table 1).
Figure 7.

Thresholds of the direct and network-mediated (ML) responses with anodic and cathodic stimuli and electrodes located in epiretinal, IPL, OPL and subretinal positions. (a) Targeting direct stimulation of RGCs: Epiretinal and IPL thresholds for 0.5 ms pulses. Optimum configuration for direct stimulation – epiretinal cathodic – is outlined with red. (b) Targeting network-mediated stimulation: IPL, OPL and subretinal thresholds for 4 ms pulses. Optimum configuration for network stimulation – OPL anodic – is outlined with red.
Average stimulation thresholds for IPL (N=11), OPL (N=23) and subretinal (N=20) positions with cathodic and anodic pulses of 4ms are shown in Figure 7(b) and in Table 1. In subretinal placement, anodic pulses had lower thresholds (2.9 and 4.0 μA for the network and direct responses at 4 ms) than cathodic (25 and 23 μA), and the thresholds of the INL-mediated response (ML) to anodic pulses were lower than the direct (SL) ones. Upon electrode insertion into the OPL, the thresholds for both polarities decreased, and network selectivity improved: the direct threshold with anodic polarity became more than twice higher than that of the network with 4 ms pulses (Figure 7 and Table 1). OPL anodic stimulation provided the lowest threshold and the highest network selectivity among the 6 different configurations. Figure 6(d) depicts the ratio of the direct and network stimulation thresholds from the Figure 6(b), illustrating how the network selectivity increases with increasing pulse duration for OPL anodic stimuli.
Discussion
Disappearance of the medium (ML) and long (LL) latency responses and preservation of the short latency (SL) spiking upon addition of a universal synaptic blocker - CdCl2 demonstrated that ML and LL stimulation is mediated by the retinal network, while SL response results from the direct activation of RGCs.
The dominant effect of L-AP4 is the transmission blocking from photoreceptors to ON-bipolar cells by metabotropic (mGluR6) receptor blockade (Pin and Duvoisin 1995), and therefore disappearance of the LL response to electrical stimulation upon addition of L-AP4 is likely to indicate its origin in the photoreceptors. Additional evidence to that conclusion is based on the fact that stimulation thresholds of the LL responses become the lowest among retinal neurons at durations exceeding 20ms (Figure 6 (b)). This is in agreement with results from Freeman et al. (2010), demonstrating that photoreceptors had the lowest thresholds among retinal neurons stimulated by sinusoidal waveforms at low frequencies. However, a possibility that LL responses arise from the lateral spread of the electrical stimulation via horizontal and amacrine cells cannot be excluded, since it also might be affected by the L-AP4 blocker, either directly or via ON bipolar cells.
Lack of the L-AP4 blocker effect on ML response in ON RGCs reveals that this type of stimulation originates in the INL (bipolar, horizontal or amacrine cells). These conclusions are also in accordance with the fact that direct response latency is the shortest – not exceeding 5 ms, while the INL-mediated responses take 3–70ms, and photoreceptor-mediated bursting begins after 40 ms. In some borderline cases, with latencies in the range of 3–5 or 40–70ms, addition of the corresponding neurotransmitter blockers is required for accurate classification of the responses.
Similarly to the retinal and cortical responses to pulsed light (Levick 1973, Bolz et al. 1982, Connolly and Gruzelier 1982), latency of the RGC responses to electrical stimuli decreased with increasing stimulus strength, for all three types of responses (Figure 5). Latencies of the network-mediated stimulation were much closer to those of the natural light-induced response than direct stimulation.
This study confirmed that cathodic pulses delivered via epiretinal electrodes are optimal for direct stimulation of RGCs (Jensen et al. 2005): they have the lowest thresholds, and direct selectivity is highest at pulse durations below 0.5 ms. These properties of epiretinal stimulation have been already utilized in commercial epiretinal system ARGUS II (da Cruz et al. 2013). In practice however, placement of the electrode array in close and stable proximity to epiretinal surface turned out to be very challenging. Clinical results demonstrated that electrodes of the ARGUS II array were found at distances ranging from 0 to 400 μm from the retina, and stimulation thresholds increased with distance (Ahuja et al. 2013).
To stabilize the array and ensure close proximity to the target neurons, shallow insertion of the needle electrodes into the retina was proposed (Ganesan et al. 2010, Gefen 2012). Positioning of the electrodes inside IPL, however, increased the direct stimulation threshold and decreased direct selectivity by approximately a factor of 2, which might still be a better arrangement than much higher (up to a factor of 10) thresholds with electrodes floating far above the retina (Ahuja et al. 2013). Another potential benefit of the intraretinal placement is a possibility of avoiding axonal stimulation - one of the problems of the epiretinal prostheses resulting in arcuate visual perception (Nanduri et al. 2012). Since our patch-clamp recordings did not discriminate between the somatic and axonal stimulation of RGCs, this conjecture remains to be explored in the future.
On average, threshold of the direct epiretinal stimulation of RGCs with cathodic pulses was significantly lower than with anodic (p=0.003). This can be explained by much higher density of sodium ion-channels in axonal hillocks of RGCs than in other parts of the cell soma (Fried et al. 2009). Cathodic pulse applied via epiretinal electrode depolarizes the proximal part of the cell soma, including axonal hillock, resulting in reduced stimulation threshold compared to anodic pulse, which hyperpolarizes the proximal part of the cell (Boinagrov et al. 2012). Therefore, positioning the electrode below the RGC, in the IPL, decreases the anodic threshold and increases the cathodic threshold, compared to the epiretinal position. Higher density of ion-channels (activated at depolarization) at the axons of bipolar cells can similarly explain the lower cathodic than anodic thresholds for network response in epiretinal and IPL positions. For the same reasons in OPL and in subretinal position, the anodic pulses have lower thresholds than cathodic for the direct and network (ML) responses (see Figure 7 and Suppl. Table 1).
Network-mediated approach to retinal stimulation, generating a burst of ML spikes in response to a single stimulus, is best implemented with electrode placement in the outer retina, i.e. below the INL. Inside the OPL, anodic pulses have the lowest thresholds (1.3 μA at 4 ms), and network selectivity increases with pulse duration (Figure 6d), exceeding a factor of 5 at 20 ms. At pulse durations exceeding 20 ms, the LL response becomes dominant (i.e. has lowest threshold), although it is not clear whether this type of response will be present in degenerate retina (due to lack of photoreceptors). It is also important to keep in mind that photoreceptors above the subretinal implant disappear shortly after chronic implantation due to their separation from the retinal pigmented epithelium (RPE), so the OPL becomes the most realistic approximation of the electrodes location in-vivo, even with a wild-type retina (Mandel, 2013).
Diameter of subretinal electrode (40 μm) was much larger than the pipette used in the other three locations (4–8μm). However, this should not have any major effect on the stimulation thresholds since the distance to the target neurons – RGCs (~150 μm) and INL (~70μm) was several times larger than the radius of subretinal electrode (r=20 μm).
Stimulation thresholds vary from cell-to-cell very significantly, as can be seen from the large error bars in Figure 7. Factors contributing to this strong cell-to-cell variability may include differences in RGC size, morphology of its dendritic tree, as well as the extent of its network and its position relative to the stimulation electrode. Since previous studies of the direct stimulation thresholds (Tsai et.al. 2009, Cho et al. 2013) have found no significant difference between the stimulation thresholds of ON and OFF RGCs, they have not been separated in the S-D plots in the current study.
The current study utilized monopolar electrodes with large distant return, similar to the subretinal and epiretinal prostheses used in clinical trials (da Cruz et al. 2013, Stingl et al. 2013). However, bipolar electrodes with local returns may provide better confinement of electric field, and therefore may result in higher selectivity for both epiretinal and subretinal stimulation.
In clinical practice, the stimulation is performed with biphasic charge-balanced pulses. There is infinite number of ways to construct the second phase (different waveforms, durations, inter-pulse intervals, etc.), and different prosthetic systems implement various options. For example, our photovoltaic system (Mathieson 2012) has a nearly-square first phase, and a much longer exponential second phase with lower amplitude. Stimulation properties of this system are very well approximated by the square monophasic pulses of the current study. In the capacitor-coupled “push” generators the first phase is usually square, but the second phase has exponential falling edge. In the “push-pull” generators both phases can be square, but they can have different durations and delays between them. In this study we characterized the most basic pulse shape – a single phase rectangular waveform.
In conclusion, we demonstrated that epiretinal cathodic stimulation with pulse durations below 0.5 ms is optimal for eliciting direct response of RGCs while avoiding network-mediated spiking, as long as very close proximity to the retinal surface can be assured. Shallow (~30μm) insertion of the thin electrodes into the retina may help stabilize their positioning, but it increases stimulation thresholds and decreases direct selectivity by approximately a factor of 2. For network-mediated stimulation, the optimal position is in the OPL, with anodic pulses of long durations (>10 ms), providing the lowest threshold and highest network selectivity.
Supplementary Material
Acknowledgments
We thank Keith Mathieson and Lele Wang for their help with manufacturing the SIROF electrode arrays for subretinal stimulation, Roopa Dalal for retinal histology images. This project was supported by the NIH grant # R01EY018608, Stanford University Bio-X Research Grant, Air Force Office of Scientific Research Grant FA9550-10-1-0503.
Footnotes
Conflict of Interest: The authors declare no competing financial interests.
References
- Ahuja AK, Yeoh J, Dorn JD, Caspi A, Wuyyuru V, McMahon MJ, Humayun MS, Greenberg RJ, daCruz L Argus II Study Group. Factors affecting perceptual thresholds in Argus II retinal prosthesis subjects. Trans Vis Sci Tech. 2013;2(4):1. doi: 10.1167/tvst.2.4.1. [DOI] [PMC free article] [PubMed] [Google Scholar]
- Bendali A, Dubus E, Dégardin J, Lissorgues-Bazin G, Rousseau L, Djilas M, Bergonzo P, Benosman R, Picaud S, Sahel J-A. Retinal Prostheses: Diamond Biocompatibility And 3D Structure. ARVO Annual Meeting; 2012. [Google Scholar]
- Boinagrov D, Loudin J, Palanker D. Strength-duration relationship for extracellular neural stimulation: numerical and analytical models. J Neurophysiol. 2010;104(4):2236–48. doi: 10.1152/jn.00343.2010. [DOI] [PMC free article] [PubMed] [Google Scholar]
- Boinagrov D, Pangratz-Fuehrer S, Suh B, Mathieson K, Naik N, Palanker D. Upper threshold of extracellular neural stimulation. J Neurophysiol. 2012;108(12):3233–8. doi: 10.1152/jn.01058.2011. [DOI] [PMC free article] [PubMed] [Google Scholar]
- Bolz J, Rosner G, Wässle H. Response latency of brisk-sustained (X) and brisk-transient (Y) cells in the cat retina. J Physiol. 1982;328:171–90. doi: 10.1113/jphysiol.1982.sp014258. [DOI] [PMC free article] [PubMed] [Google Scholar]
- Butterwick A, Huie P, Jones BW, Marc RE, Marmor M, Palanker D. Effect of shape and coating of a subretinal prosthesis on its integration with the retina. Exp Eye Res. 2009;88(1):22–9. doi: 10.1016/j.exer.2008.09.018. [DOI] [PMC free article] [PubMed] [Google Scholar]
- Busskamp V, Duebel J, Balya D, Fradot M, Viney TJ, Siegert S, Groner AC, Cabuy E, Forster V, Seeliger M, Biel M, Humphries P, Paques M, Mohand-Said S, Trono D, Deisseroth K, Sahel JA, Picaud S, Roska B. Genetic reactivation of cone photoreceptors restores visual responses in retinitis pigmentosa. Science. 2010;329(5990):413–7. doi: 10.1126/science.1190897. [DOI] [PubMed] [Google Scholar]
- Busskamp V, Roska B. Optogenetic approaches to restoring visual function in retinitis pigmentosa. Curr Opin Neurobiol. 2011;21:942–946. doi: 10.1016/j.conb.2011.06.001. [DOI] [PubMed] [Google Scholar]
- Cho A, Sampath AP, Humayun MS, Weiland JD. Physiological Response of RD Mouse Retinal Ganglion Cells to Electrical Stimulation. ARVO Annual Meeting; 2013. [Google Scholar]
- Connolly JF, Gruzelier JH. Amplitude and latency changes in the visual evoked potential to different stimulus intensities. Psychophysiology. 1982;19(6):599–608. doi: 10.1111/j.1469-8986.1982.tb02510.x. [DOI] [PubMed] [Google Scholar]
- da Cruz L, Coley BF, Dorn J, Merlini F, Filley E, Christopher P, Chen FK, Wuyyuru V, Sahel J, Stanga P, Humayun M, Greenberg RJ, Dagnelie G for the Argus II Study Group. The Argus II epiretinal prosthesis system allows letter and word reading and long-term function in patients with profound vision loss. Brit J Ophthalmol. 2013 doi: 10.1136/bjophthalmol-2012-301525. [DOI] [PMC free article] [PubMed] [Google Scholar]
- Daiger SP, Bowne SJ, Sullivan LS. Perspective on genes and mutations causing retinitis pigmentosa. Arch Ophthalmol. 2007;125:151–158. doi: 10.1001/archopht.125.2.151. [DOI] [PMC free article] [PubMed] [Google Scholar]
- Eickenscheidt M, Jenkner M, Thewes R, Fromherz P, Zeck G. Electrical stimulation of retinal neurons in epiretinal and subretinal configuration using a multicapacitor array. J Neurophysiol. 2012;107(10):2742–55. doi: 10.1152/jn.00909.2011. [DOI] [PubMed] [Google Scholar]
- Enzmann V, Yolcu E, Kaplan HJ, Ildstad TS. Stem Cells as Tools in Regenerative Therapy for Retinal Degeneration. Arch Ophthalmol. 2009;127(4):563–571. doi: 10.1001/archophthalmol.2009.65. [DOI] [PMC free article] [PubMed] [Google Scholar]
- Ferris FL, 3rd, Fine SL, Hyman L. Age-related macular degeneration and blindness due to neovascular maculopathy. Arch Ophthalmol. 1984;102(11):1640–2. doi: 10.1001/archopht.1984.01040031330019. [DOI] [PubMed] [Google Scholar]
- Freeman DK, Eddington DK, Rizzo JF, Fried SI. Selective Activation of Neuronal Targets with Sinusoidal Electric Stimulation. J Neurophys. 2010;104(5):2778–91. doi: 10.1152/jn.00551.2010. [DOI] [PMC free article] [PubMed] [Google Scholar]
- Fried SI, Hsueh HA, Werblin FS. A Method for Generating Precise Temporal Patterns of Retinal Spiking Using Prosthetic Stimulation. J Neurophysiol. 2006;95:970–978. doi: 10.1152/jn.00849.2005. [DOI] [PubMed] [Google Scholar]
- Fried SI, Lasker ACW, Desai NJ, Eddington DK, Rizzo JF., 3rd Axonal Sodium-Channel Bands Shape the Response to Electric Stimulation in Retinal Ganglion Cells. J Neurophysiol. 2009;101:1972–1987. doi: 10.1152/jn.91081.2008. [DOI] [PMC free article] [PubMed] [Google Scholar]
- Fujikado T, Kamei M, Sakaguchi H, Kanda H, Morimoto T, Ikuno Y, Nishida K, Kishima H, Maruo T, Konoma K, Ozawa M, Nishida K. Testing of semichronically implanted retinal prosthesis by suprachoroidal-transretinal stimulation in patients with retinitis pigmentosa. Invest Ophth Vis Sci. 2011;52(7):4726–33. doi: 10.1167/iovs.10-6836. [DOI] [PubMed] [Google Scholar]
- Ganesan K, Stacey A, Meffin H, Lichter S, Greferath U, Fletcher EL, Prawer S. Diamond penetrating electrode array for epi-retinal prosthesis. Conf Proc IEEE Eng Med Biol Soc. 2010:6757–60. doi: 10.1109/IEMBS.2010.5626003. [DOI] [PubMed] [Google Scholar]
- Gefen R. Nano-retina project status. Conference presentation on 7th Biennial World Congress on Artificial Vision; Detroit, MI. 2012. [Google Scholar]
- Hadjinicolaou AE, Leung RT, Garrett DJ, Ganesan K, Fox K, Nayagam DAX, Shivdasani MN, Meffin H, Ibbotson MR, Prawer S, O’Brien BJ. Electrical stimulation of retinal ganglion cells with diamond and the development of an all diamond retinal prosthesis. Biomaterials. 2012;33:5812–5820. doi: 10.1016/j.biomaterials.2012.04.063. [DOI] [PubMed] [Google Scholar]
- Humayun MS, Dorn JD, da Cruz L, Dagnelie G, Sahel JA, Stanga PE, Cideciyan AV, Duncan JL, Eliott D, Filley E, Ho AC, Santos A, Safran AB, Arditi A, Del Priore LV, Greenberg RJ Argus II Study Group. Interim results from the international trial of Second Sight’s visual prosthesis. Ophthalmology. 2011;119(4):779–88. doi: 10.1016/j.ophtha.2011.09.028. [DOI] [PMC free article] [PubMed] [Google Scholar]
- Hottowy P, Skoczeń A, Gunning DE, Kachiguine S, Mathieson K, Sher A, Wiącek P, Litke AM, Dąbrowski W. Properties and application of a multichannel integrated circuit for low-artifact, patterned electrical stimulation of neural tissue. J Neural Eng. 2012;9(6):066005. doi: 10.1088/1741-2560/9/6/066005. [DOI] [PMC free article] [PubMed] [Google Scholar]
- Jensen R, Ziv O, Rizzo J., III Thresholds for Activation of Rabbit Retinal Ganglion Cells with Relatively Large, Extracellular Microelectrodes. Invest Ophth Vis Sci. 2005;46(4) doi: 10.1167/iovs.04-1018. [DOI] [PubMed] [Google Scholar]
- Jeon CJ, Strettoi E, Masland RH. The major cell populations of the mouse retina. J Neurosci. 1998;18(21):8936–46. doi: 10.1523/JNEUROSCI.18-21-08936.1998. [DOI] [PMC free article] [PubMed] [Google Scholar]
- Jones BW, Marc RE. Retinal remodeling during retinal degeneration. Exp Eye Res. 2005;81(2):123–37. doi: 10.1016/j.exer.2005.03.006. [DOI] [PubMed] [Google Scholar]
- Khraiche ML, Lo Y, Wang D, Cauwenberghs G, Freeman W, Silva GA. Ultra-high photosensitivity silicon nanophotonics for retinal prosthesis: electrical characteristics. Conf Proc IEEE Eng Med Biol Soc. 2011:2933–6. doi: 10.1109/IEMBS.2011.6090807. [DOI] [PubMed] [Google Scholar]
- Kim SY, Sadda S, Pearlman J, Humayun MS, de Juan E, Jr, Melia BM, Green WR. Morphometric analysis of the macula in eyes with disciform age-related macular degeneration. Retina. 2002;22(4):471–7. doi: 10.1097/00006982-200208000-00012. [DOI] [PubMed] [Google Scholar]
- Klauke S, Goertz M, Rein S, Hoehl D, Thomas U, Eckhorn R, Bremmer F, Wachtler T. Stimulation with a wireless intraocular epiretinal implant elicits visual percepts in blind humans. Invest Ophth Vis Sci. 2011;52(1):449–55. doi: 10.1167/iovs.09-4410. [DOI] [PubMed] [Google Scholar]
- Levick WR. Variation in the response latency of cat retinal ganglion cells. Vision Res. 1973;13(4):837–53. doi: 10.1016/0042-6989(73)90047-3. [DOI] [PubMed] [Google Scholar]
- Loudin JD, Simanovskii DM, Vijayraghavan K, Sramek CK, Butterwick AF, Huie P, McLean GY, Palanker DV. Optoelectronic retinal prosthesis: system design and performance. J Neural Eng. 2007:4S72–S84. doi: 10.1088/1741-2560/4/1/S09. [DOI] [PubMed] [Google Scholar]
- Margalit E, Thoreson WB. Inner retinal mechanisms engaged by retinal electrical stimulation. Invest Ophth Vis Sci. 2006;47(6):2606–12. doi: 10.1167/iovs.05-1093. [DOI] [PMC free article] [PubMed] [Google Scholar]
- Margolis DJ, Gartland AJ, Euler T, Detwiler PB. Dendritic calcium signaling in ON and OFF mouse retinal ganglion cells. J Neurosci. 2010;30(21):7127–38. doi: 10.1523/JNEUROSCI.5694-09.2010. [DOI] [PMC free article] [PubMed] [Google Scholar]
- Mandel Y, Goetz G, Lavinsky D, Huie P, Mathieson K, Wang K, Kamins T, Galambos L, Manivanh R, Harris J, Palanker D. Cortical responses elicited by photovoltaic subretinal prostheses exhibit similarities to visually evoked potentials. Nat Commun. 2013;4:1980. doi: 10.1038/ncomms2980. [DOI] [PMC free article] [PubMed] [Google Scholar]
- Mathieson K, Loudin J, Goetz G, Huie P, Wang L, Kamins TI, Galambos L, Smith R, Harris JS, Sher A, Palanker D. Photovoltaic retinal prosthesis with high pixel density. Nat Photonics. 2012;6:391–397. doi: 10.1038/nphoton.2012.104. [DOI] [PMC free article] [PubMed] [Google Scholar]
- Mazzoni F, Novelli E, Strettoi E. Retinal Ganglion Cells Survive and Maintain Normal Dendritic Morphology in a Mouse Model of Inherited Photoreceptor Degeneration. J Neurosci. 2008;28(52):14282–14292. doi: 10.1523/JNEUROSCI.4968-08.2008. [DOI] [PMC free article] [PubMed] [Google Scholar]
- Nanduri D, Fine I, Horsager A, Boynton GM, Humayun MS, Greenberg RJ, Weiland JD. Frequency and amplitude modulation have different effects on the percepts elicited by retinal stimulation. Invest Ophth Vis Sci. 2012;53(1):205–14. doi: 10.1167/iovs.11-8401. [DOI] [PMC free article] [PubMed] [Google Scholar]
- Palanker D, Huie P, Vankov A, Aramant R, Seiler M, Fishman H, Marmor M, Blumenkranz MS. Migration of Retinal Cells through a Perforated Membrane: Implications for a High-Resolution Prosthesis. Invest Ophth Vis Sci. 2004;45(9):3266–3270. doi: 10.1167/iovs.03-1327. [DOI] [PubMed] [Google Scholar]
- Palanker D, Vankov A, Huie P, Baccus S. Design of a high-resolution optoelectronic retinal prosthesis. J Neural Eng. 2005;2(1):S105–20. doi: 10.1088/1741-2560/2/1/012. [DOI] [PubMed] [Google Scholar]
- Phelan JK, Bok D. A brief review of retinitis pigmentosa and the identified retinitis pigmentosa genes. Mol Vis. 2000;6:116–124. [PubMed] [Google Scholar]
- Pin JP, Duvoisin R. The metabotropic glutamate receptors: structure and functions. Neuropharmacology. 1995 Jan;34(1):1–26. doi: 10.1016/0028-3908(94)00129-g. [DOI] [PubMed] [Google Scholar]
- Reutsky-Gefen I, Golan L, Farah N, Schejter A, Tsur L, Brosh I, Shoham S. Holographic optogenetic stimulation of patterned neuronal activity for vision restoration. Nat Commun. 2013;4:1509. doi: 10.1038/ncomms2500. [DOI] [PubMed] [Google Scholar]
- Polosukhina A, Litt J, Tochitsky I, Nemargut J, Sychev Y, De Kouchkovsky I, Huang T, Borges K, Trauner D, Van Gelder RN, Kramer RH. Photochemical restoration of visual responses in blind mice. Neuron. 2012;75(2):271–82. doi: 10.1016/j.neuron.2012.05.022. [DOI] [PMC free article] [PubMed] [Google Scholar]
- Rizzo JF, 3rd, Wyatt J, Humayun M, de Juan E, Liu W, Chow A, Eckmiller R, Zrenner E, Yagi T, Abrams G. Retinal prosthesis: an encouraging first decade with major challenges ahead. Ophthalmology. 2001;108(1):13–4. doi: 10.1016/s0161-6420(00)00430-9. [DOI] [PubMed] [Google Scholar]
- Sakmann B, Neher E. Patch Clamp Techniques for studying Ionic Channels in Excitable Membranes. Ann Rev Physiol. 1984;46:455–72. doi: 10.1146/annurev.ph.46.030184.002323. [DOI] [PubMed] [Google Scholar]
- Schraermeyer U, Thumann G, Luther T, Kociok N. Subretinally Transplanted Embryonic Stem Cells Rescue Photoreceptor Cells From Degeneration in the RCS Rats. Cell Transplant. 2001;10(8):673–680. [PubMed] [Google Scholar]
- Sekirnjak C, Hottowy P, Sher A, Dabrowski W, Litke AM, Chichilnisky EJ. Electrical Stimulation of Mammalian Retinal Ganglion Cells with Multielectrode Arrays. J Neurophysiol. 2006;95:3311–3327. doi: 10.1152/jn.01168.2005. [DOI] [PubMed] [Google Scholar]
- Stone JL, Barlow WE, Humayun MS, de Juan E, Milam AH. Morphometric Analysis of Macular Photoreceptors and Ganglion Cells in Retinas with Retinitis Pigmentosa. Arch Ophthalmol. 1992;110(11):1634–1639. doi: 10.1001/archopht.1992.01080230134038. [DOI] [PubMed] [Google Scholar]
- Stett A, Barth W, Weiss S, Haemmerle H, Zrenner E. Electrical multisite stimulation of the isolated chicken retina. Vision Research. 2000;40:1785–1795. doi: 10.1016/s0042-6989(00)00005-5. [DOI] [PubMed] [Google Scholar]
- Stingl K, Bartz-Schmidt KU, Besch D, Braun A, Bruckmann A, Gekeler F, Greppmaier U, Hipp S, Hörtdörfer G, Kernstock C, Koitschev A, Kusnyerik A, Sachs H, Schatz A, Stingl KT, Peters T, Wilhelm B, Zrenner E. Artificial vision with wirelessly powered subretinal electronic implant alpha-IMS. Proc R Soc B. 2013;280:20130077. doi: 10.1098/rspb.2013.0077. [DOI] [PMC free article] [PubMed] [Google Scholar]
- Tsai D, Morley JW, Gregg J, Suaning GJ, Lovell NH. Direct Activation and Temporal Response Properties of Rabbit Retinal Ganglion Cells Following Subretinal Stimulation. J Neurophysiol. 2009;102:2982–2993. doi: 10.1152/jn.00545.2009. [DOI] [PubMed] [Google Scholar]
- Weiland JD, Liu W, Humayun MS. Retinal prosthesis. Annu Rev Biomed Eng. 2005;7:361–401. doi: 10.1146/annurev.bioeng.7.060804.100435. [DOI] [PubMed] [Google Scholar]
- Zrenner E. Will retinal implants restore vision? Science. 2002;295(5557):1022–5. doi: 10.1126/science.1067996. [DOI] [PubMed] [Google Scholar]
Associated Data
This section collects any data citations, data availability statements, or supplementary materials included in this article.


