Abstract
Despite their tremendous contribution to biomedical research and diagnosis, conventional spatial sampling techniques such as wide-field, point scanning or selective plane illumination microscopy face inherent limiting trade-offs between spatial resolution, field-of-view, phototoxicity and recording speed. Several of these trade-offs are the result of spatial sampling with diffracting beams. Here, we introduce a new strategy for fluorescence imaging, SWIF, which instead encodes the axial profile of a sample in the Fourier domain. We demonstrate how this can be achieved with propagation-invariant illumination patterns that extend over several millimeters and robustly propagate through layers of varying refractive index. This enabled us to image a lateral field-of-view of 0.8 mm x 1.5 mm with an axial resolution of 2.4 µm – greatly exceeding the lateral field-of-view of conventional illumination techniques (~100 µm) at comparable resolution. Thus, SWIF allowed us to surpass the limitations of diffracting illumination beams and untangle lateral field-of-view from resolution.
OCIS codes: (110.0180) Microscopy, (110.2945) Illumination design, (110.6880) Three-dimensional image acquisition
Introduction
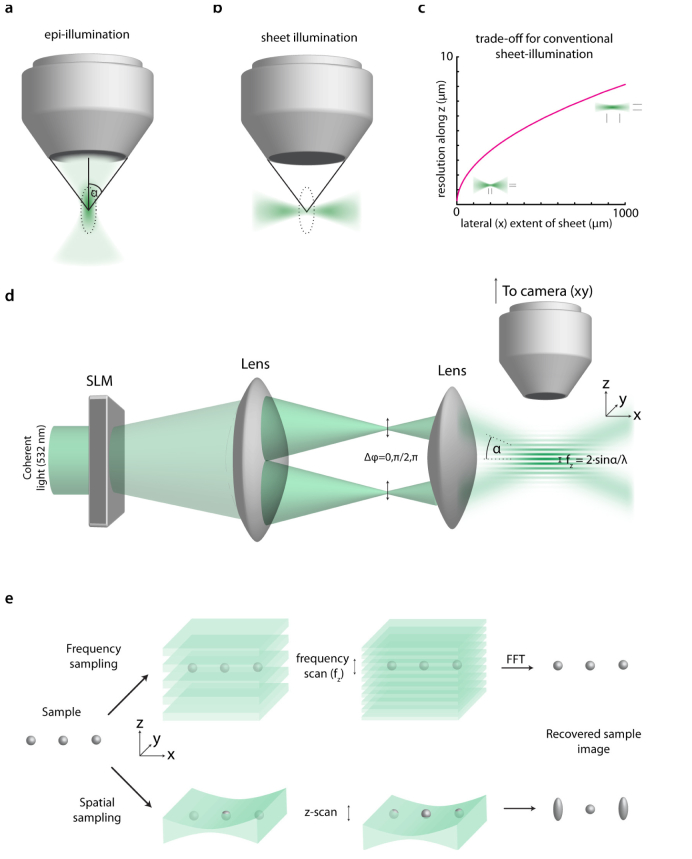
Epifluorescence imaging is one of the most widely adopted techniques in biomedical research. However, it suffers from poor axial resolution (Fig. 1(a)). Confocal laser scanning microscopy [1] attempts to overcome this problem by rejecting out of focus light – at the expense of increased illumination power and scanning time. Standing-wave fluorescence imaging (SWFI) is a wide field fluorescence imaging technique that was proposed as an alternative to confocal microscopy [2]: By interfering two laser beams and generating a high frequency standing wave patterns it promised higher axial resolution and shorter recording times than confocal microscopy. Yet, due to ambiguity along the axial dimension it was suited only for very thin samples with sub-µm features and could not be used in thick biological tissues.
Fig. 1.
Principle of SWIF: a: Schematic of conventional epifluorescence imaging, which suffers from poor axial resolution (hourglass-shaped and elongated focus along z). b: Sheet-illumination restricts the axial (z) extent of illumination. c: However, there is an inherent trade-off between sheet thickness and lateral extent of the sheet (here shown for Gaussian sheets). d: SWIF overcomes this limiting trade-off by encoding the axial profile of the sample in the spatial frequency-domain. Two collimated laser beams intersect at varying angles and generate a sinusoidal illumination profile (along the z-axis) with varying spatial frequency. e: Schematic of the difference between spatial sampling with diffracting sheets and Fourier-domain sampling with propagation-invariant illumination.
Selective plane illumination microscopy (SPIM), based on an idea originally proposed over a hundred years ago [3] (Fig. 1(b)), has recently received much renewed attention as a powerful method to study thick three dimensional biomedical samples [4–8]. By scanning a thin sheet of laser light across a sample (along the z-axis), SPIM-based techniques have achieved high recording speeds with a typical axial resolution on the scale of several micrometers. Despite the great promise that SPIM-based techniques hold for biomedical imaging, there is an inherent trade-off between the thickness of a sheet (the z-axial resolution of the sample) and its extent (which affects the lateral field of view: FOVx). Due to the laws of diffraction and Gaussian beam propagation, it is impossible to generate a sheet that maintains a thin profile over a large area (see Fig. 1(c)). Several key improvements to SPIM have been developed in the last decade – including two-photon excitation [9,10] and multi-view imaging [11–13] – but all approaches using Gaussian beams are bounded by the trade-off between sheet thickness and extent.
Non-diffracting self-healing beams [14], in particular Bessel beams [15,16], have been proposed as a way to extend the lateral field-of-view in sheet illumination. However, much of optical power resides in the undesired side-lobes of Bessel beams, resulting in excitation of unwanted out-of-focus fluorescence. The trade-off with the photodamage resulting from this unwanted excitation in turn limits the useful extent of Bessel beam illumination. Therefore, even when combined with two-photon excitation, Bessel beam based sheet microscopy has thus far only been demonstrated for short sheet lengths of a few tens of µm, resulting in small fields-of-view unless images are tiled at the expense of increased sample illumination and recording time [17,18]. The trade-off between axial resolution and lateral field-of-view is a result of spatial sampling with diffracting beams.
Here, we propose a way to overcome this limiting trade-off by a new technique termed axial Standing Wave Illumination Frequency-Domain (SWIF) imaging. Unlike other axial sectioning methods, SWIF employs propagation-invariant illumination patterns to directly measure the axial sample profile in the Fourier domain [19] rather than the spatial domain. This allows us to efficiently disentangle axial resolution and lateral field-of-view.
Results
Principles
Figure 1(d) illustrates the basic working principle of SWIF. It is based on the following idea: instead of trying to make one thin sheet extend over a large area, we create many parallel sheets. This is achieved by a planar interference pattern of two intersecting coherent laser beams (each of which is collimated), controlled by a spatial light modulator. In contrast to previous methods employing single planar sheets, such an interference pattern extends over the entire intersection volume of the beams, i.e. several cubic millimeters. Creating many parallel sheets in this manner means that multiple Z-planes of the sample are illuminated simultaneously. To avoid ambiguous depth information, the spatial frequency of the planes is swept from low to high by changing the angle and relative phase of the intersecting beams with the help of a spatial light modulator. This uniquely encodes the axial (z) profile of a sample in the frequency domain. By Fourier-transforming the pixel data recorded for different spatial frequencies, a Z-stack of the samples can be directly obtained.
For each spatial frequency f (along z) and phase φ, the 3D illumination pattern P can be described as , where f and z are Fourier-conjugate variables. The image If,φ recorded at the camera (in the XY plane) corresponds to the multiplication of an illumination pattern with the 3D sample fluorescence, integrated along z: , where S(x,y,z) is the 3D sample fluorescence as a function of location and Nf,φ is a noise term resulting from photon shot-noise. To encode the sample in the Fourier-domain, spatial frequencies are displayed in discrete intervals Δf from zero to the maximum frequency fmax, according to Δf = 1/h, where h is the demagnified height of the SLM at the sample. Each spatial frequency is displayed 3 times at phases to yield a complex-valued data set
| (1) |
where C(x,y,f) implicitly contains a complex-valued noise term (resulting from Nf,φ) whose amplitude can be approximated as constant across frequencies. This 3D data set is back-transformed into the spatial domain by discrete Fourier transform (DFT), yielding the reconstructed 3D sample function
| (2) |
Robustness of illumination pattern
While beams focused through layers of varying refractive index (e.g. coverslips) can suffer from significant aberrations, our illumination patterns are robust in such scenarios. As illustrated in Fig. 2, sheets maintain their spatial frequency and remain parallel, even though they are projected from air (refractive index n = 1), through quartz glass (n = 1.46) into an aqueous (hydrogel) solution (n = 1.33). This finding can be confirmed mathematically: first, we note that the period of the illumination pattern is a function of the half-angle α between the two beams: . With Snell’s law of refraction () we can write , thereby confirming that the spacing between the sheets does not change upon entering a perpendicular layer of different refractive index.
Fig. 2.
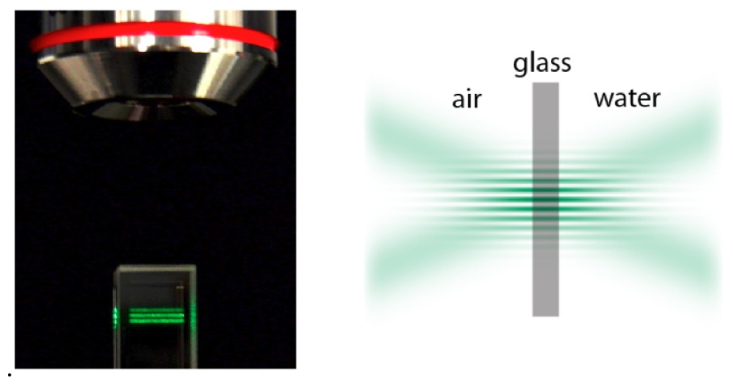
Robustness of illumination pattern: The SWIF illumination pattern extends over several mm and is robust against layers of varying refractive index (here illustrated by illuminating a hydrogel inside a 5 mm wide cuvette through 1 mm thick glass walls). Left: side-view (xz-plane) photographs, Right: schematic illustrating that the illumination pattern does not change as it crosses flat interfaces between media of different refractive indices (air-glass-water/hydrogel).
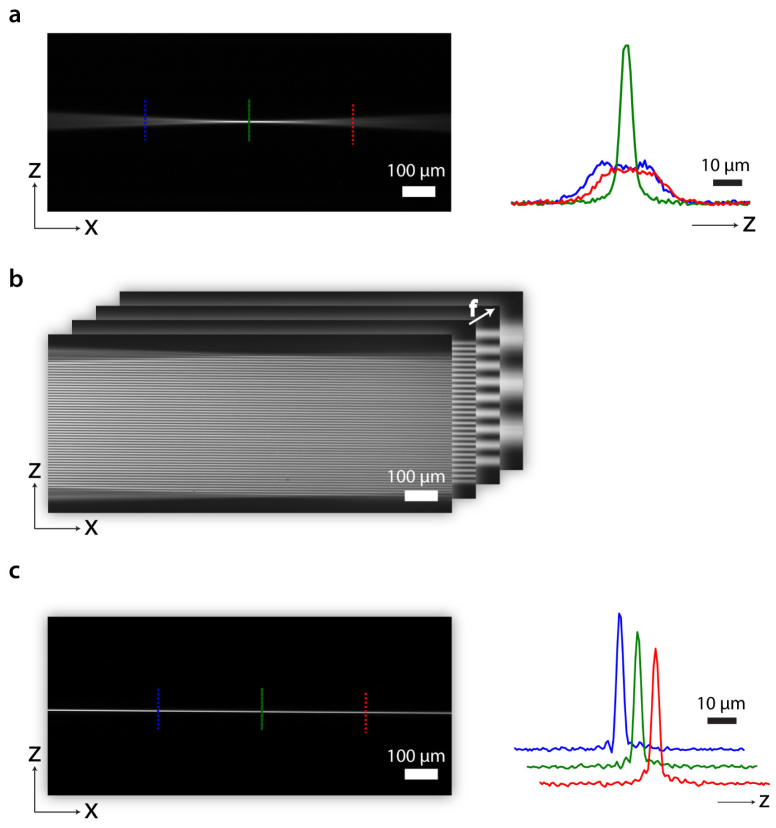
To further characterize the performance of our illumination scheme, we filled an open-top quartz-glass cuvette with fluorescent dye. We illuminated it along the x-axis while monitoring illumination patterns in the x-z plane (see coordinate system in Fig. 1(d) for reference). First, we focused a 0.1 NA beam into the cuvette (Fig. 3(a)).As expected, the waist of the hourglass-shaped beam was thinnest at the focus and became thicker with further distance from the focus. If used for sectioning, the useable field-of-view along the x-axis would be on the order of 100 µm. This is different for SWIF illumination: Fig. 3(b) shows several SWIF illumination patterns with different spatial frequencies. After displaying a full set of illumination frequencies ranging from 0 µm−1 to 0.25 µm−1 (Media 1 (3.7MB, AVI) ) and Fourier transforming the data set for each pixel (see Methods and Media 2 (6.4MB, AVI) ), we obtained sharp peaks whose position depended on the pixel’s position along the Z-axis (see Fig. 3(c)). Most notably, the sharpness of the peak did not depend on the position of the pixel along the x-axis. While these results were a first confirmation of the propagation invariance of the illumination patterns (along the x-direction) and of the location-independent resolution, the side-view observation through a thick glass layer prevented measurement of the SWIF peaks at high resolution (the optical resolution of our side-view setup was ~3 µm). A more direct measurement of SWIF resolution was required
Fig. 3.
Comparing illumination patterns: a: Fluorescence image of a Gaussian beam focussed into a cuvette containing the fluorophore Rhod-6G. Z-axis profiles at different locations along the beam (indicated by colored dotted lines on the left) are shown on the right. b: Illumination patterns obtained by frequency-swept standing wave illumination shown for 4 example spatial frequencies (stacked images). c: Fourier-transform (along the spatial frequency dimension) of the data set represented in b and profiles at different x-positions (right) traces are offset for clarity.
Resolution of SWIF
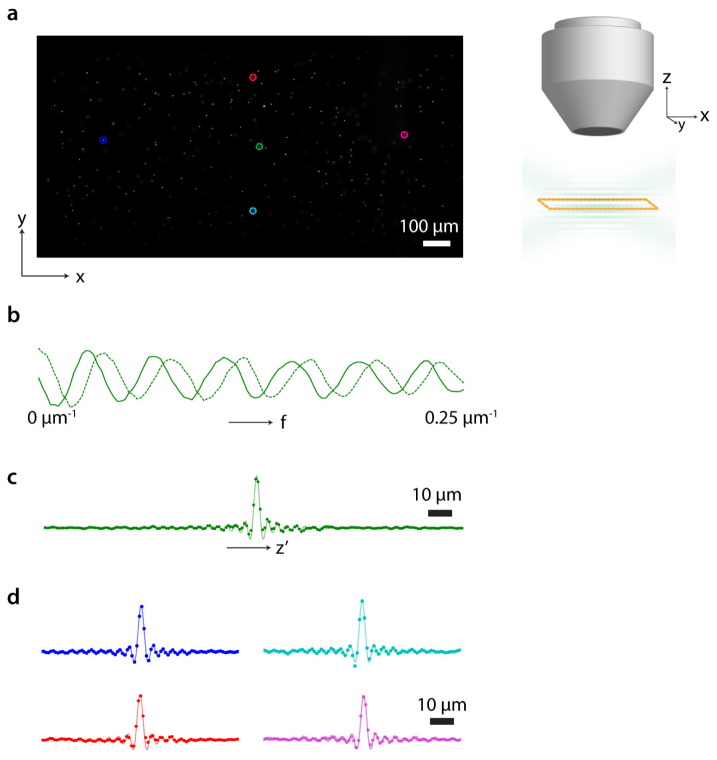
We experimentally determined the axial resolution of our SWIF setup by imaging 1 μm diameter agarose-embedded fluorescent beads in the x-y plane (Fig. 4(a)). As we swept the spatial frequency of the illumination patterns from low to high, the fluorescence intensity of individual beads oscillated sinusoidally (Fig. 4(b)) and the frequency of the oscillation depended on the location of the beads along the z-axis. Fourier-transforming this data set resulted in peaks corresponding to the z-axis profiles of the beads (Fig. 4(c)). Given the uniform sampling of frequencies up to fmax, theory predicts the profiles to be sinc functions. When we illuminated the sample with a series of illumination patterns up to a maximum spatial frequency of , the measured FWHM of the peaks was 2.4 µm. This is in close agreement with the theoretical prediction of a sinc FWHM of 0.6/fmax or . As shown in Fig. 4d, this resolution did not depend on the bead’s location within the illumination zone. The lateral (xy) resolution and imaging DOF were determined by the NA of the detection path microscope objective. We used a wide field-of-view, low magnification objective with an NA of 0.1, a lateral resolution of 2.7 µm and an imaging DOF of ~100 µm.
Fig. 4.
Quantifying axial resolution: a: Fluorescence image of 1 µm beads (0.8 mm x 1.6 mm). b: Real (solid) and imaginary (dotted) component calculated from the fluorescence signal (a.u.) of a bead (green circle in a) as the spatial frequency of illumination is swept from 0 to 0.25 µm-1. c: Fourier-transform of the signal in b, resulting in the axial profile of the bead with a point-spread function approximated by a sinc-function (fit). d: calculated axial profiles for the remaining indicated beads in a, illustrating the uniformity of illumination across a large field-of-view.
Imaging
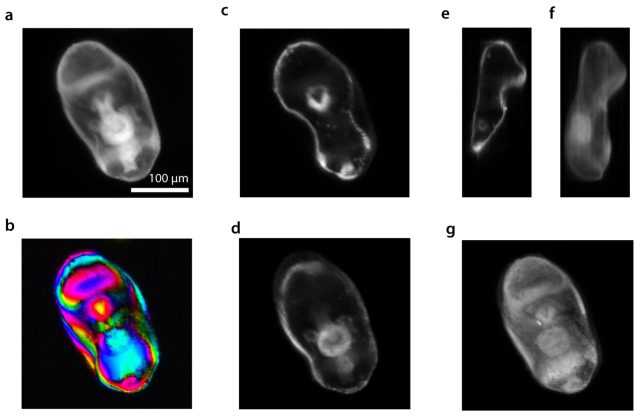
The optical sectioning capability of SWIF is illustrated in Fig. 5. We stained a starfish embryo with an orange fluorescent dye and illuminated it with a set of SWIF patterns (spatial frequency ranging from DC to ; see Media 3 (4.5MB, AVI) ). Fourier transforming this data set yielded a stack of optical sections of the embryo (Figs. 5(c)-5(d) and Media 4 (944.9KB, AVI) ). Because only Fourier components modulated by the illumination pattern were recorded, SWIF automatically rejected any background illumination or DC offset of the camera. This resulted in high-contrast sections, which were used for reconstruction of the starfish 3D structure (Fig. 5(g)).
Fig. 5.
Imaging a starfish embryo: a: Fluorescence image of a starfish embryo. b: complex-valued image (C(x,y,f) in Eq. (1)) obtained for one of the illumination spatial frequencies. The color of each pixel indicates the measured phase, the luminance the amplitude. c and d: starfish z-sections obtained by FFT using SWIF. e: side view of the same data set. f: projection along the X-axis. g: 3D rendering.
Discussion
In this work we presented a new imaging approach, SWIF, to achieve sectioning at consistently high axial resolution over a large field-of-view. In comparison to sheet illumination, SWIF overcomes the fundamental trade-off between sheet thickness (δz) and lateral extent of the sheet (FOVx) by encoding the axial profile of the sample in the Fourier domain. This enabled us to bypass the limits of conventional, diffracting illumination beams and disentangle axial resolution from lateral field-of-view.
The illumination patterns demonstrated in this paper extended over several mm2 and enabled an axial resolution of up to 2.4 µm. This combination of axial resolution and field-of-view is unmatched by other techniques – despite the fact that we only used a non-immersion air lens at comparably low NA for illumination. Given the demonstrated relationship between illumination pattern spatial frequency and axial resolution, higher NA illumination objectives could be used to achieve a theoretical resolution limit of 0.3 λ (better than the diffraction-limited resolution). All photons collected at the camera were used for the computation of the sections, and no photons needed to be rejected with a mask or discarded – avoiding excess sample illumination.
The maximum acquisition speed of SWIF in our experiment was limited by our SLM refresh rate to 30 camera frames per second. With faster SLMs, the acquisition rate could conceivably be increased to over one hundred sections per second. SWIF doesn’t necessarily require the use of SLMs and could employ other scanning strategies, such as galvanometers, as long as precise control over phase and angle of the interfering illumination beams is maintained.
Our results confirmed the prediction that illumination patterns are robust against layers of varying refractive index. While this enables imaging through cuvettes and glass tanks, it does not make SWIF immune against sample scattering. Like in conventional sheet microscopy, SWIF requires samples that are only mildly scattering, where the ballistic light component dominates.
The signal-to-noise ratio (SNR) of the complex-valued data set C(x,y,f) (Eq. (1), depends on a noise which is spatial-frequency independent, while the amplitude of the signal is a function of sample spatial frequency content. For sparsely labelled samples, which will typically have uniform spatial frequency content, the SNR will be uniform across illuminations. For samples with strong uniform background fluorescence (strong low-frequency content), the SNR will be lower at high frequencies. SWIF is thus best suited for more sparsely labelled samples, while imaging samples with high background can be optimized by using sensitive cameras with high dynamic range, by increasing the illumination intensity and by choosing a lower spatial frequency cut-off for illumination.
Owing to its use of spatial frequency-domain encoding, SWIF is conceptually related to previous work on Doppler encoded excitation patterns [19], which however employed Fourier sampling in the lateral sample dimensions rather than for axial sectioning. We further note the parallels between SWIF and spectral-domain optical coherence tomography (SD-OCT), which also encodes the axial sample profile in the Fourier domain [20–22]. In SWIF, the spatial Fourier space is used for encoding; in OCT, it is in the spectral Fourier space.
While offering high axial (z) resolution within the entire illumination volume, the present implementation of SWIF comes with a caveat: like in other microscopic techniques, the depth-of-field (DOF) at which the lateral (x-y) resolution is highest still depends on the NA of the detection objective lens. For typical large field-of-view, low-magnification microscope objectives (NA 0.1-0.2), it can be in the range of tens to 100 µm (2λ/NA2), with a lateral resolution of a few µm (λ/2NA). In other words, there is a trade-off between lateral resolution and imaging DOF. In applications where higher magnification, higher NA detection objective are desirable, objects taller than the DOF could then be imaged by mechanically moving the sample and tiling. In order to achieve higher DOF without tiling or mechanical motion, future work building on SWIF may employ focus-free imaging approaches in the detection path, such as wavefront coding with cubic phase plates [23,24] and light-field imaging techniques [25].
Methods
Optical setup
Spatially filtered, collimated 532 nm laser light (Excelsior 532 SM) was directed onto a reflective SLM (Holoeye Pluto, phase-only LCoS, 8 µm pixel size, 1080x1920 pixels). The SLM plane was imaged onto the sample plane via a 20x demagnification 4-f setup: the SLM projected two moving spots into the Fourier plane of a first, 500 mm achromatic lens (while its chromatic correction was not utilized, we chose it for its reduced monochromatic aberrations). This was achieved by dividing the SLM plane into vertical stripes (6 pixels wide) and interlacing two blazed gratings (for each of the two spots in the Fourier plane) by displaying them on every other stripe. This enabled independent control of the position, and relative phase, of the two spots. In order to reject the zero-order diffraction pattern of the SLM, a slit aperture was placed into the Fourier plane, which was also the Fourier plane of a second, 25 mm achromatic lens facing the sample. The sample was imaged from above via a custom infinity corrected microscope setup consisting of a microscope objective, an emission filter (Semrock 582/75), a 200 mm tube lens and a CCD camera (GX1920, Allied Vision Technologies). To visualize the illumination pattern from the side (Fig. 3), a 200 µm slit aperture was placed in front of the SLM to restrict illumination to one x-z plane and a custom microscope was installed to image the illuminated x-z plane through the side of the glass cuvette.
Illumination patterns and analysis
The two interlaced blazed gratings to be displayed on the phase SLM were calculated according to the piecewise function Φ SLM(py,pz) = 2π∙f/2∙py/1080 for py mod 12 < 6 and ΦSLM(py,pz) = −2π∙f/2∙py/1080 + φ otherwise (using the coordinate system established in Fig. 1: py being the horizontal and pz the vertical pixel coordinate of the 1920-by-1080 pixel phase SLM). We applied an additional constant tilt to the SLM display to be able to reject the zero order diffraction pattern by the slit.
We displayed 109 discrete frequencies on the SLM (which was demagnified 20x via the 4f system) resulting in the display of 0 to 108 vertical periods at the sample. The maximum vertical period corresponded to 10 SLM pixels (1080/108) or 4 µm at the sample (10 x 8 µm pixels, which were 20x demagnified).
With 109 frequencies displayed at 3 phase shifts, we recorded 3x10⁹ raw camera frames. These were processed into 109 complex-valued frames, according to the equation given in the principles section. This data set was zero-padded with an additional 108 frames, made conjugate symmetric along f (by mirroring and conjugating the data set along the zero frequency) and Fourier-transformed with an FFT algorithm (MATLAB, The Mathworks). For Fig. 5, the data set was multiplied with a Gaussian along f (FWHM = 2∙fmax) before Fourier-transforming – which increased the impulse-response FWHM from 2.4 µm to 2.8 µm.
Samples
For measurement of system resolution, we dispersed 1 µm orange fluorescent beads (Invitrogen) in 1% Agarose (Sigma, USA). To visualize the illumination patterns in the X-Z plane, we used 0.1% saturated Rhod 6G in 1% Agarose hydrogel. Starfish embryos were fixed and permeabilized in ethanol and stained with 5 µM SYTOX Orange (Invitrogen) before they were embedded in hydrogel.
Acknowledgments
We thank Ying-Min Wang, Roarke Horstmeyer and Phil Willems for valuable advice and for critically reading the manuscript. This work was supported by the National Institutes of Health (1DP2OD007307-01). Benjamin Judkewitz is a recipient of the Sir Henry Wellcome Postdoctoral Fellowship by the Wellcome Trust.
References and links
- 1.M. Minsky, “Microscopy Apparatus,” U.S. patent US 3013467 A (December 19, 1961).
- 2.Bailey B., Farkas D. L., Taylor D. L., Lanni F., “Enhancement of axial resolution in fluorescence microscopy by standing-wave excitation,” Nature 366(6450), 44–48 (1993). 10.1038/366044a0 [DOI] [PubMed] [Google Scholar]
- 3.Siedentopf H., Zsigmondy R., “Über Sichtbarmachung und Größenbestimmung ultramikoskopischer Teilchen, mit besonderer Anwendung auf Goldrubingläser,” Annalen der Physik 315(1), 1–39 (1902). 10.1002/andp.19023150102 [DOI] [Google Scholar]
- 4.Huisken J., Swoger J., Del Bene F., Wittbrodt J., Stelzer E. H. K., “Optical sectioning deep inside live embryos by selective plane illumination microscopy,” Science 305(5686), 1007–1009 (2004). 10.1126/science.1100035 [DOI] [PubMed] [Google Scholar]
- 5.Dodt H.-U., Leischner U., Schierloh A., Jährling N., Mauch C. P., Deininger K., Deussing J. M., Eder M., Zieglgänsberger W., Becker K., “Ultramicroscopy: three-dimensional visualization of neuronal networks in the whole mouse brain,” Nat. Methods 4(4), 331–336 (2007). 10.1038/nmeth1036 [DOI] [PubMed] [Google Scholar]
- 6.Keller P. J., Schmidt A. D., Wittbrodt J., Stelzer E. H. K., “Reconstruction of zebrafish early embryonic development by scanned light sheet microscopy,” Science 322(5904), 1065–1069 (2008). 10.1126/science.1162493 [DOI] [PubMed] [Google Scholar]
- 7.Huisken J., Stainier D. Y. R., “Selective plane illumination microscopy techniques in developmental biology,” Development 136(12), 1963–1975 (2009). 10.1242/dev.022426 [DOI] [PMC free article] [PubMed] [Google Scholar]
- 8.Mertz J., “Optical sectioning microscopy with planar or structured illumination,” Nat. Methods 8(10), 811–819 (2011). 10.1038/nmeth.1709 [DOI] [PubMed] [Google Scholar]
- 9.Palero J., Santos S. I. C. O., Artigas D., Loza-Alvarez P., “A simple scanless two-photon fluorescence microscope using selective plane illumination,” Opt. Express 18(8), 8491–8498 (2010). 10.1364/OE.18.008491 [DOI] [PubMed] [Google Scholar]
- 10.Truong T. V., Supatto W., Koos D. S., Choi J. M., Fraser S. E., “Deep and fast live imaging with two-photon scanned light-sheet microscopy,” Nat. Methods 8(9), 757–760 (2011). 10.1038/nmeth.1652 [DOI] [PubMed] [Google Scholar]
- 11.Huisken J., Stainier D. Y. R., “Even fluorescence excitation by multidirectional selective plane illumination microscopy (mSPIM),” Opt. Lett. 32(17), 2608–2610 (2007). 10.1364/OL.32.002608 [DOI] [PubMed] [Google Scholar]
- 12.Krzic U., Gunther S., Saunders T. E., Streichan S. J., Hufnagel L., “Multiview light-sheet microscope for rapid in toto imaging,” Nat. Methods 9(7), 730–733 (2012). 10.1038/nmeth.2064 [DOI] [PubMed] [Google Scholar]
- 13.Tomer R., Khairy K., Amat F., Keller P. J., “Quantitative high-speed imaging of entire developing embryos with simultaneous multiview light-sheet microscopy,” Nat. Methods 9(7), 755–763 (2012). 10.1038/nmeth.2062 [DOI] [PubMed] [Google Scholar]
- 14.Herman R. M., Wiggins T. A., “Production and uses of diffractionless beams,” JOSA A 8(6), 932–942 (1991). 10.1364/JOSAA.8.000932 [DOI] [Google Scholar]
- 15.Fahrbach F. O., Rohrbach A., “Propagation stability of self-reconstructing Bessel beams enables contrast-enhanced imaging in thick media,” Nat Commun 3, 632 (2012). 10.1038/ncomms1646 [DOI] [PubMed] [Google Scholar]
- 16.Fahrbach F. O., Simon P., Rohrbach A., “Microscopy with self-reconstructing beams,” Nat. Photonics 4(11), 780–785 (2010). 10.1038/nphoton.2010.204 [DOI] [Google Scholar]
- 17.Planchon T. A., Gao L., Milkie D. E., Davidson M. W., Galbraith J. A., Galbraith C. G., Betzig E., “Rapid three-dimensional isotropic imaging of living cells using Bessel beam plane illumination,” Nat. Methods 8(5), 417–423 (2011). 10.1038/nmeth.1586 [DOI] [PMC free article] [PubMed] [Google Scholar]
- 18.Gao L., Shao L., Higgins C. D., Poulton J. S., Peifer M., Davidson M. W., Wu X., Goldstein B., Betzig E., “Noninvasive imaging beyond the diffraction limit of 3D dynamics in thickly fluorescent specimens,” Cell 151(6), 1370–1385 (2012). 10.1016/j.cell.2012.10.008 [DOI] [PMC free article] [PubMed] [Google Scholar]
- 19.Feldkhun D., Wagner K. H., “Doppler encoded excitation pattern tomographic optical microscopy,” Appl. Opt. 49(34), H47–H63 (2010). 10.1364/AO.49.000H47 [DOI] [PubMed] [Google Scholar]
- 20.Fercher A. F., Hitzenberger C. K., Kamp G., El-Zaiat S. Y., “Measurement of intraocular distances by backscattering spectral interferometry,” Opt. Commun. 117(1-2), 43–48 (1995). 10.1016/0030-4018(95)00119-S [DOI] [Google Scholar]
- 21.Wojtkowski M., Leitgeb R., Kowalczyk A., Bajraszewski T., Fercher A. F., “In vivo human retinal imaging by Fourier domain optical coherence tomography,” J. Biomed. Opt. 7(3), 457–463 (2002). 10.1117/1.1482379 [DOI] [PubMed] [Google Scholar]
- 22.Choma M., Sarunic M., Yang C., Izatt J., “Sensitivity advantage of swept source and Fourier domain optical coherence tomography,” Opt. Express 11(18), 2183–2189 (2003). 10.1364/OE.11.002183 [DOI] [PubMed] [Google Scholar]
- 23.Dowski E. R., Jr, Cathey W. T., “Extended depth of field through wave-front coding,” Appl. Opt. 34(11), 1859–1866 (1995). 10.1364/AO.34.001859 [DOI] [PubMed] [Google Scholar]
- 24.Cathey W. T., Dowski E. R., “New paradigm for imaging systems,” Appl. Opt. 41(29), 6080–6092 (2002). 10.1364/AO.41.006080 [DOI] [PubMed] [Google Scholar]
- 25.Levoy M., Ng R., Adams A., Footer M., Horowitz M., “Light field microscopy,” Acm T Graphic 25(3), 924–934 (2006). 10.1145/1141911.1141976 [DOI] [Google Scholar]


