Abstract
We introduce a fast, simple, adaptive and experimentally robust method for reconstructing background-rejected optically-sectioned images using two-shot structured illumination microscopy. Our innovative data demodulation method needs two grid-illumination images mutually phase shifted by π (half a grid period) but precise phase displacement between two frames is not required. Upon frames subtraction the input pattern with increased grid modulation is obtained. The first demodulation stage comprises two-dimensional data processing based on the empirical mode decomposition for the object spatial frequency selection (noise reduction and bias term removal). The second stage consists in calculating high contrast image using the two-dimensional spiral Hilbert transform. Our algorithm effectiveness is compared with the results calculated for the same input data using structured-illumination (SIM) and HiLo microscopy methods. The input data were collected for studying highly scattering tissue samples in reflectance mode. Results of our approach compare very favorably with SIM and HiLo techniques.
OCIS codes: (170.0170) Medical optics and biotechnology, (170.3880) Medical and biological imaging, (170.6900) Three-dimensional microscopy, (170.2520) Fluorescence microscopy, (110.2650) Fringe analysis
1. Introduction
Non-invasive optical sectioning of images of thick biological tissues studied using fluorescence microscopy was the key objective of various techniques. The most powerful ones are confocal scanning microscopy (CSM), computational optical sectioning microscopy (COSM), multiphoton excitation, structured illumination microscopy (SIM), and light sheet microscopy (selective plane illumination microscopy, SPIM). They reviews and comparisons can be found, for example, in [1–4].
Confocal scanning microscopy is presently the most frequently used optical sectioning modality in fluorescence imaging. In its original form it combines scanned point source illumination and a pinhole detection. Several modifications aiming at the data acquisition rate enhancement such as spinning disk systems and programmable array microscopy (PAM) were subsequently proposed [5,6].
A scanning free alternative to confocal microscopy with much reduced experimental setup complexity is the structured-illumination technique proposed by Neil and associates [7]. It is based on the principle of attenuating all but the zero (DC) spatial frequencies with defocus. A modified microscope illumination part projects a single spatial frequency grid onto the object and at least three images with appropriate grid lateral displacement are recorded to determine, subsequently, the image modulation/contrast distribution. Namely, the phase shifting method for demodulating optical fringe patterns is used – in this application for the modulation distribution determination rather than, as in the majority of applications, for phase retrieval. As a wide-field technique SIM enables fast data acquisition; the ultimate image can be reconstructed from a few acquired frames. Main disadvantage of the structured illumination method is the necessity of conducting the acquisition of component frames with precise grid displacements and constant average intensity. Otherwise parasitic artifacts are generated in the processed image [8,9]. Several hardware and algorithmic modifications were introduced in last years to optimize the performance of SIM optical sectioning – see, for example [10–15], and references therein. The technique was implemented commercially by ZEISS, Thales Optem and Nikon.
Recently a technique called HiLo imaging was introduced [16–18]. It requires only a single grid illumination image and a single uniform illumination one. The advantage over SIM is no requirement of precise control of the grid phase. Additional concern has to be paid, however, to seamless transition from low to high frequencies (obtained from the two acquired images subjected to high-pass and low-pass filtering) in the synthesized final HiLo image. Some recent applications include, for example, wide-field two photon microscopy and cellular microrheology – see [19,20] and references therein.
In this paper we present innovative alternative to the two above mentioned techniques. It is characterized by simple experimental data acquisition and fast, adaptive data processing and analysis. Two phase-stepped grid illumination images are only required. Their precise mutual phase displacement is not needed although the brightest output and highest contrast is obtained for the phase shift of π [21–23]. Our algorithm comprises two-dimensional data processing based on the empirical mode decomposition of the two acquired images and the calculation of high contrast, optically sectioned output image using the spiral Hilbert transform. The results of our technique compare very well with the results of SIM and HiLo methods.
Confocal scanning microscopy and its modifications have limited acquisition rates. Although frame rates of over 100 Hz can be realized [24], new solutions are still under investigation, see for example [13] and references therein. We believe that our proposal is an innovative step in this direction.
2. Algorithm description
In the proposed algorithm two mutually phase-shifted grid illumination images are subtracted to form a bias and noise free pattern with increased grid amplitude modulation (in comparison with a single frame component; we refer to this pattern as an input pattern). The highest contrast outcome is obtained for two frames recorded in anti-phase (phase step equal to π). Nevertheless this is not a stringent requirement and our algorithm outcome is not strongly limited by the exact phase step value between the two component frames. This statement will be proven experimentally in the next section.
To obtain optically sectioned information we propose to perform amplitude demodulation of the input pattern applying the analytic signal by means of the Hilbert spiral transform. Analytic signal is a well-established 1D signal processing tool. Real part of the complex analytic signal (sA) is the signal under test with removed bias term (s) and the imaginary part is created using Hilbert transform (sH):
| (1) |
In our approach we use the 2D Hilbert transform extension by means of the spiral phase Hilbert transform [25,26]. Its superiority over other Hilbert transform 2D extensions has been proven in [27]. We denote the spiral phase method with HS (Hilbert spiral) [27]. The spiral phase function in Fourier domain is defined as:
| (2) |
and the 2D Hilbert transform (also referred to as a vortex transform) equivalent:
| (3) |
where β denotes local fringe orientation, F denotes Fourier transform, F−1 denotes inverse Fourier transform and (ξ1,ξ2) are the spectral domain coordinates. For amplitude demodulation the local fringe orientation map does not need to be calculated - we use the modulus of sH as
| (4) |
Presented formula follows from the fact that the Hilbert transform produces a quadrature component to the real value input pattern. Having two mutually π/2 phase-shifted signals constituting real and imaginary part of the complex analytic signal one can conveniently use the modulus to obtain the amplitude distribution.
Utilizing the Hilbert spiral transform one needs to provide bias free signal (pattern) to ensure accurate and meaningful quadrature component determination. Our input pattern obtained by subtracting two mutually phase-shifted grid images is free of the bias term. Because of a possibility of slight change of the background illumination between recording two grid images significant residual bias term can result, however. Employing the Hilbert spiral transform in this case will yield parasitic fringes in calculated amplitude modulation distribution [23]. To correct this error we propose to remove the residual bias term applying the fast and adaptive bidimensional empirical mode decomposition (FABEMD) method [28,29]. Prior to the HS amplitude demodulation the input pattern is decomposed into a set of bidimensional intrinsic mode functions (BIMFs) employing the FABEMD algorithm. First BIMF stores the majority of the input pattern high frequency noise to be avoided to increase the quality (signal to noise ratio) of optical sectioning. Few last BIMFs and the decomposition residue contain the low frequency part corresponding to the residual uneven bias term present in the input pattern. Discarding low-frequency components will increase the efficiency of the amplitude demodulation and remove artifacts from the modulation distribution.
The FABEMD algorithm is a two dimensional extension of the empirical mode decomposition (EMD) method. The 1D EMD extracts intrinsic mode functions (IMFs) from signal during so-called sifting process. It is adaptive and data-driven approach (unlike Fourier methods no predefined decomposition basis is used) firstly developed by Huang et al. in [30]. To efficiently process images the bidimensional EMD (BEMD) was proposed, which interpolates envelopes of the corresponding data extrema with functions such as bidimensional cubic splines [31,32] or radial based functions [33]. The practical impact of BEMD is limited by the calculation time lengthened by very costly 2D surface spline interpolation on the irregular extrema grid. To overcome this limitation FABEMD (Fast Adaptive BEMD) approach was proposed [28,29] in which the 2D envelope interpolation is replaced by nonlinear order-statistics-based filtering followed by smoothing operation. Beside significantly shortening the computation time, more accurate estimation of the BIMFs, representing image features at various spatial scales is obtained in many cases. For further computation time reduction the order-statistic filtration was implemented using the morphological operation of dilation [34] (in this work we use the FABEMD method implemented with gray-scale dilation filtering for 2D envelope generation). In last few years our group has successfully employed the FABEMD method for studying the moiré phenomenon [35,36], low quality fringe pattern adaptive enhancement [34,37], Bessel fringes contouring [23] and crossed fringe patterns processing [38].
The proposed FABEMD-HS algorithm can be summarized as follows.
-
1.
Two mutually phase shifted (phase step equal to π is preferable) grid patterns are recorded and subtracted to create input pattern.
-
2.
Input pattern is decomposed into a set of BIMFs using the FABEMD method. Noisy BIMF1 is neglected to increase the signal-to-noise ratio. Several last BIMFs including residue are discarded as well to remove the uneven bias term. (typically using FABEMD OSFW 2 algorithm [28,29] the band-pass filtered pattern is reconstructed using BIMF2-BIMF4).
-
3.
Band-pass filtered zero-mean-value input pattern is amplitude demodulated using the Hilbert spiral transform. Amplitude modulation distribution corresponds to optically sectioned image.
Structured illumination together with computational demodulation provides optical sectioning but the processing is nonlinear [15,39]. Taking the root-mean-square of the differences of images [7] is very simple but a nonlinear operation. The algorithm nonlinearity implies that the technique does not have a true optical transfer function (OTF). Optical sectioning is implemented because the bandwidth of the OTF drops sharply with defocus. Under further assumption of weak object phase variations (not a very realistic approach in many fluorescence microscopy investigations) an effective transfer function can be derived [15,39,40]. In the case of our algorithm the input pattern preparation (by subtracting two carrier phase shifted images) and its Hilbert transformation are linear processes but calculating the modulus of complex signal utilizing Eq. (4) is a nonlinear operation.
3. Experiments and data processing results
The schematic layout of the typical structured illumination microscopic system is shown in Fig. 1. A modified illumination system of the microscope projects a single spatial frequency grating pattern onto the object under test. The microscope images faithfully only that object part where the grating is in focus. As already mentioned in Introduction the conventional structured illumination technique requires acquisition of at least three images to reconstruct the layer image without illumination pattern [7–15]. The sine approximation algorithm to improve the ability to reconstruct the in-focus plane when the out-of-focus light is much greater in magnitude was presented in [10]. Its results compare very favorably with those obtained with a standard confocal microscope. In the following part of this paper we will utilize the data acquired for evaluating the sine approximation algorithm [10] to show the effectiveness of our FABEMD-HS based algorithm. Using the same data (512x512 pixels raw frames) the images reconstructed by conventional SIM, HiLo and our algorithm will be compared.
Fig. 1.

Layout of the typical SIM system [5].
Detailed description of the objects under study was presented in [10]. To demonstrate SIM performance in dense biological tissue, tissue phantoms containing multiple layers of epithelial cells with optical, morphologic and molecular properties representative of normal and precancerous squamous epithelial tissue were prepared. To enhance the reflectance signal from cells, phantoms were labeled with molecular-specific contrast agents for reflectance imaging.
Figure 2 presents imaging results for a phantom made of SiHa cervical cancer cells labeled with the anti-EGFR gold contrast agent [10]. Figures 2(a) and 2(b) show a conventional widefield reflectance microscope image and a structured illumination raw image. Figures 3(a), 3(b), and 3(c) show reconstructed optically-sectioned images obtained using conventional SIM technique (three mutually phase-shifted raw images), the HiLo method, and our FABEMD-HS algorithm, respectively. It can be readily noted that proposed algorithm provides results with higher contrast and more relevant information content.
Fig. 2.
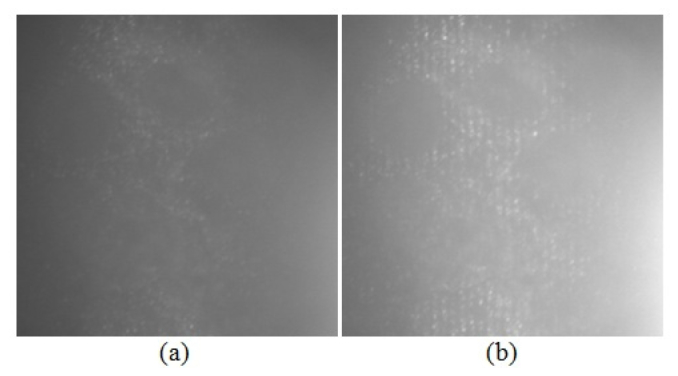
Images of phantoms containing SiHa cervical cancer cells labeled with anti-EGFR gold conjugates. The field of view is 54 x 54 μm2. The approximate depth of the imaged optical section is 15-20 μm below the phantom surface. Part (a) shows an inverted widefield reflectance microscope image, and part (b) shows a structured illumination raw image [10].
Fig. 3.
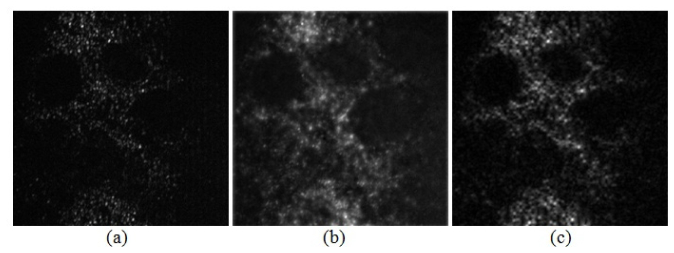
Reconstructed optically sectioned images using 3-frame SIM technique (a), HiLo microscopy (b), and our FABEMD-HS algorithm (c), respectively.
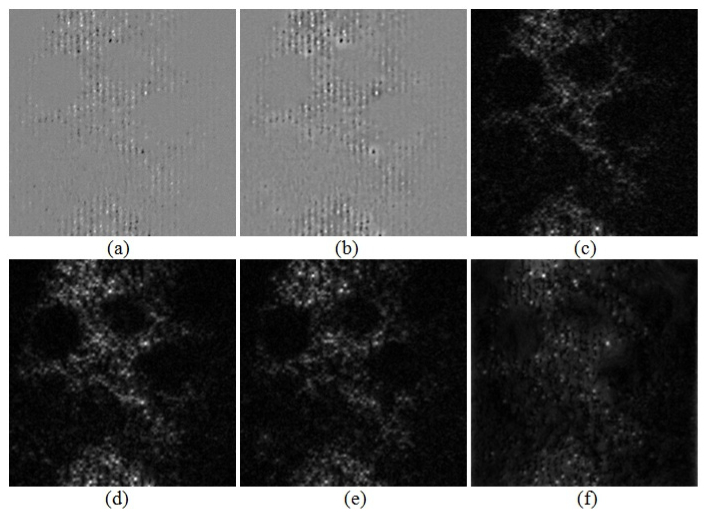
To provide additional insight into proposed algorithm we present the input pattern obtained subtracting two mutually π phase shifted grid patterns, Fig. 4(a), and the FABEMD band-pass filtered outcome, Fig. 4(b). Performing the Hilbert spiral transform amplitude demodulation of the latter pattern results in optically sectioned image, Fig. 3(c). To assess the influence of the phase shift between two grid patterns on the quality of the reconstructed optically sectioned image we present the FABEMD-HS results for grid patterns phase steps π/3, 2π/3, 4π/3 and 2π in Figs. 4(c)-4(f), respectively. Our two-shot algorithm exhibits excellent efficiency for all phase shifts beside one equal to 2π. Morphology of some fine structures changes, however. It can be attributed to local contrast variations caused by non-optimal phase-shift values between two raw images. In the worst case scenario we have component grid patterns in-phase, therefore upon subtraction we rather decrease the amplitude modulation depth without producing any additional benefits (beside removing common noise and bias term) - the outcome can be treated as the single frame processing result.
Fig. 4.
(a) Input pattern obtained subtracting two mutually π-phase shifted grid patterns, (b) input pattern after FABEMD adaptive band-pass filtering, (c)-(f) the FABEMD-HS results for reconstruction of optically sectioned images using two grid patterns phase-shifted by π/3, 2π/3, 4π/3 and 2π, respectively.
The reflectance from the colloidal gold particles can be seen at the cytoplasmic membrane of the SiHa cells which overexpress the EGF receptor. The characteristic “honeycomb” pattern revealed agrees well with previous results for this contrast agent using conventional confocal microscopy [10,41].
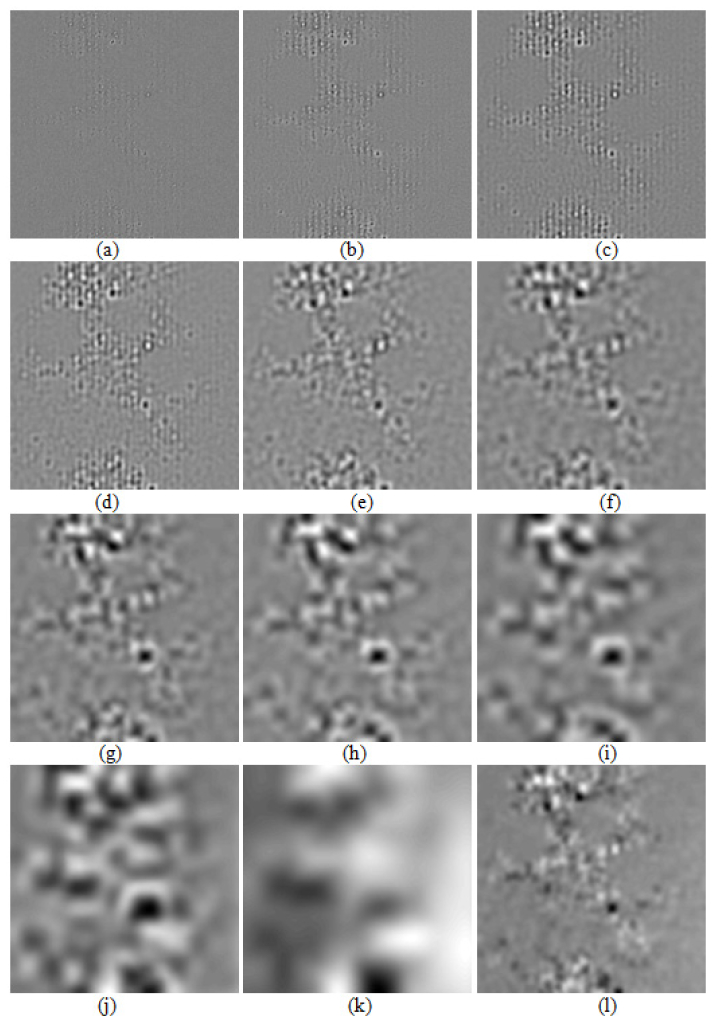
FABEMD band-pass filtering considerably influences the final outcome of the proposed algorithm. To clarify this important part of the proposed method we present in Fig. 5 the exemplifying set of BIMFs obtained decomposing initial pattern (4π/3 phase shift was chosen to emphasize the FABEMD filtration advantages). It can be readily noted that the structured illumination pattern is encountered in first four BIMFs. Therefore residual term to be neglected starts with BIMF5 and can be easily identified, Fig. 5(l), utilizing automatic Mutual Information Detrending algorithm proposed in [38]. Having defined the bias term we can remove it to enhance the optical-sectioning. The majority of the high frequency noise is stored in BIMF1, Fig. 5(a), hence its removal would increase the quality of the output pattern. This denoising approach is not designed to completely eliminate the noise but to reduce its high-frequency term easily isolated extracting BIMF1 in straightforward manner.
Fig. 5.
First ten BIMFs of the input pattern (two subtracted raw frames phase shifted by 4π/3) obtained employing the FABEMD OSFW2 algorithm (a)-(j), decomposition residue (k) and the low-frequency fringe free residual bias term defined as a sum of BIMF5-BIMF10 and the residue (l).
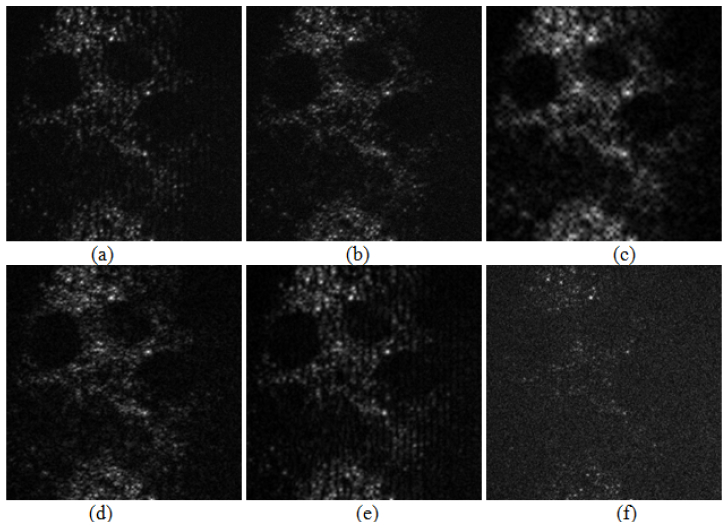
Figure 6 outlines the optically-sectioned images reconstructed employing different filtration strategies applied for the input pattern enhancement. Outcome obtained without FABEMD filtration is presented in Fig. 6(a). It is corrupted with parasitic modulation fringes and noise due to uneven bias term and residual noise preserved after two raw frames subtraction. Removing the bias term, Fig. 5(l), eliminates the parasitic modulation fringes, Fig. 6(b). Additional noise reduction neglecting BIMF1 provides the best outcome presented already in Fig. 4(e). In our algorithm we eliminate only first BIMF (identified as high frequency noise part) because discarding the information carrying BIMF2 leads to dramatic lost of resolution, Fig. 6(c). It is worthy to note that even in case of very low SNR in raw two frames BIMF2 will not contain only noise but useful information to be preserved. In Fig. 6(d) the modulation distribution of BIMF2 is shown. Its high contrast and morphological fine structure visibility corroborates the algorithm flexibility - no stringent requirements on selecting the sum of certain BIMFs (BIMF2, BIMF3 and BIMF4) for reconstruction applies. In Fig. 6(e) we present the optically-sectioned image reconstructed using input pattern with BIMF1 removed - noise reduction is readily noticeable with parasitic modulation fringes preserved (due to uneven bias term). To clarify that no valuable optically-sectioned information content is discarded due to the BIMF1 removal (high-frequency denoising) its modulation distribution is outlined in Fig. 6(f).
Fig. 6.
Optically sectioned images reconstructed using input pattern (a), sum of BIMF1-BIMF4 (b), sum of BIMF3 and BIMF4 (c), only BIMF2 (d), input pattern with BIMF1 removed (e) and only BIMF1 (f).
4. Discussion
Proposed technique needs around quarter of a second to complete calculations and reconstruct background-rejected optically-sectioned image from two mutually phase-shifted grid patterns. Comparing with the traditional three-frame SIM technique we need one frame less and no stringent requirements on the exact phase-shift between recorded frames are imposed. This feature makes the recording process simpler and the demodulation scheme more robust. Three-frame SIM algorithm can be characterized with very fast calculations (less than one second once images are recorded) but significant artifacts in modulation distribution are obtained in case of even slight phase-shift errors and the frame average intensity changes.
The HiLo algorithm employs spectral domain filtering of the uniform and grid projected patterns in order to obtain the high and low frequency in-focus images. The cut-off frequencies for high-pass and low-pass filtration need to be determined. Once the high and low frequency terms are calculated the optically-sectioned image is reconstructed as a sum of these component with the latter multiplied by the η factor to set its appropriate intensity range. The HiLo algorithm outcome is therefore strongly dependent on the set of parameters chosen manually by the operator (cut-off frequencies and η). Subjective qualitative evaluation of the optically-sectioned images (calculated using different set of parameters) in pursuit of the best fit for reconstruction will last significantly longer than one second. Moreover it would be a formidable task to state whether the obtained reconstruction is actually the best possible one. The proposed FABEMD-HS algorithm employs parameter-free image decomposition and amplitude demodulation. The result obtained depends on the phase shift between the two component frames (favorably π). In the previous section we noted that it is not a strong relation, however. Only for phase-shift values close to 2π the outcome quality drops drastically whilst maintaining satisfactory level for other phase-shift values (especially those near preferable π phase-shift).
Very short processing time required to efficiently demodulate the input pattern predestines the proposed FABEMD-HS method for real-time in-vivo studies. Current implementation completes full processing in 0.25s using medium class PC (Inter i7 2,1 GHz processor and 8 GB RAM). Simple modification employed to extract only two first BIMFs with fixed filter window size results in reduced computing time 0.11s. Therefore obtaining 8 frames per second processing rate (provided by the state-of-the-art commercial Nikon C2 + confocal system) can be achieved without resorting to advanced hardware solutions. Nevertheless further acceleration can be obtained using hardware like FPGA or CUDA to perform parallel processing for each pixel of the input pattern.
5. Conclusions
Optical-sectioning using two-shot structured illumination microscopy aided with Hilbert-Huang processing is proposed. Our novel method needs two grid-illumination images mutually phase shifted by π (precise phase displacement between frames is not required) to calculate upon subtraction the input pattern with increased grid modulation. The Hilbert-Huang processing for input pattern amplitude demodulation comprises (1) object spatial frequency selection (noise reduction and bias term removal) using the fast and adaptive bidimensional empirical mode decomposition method and (2) high contrast background-rejected optically-sectioned image calculation applying the two-dimensional spiral Hilbert transform. Proposed technique is simple, adaptive, fast and experimentally robust – its effectiveness very favorably compares with the results obtained employing structured-illumination (SIM) and HiLo microscopy methods. The raw input data used in this work for algorithm experimental evaluation were recorded studying highly scattering tissue samples in reflectance mode.
After completing this study we became aware of the paper by Wilson [42]. The author discusses the advantages of using a single spatial frequency for the structure of the illumination and the detection to enhance optical sectioning. The idea of possible practical embodiment with “detector” masks of complementary transmittance 1 + cos(νt) and 1 – cos(νt) (where ν is the spatial frequency) is proposed. Two images recorded using those masks are subtracted and the result corresponds to a mimicked detector mask of desired cos(νt) form. The solution proposed by us is based on a similar two-shot recording principle but its implementation is much simpler. We exploit widely used conventional structured illumination microscopy hardware with binary periodic lighting pattern. A single spatial frequency illuminating structure is effectively obtained by innovative application of the Hilbert-Huang processing algorithm.
Acknowledgments
We thank very much anonymous reviewers for their helpful comments. This work was supported by grants: NIH R21 EB 015022 (USA), DEC-2012/07/B/ST7/01392 (National Science Center, Poland), Diamond Grant (Ministry of Science and Higher Education budget funds for science in the years 2012-2015, Poland), statutory founds of Faculty of Mechatronics (Warsaw University of Technology, Poland), and the European Union in the framework of European Social Fund through the Warsaw University of Technology Development Programme.
References and links
- 1.Conchello J.-A., Lichtman J. W., “Optical sectioning microscopy,” Nat. Methods 2(12), 920–931 (2005). 10.1038/nmeth815 [DOI] [PubMed] [Google Scholar]
- 2.J. B. Pawley, ed., Handbook of Biological Confocal Microscopy (Springer, 2006). [Google Scholar]
- 3.T. S. Tkaczyk, Field Guide to Microscopy, SPIE Press (2010). [Google Scholar]
- 4.Krizek P., Hagen G. M., “Current optical sectioning systems in fluorescence microscopy,” Formatex Microscopy Book Series No 5(2), 826–8832 (2012). [Google Scholar]
- 5.T. Wilson and C. J. R. Sheppard, Theory and Practice of Scanning Optical Microscopy (Academic Press, 1984). [Google Scholar]
- 6.T. Wilson, ed., Confocal Microscopy (Academic Press, 1990). [Google Scholar]
- 7.Neil M. A. A., Juskaitis R., Wilson T., “Method of obtaining optical sectioning by using structured light in a conventional microscope,” Opt. Lett. 22(24), 1905–1907 (1997). 10.1364/OL.22.001905 [DOI] [PubMed] [Google Scholar]
- 8.Schaefer L. H., Schuster D., Schaffer J., “Structured illumination microscopy: artefact analysis and reduction utilizing a parameter optimization approach,” J. Microsc. 216(2), 165–174 (2004). 10.1111/j.0022-2720.2004.01411.x [DOI] [PubMed] [Google Scholar]
- 9.Patorski K., Styk A., “Interferogram intensity modulation calculations using temporal phase shifting: error analysis,” Opt. Eng. 45(8), 085602 (2006). 10.1117/1.2338595 [DOI] [Google Scholar]
- 10.Tkaczyk T. S., Rahman M., Mack V., Sokolov K., Rogers J. D., Richards-Kortum R., Descour M. R., “High resolution, molecular-specific, reflectance imaging in optically dense tissue phantoms with structured-illumination,” Opt. Express 12(16), 3745–3758 (2004). 10.1364/OPEX.12.003745 [DOI] [PubMed] [Google Scholar]
- 11.Chasles F., Dubertret B., Boccara A. C., “Optimization and characterization of a structured illumination microscope,” Opt. Express 15(24), 16130–16140 (2007). 10.1364/OE.15.016130 [DOI] [PubMed] [Google Scholar]
- 12.Bozinovic N., Ventalon C., Ford T., Mertz J., “Fluorescence endomicroscopy with structured illumination,” Opt. Express 16(11), 8016–8025 (2008). 10.1364/OE.16.008016 [DOI] [PubMed] [Google Scholar]
- 13.Wicker K., Heintzmann R., “Single-shot optical sectioning using polarization-coded structured illumination,” J. Opt. 12(8), 084010 (2010). 10.1088/2040-8978/12/8/084010 [DOI] [Google Scholar]
- 14.Choi H., Yew E. Y. S., Hallacoglu B., Fantini S., Sheppard C. J. R., So P. T. C., “Improvement of axial resolution and contrast in temporally focused widefield two-photon microscopy with structured light illumination,” Biomed. Opt. Express 4(7), 995–1005 (2013). 10.1364/BOE.4.000995 [DOI] [PMC free article] [PubMed] [Google Scholar]
- 15.Thomas B., Momany M., Kner P., “Optical sectioning structured illumination microscopy with enhanced sensitivity,” J. Opt. 15(9), 094004 (2013). 10.1088/2040-8978/15/9/094004 [DOI] [Google Scholar]
- 16.Lim D., Chu K. K., Mertz J., “Wide-field fluorescence sectioning with hybrid speckle and uniform-illumination microscopy,” Opt. Lett. 33(16), 1819–1821 (2008). 10.1364/OL.33.001819 [DOI] [PubMed] [Google Scholar]
- 17.Santos S., Chu K. K., Lim D., Bozinovic N., Ford T. N., Hourtoule C., Bartoo A. C., Singh S. K., Mertz J., “Optically sectioned fluorescence endomicroscopy with hybrid-illumination imaging through a flexible fiber bundle,” J. Biomed. Opt. 14(3), 030502 (2009). 10.1117/1.3130266 [DOI] [PubMed] [Google Scholar]
- 18.Mertz J., Kim J., “Scanning light-sheet microscopy in the whole mouse brain with HiLo background rejection,” J. Biomed. Opt. 15(1), 016027 (2010). 10.1117/1.3324890 [DOI] [PMC free article] [PubMed] [Google Scholar]
- 19.Yew E. Y. S., Choi H., Kim D., So P. T. C., “Wide-field two-photon microscopy with temporal focusing and HiLo background rejection,” Proc. SPIE 7903, 79031O (2011). 10.1117/12.876068 [DOI] [Google Scholar]
- 20.Michaelson J., Choi H., So P., Huang H., “Depth-resolved cellular microrheology using HiLo microscopy,” Biomed. Opt. Express 3(6), 1241–1255 (2012). 10.1364/BOE.3.001241 [DOI] [PMC free article] [PubMed] [Google Scholar]
- 21.Na J., Choi W. J., Choi E. S., Ryu S. Y., Lee B. H., “Image restoration method based on Hilbert transform for full-field optical coherence tomography,” Appl. Opt. 47(3), 459–466 (2008). 10.1364/AO.47.000459 [DOI] [PubMed] [Google Scholar]
- 22.Hrebesh M. S., “Full-field and single shot full-field optical coherence tomography: a novel technique for biomedical imaging applications,” Adv. Opt. Technol. 2012, 435408 (2012). [Google Scholar]
- 23.Patorski K., Trusiak M., “Highly contrasted Bessel fringe minima visualization for time-averaged vibration profilometry using Hilbert transform two-frame processing,” Opt. Express 21(14), 16863–16881 (2013). 10.1364/OE.21.016863 [DOI] [PubMed] [Google Scholar]
- 24.Im K. B., Han S., Park H., Kim D., Kim B.-M., “Simple high-speed confocal line-scanning microscope,” Opt. Express 13(13), 5151–5156 (2005). 10.1364/OPEX.13.005151 [DOI] [PubMed] [Google Scholar]
- 25.Larkin K. G., Bone D. J., Oldfield M. A., “Natural demodulation of two-dimensional fringe patterns. I. General background of the spiral phase quadrature transform,” J. Opt. Soc. Am. A 18(8), 1862–1870 (2001). 10.1364/JOSAA.18.001862 [DOI] [PubMed] [Google Scholar]
- 26.Larkin K. G., Bone D. J., Olfield M. A., “Natural demodulation of two-dimensional fringe patterns. II. Stationary phase analysis of the spiral phase quadrature transform,” J. Opt. Soc. Am. A 18(8), 1871–1881 (2001). 10.1364/JOSAA.18.001871 [DOI] [PubMed] [Google Scholar]
- 27.Wielgus M., Patorski K., “Evaluation of amplitude encoded fringe patterns using the bidimensional empirical mode decomposition and the 2D Hilbert transform generalizations,” Appl. Opt. 50(28), 5513–5523 (2011). 10.1364/AO.50.005513 [DOI] [PubMed] [Google Scholar]
- 28.S. M. A. Bhuiyan, R. R. Adhami, and J. F. Khan, “A novel approach of fast and adaptive bidimensional empirical mode decomposition,” in Proceedings of IEEE International Conference on Acoustic, Speech and Signal Processing (Institute of Electrical and Electronics Engineers, 2008), pp. 1313–1316. 10.1109/ICASSP.2008.4517859 [DOI] [Google Scholar]
- 29.S. M. A. Bhuiyan, R. R. Adhami, and J. F. Khan, “Fast and adaptive bidimensional empirical mode decomposition using order-statistics filter based envelope estimation,” EURASIP J. Adv. Signal Proc., ID728356(164), 1–18 (2008). 10.1155/2008/728356 [DOI] [Google Scholar]
- 30.Huang N. E., Sheng Z., Long S. R., Wu M. C., Shih W. H., Zeng Q., Yen N. C., Tung C. C., Liu H. H., “The empirical mode decomposition and the Hilbert spectrum for non-linear and non-stationary time series analysis,” Proc. R. Soc. Lond. A 454(1971), 903–995 (1998). 10.1098/rspa.1998.0193 [DOI] [Google Scholar]
- 31.Damerval C., Meignen S., Perrier V., “A fast algorithm for bidimensional EMD,” IEEE Signal Process. Lett. 12(10), 701–704 (2005). 10.1109/LSP.2005.855548 [DOI] [Google Scholar]
- 32.Barber C., Dobkins D., Huhdanpaa H., “The quickhull algorithm for convex hulls,” ACM Trans. Math. Softw. 22(4), 469–483 (1996). 10.1145/235815.235821 [DOI] [Google Scholar]
- 33.Nunes J. C., Bouaoune Y., Delechelle E., Niang O., Bunel Ph., “Image analysis by bidimensional empirical mode decomposition,” Image Vis. Comput. 21(12), 1019–1026 (2003). 10.1016/S0262-8856(03)00094-5 [DOI] [Google Scholar]
- 34.Trusiak M., Wielgus M., Patorski K., “Advanced processing of optical fringe patterns by automated selective reconstruction and enhanced fast empirical mode decomposition,” Opt. Lasers Eng. 52(1), 230–240 (2014). 10.1016/j.optlaseng.2013.06.003 [DOI] [Google Scholar]
- 35.Patorski K., Pokorski K., Trusiak M., “Fourier domain interpretation of real and pseudo-moiré phenomena,” Opt. Express 19(27), 26065–26078 (2011). 10.1364/OE.19.026065 [DOI] [PubMed] [Google Scholar]
- 36.M. Trusiak and K. Patorski, “Space domain interpetation of incoherent moiré superimpositions using FABEMD,” Proc. SPIE 8697, 18th Czech-Polish-Slovak Optical Conference on Wave and Quantum Aspects of Contemporary Optics, 869704 (December 18, 2012). 10.1117/12.2005907 [DOI] [Google Scholar]
- 37.Trusiak M., Patorski K., Wielgus M., “Adaptive enhancement of optical fringe patterns by selective reconstruction using FABEMD algorithm and Hilbert spiral transform,” Opt. Express 20(21), 23463–23479 (2012). 10.1364/OE.20.023463 [DOI] [PubMed] [Google Scholar]
- 38.Trusiak M., Patorski K., Pokorski K., “Hilbert-Huang processing for single-exposure two-dimensional grating interferometry,” Opt. Express 21(23), 28359–28379 (2013). 10.1364/OE.21.028359 [DOI] [PubMed] [Google Scholar]
- 39.Karadaglić D., Wilson T., “Image formation in structured illumination wide-field fluorescence microscopy,” Micron 39(7), 808–818 (2008). 10.1016/j.micron.2008.01.017 [DOI] [PubMed] [Google Scholar]
- 40.Hagen N., Gao L., Tkaczyk T. S., “Quantitative sectioning and noise analysis for structured illumination microscopy,” Opt. Express 20(1), 403–413 (2012). 10.1364/OE.20.000403 [DOI] [PMC free article] [PubMed] [Google Scholar]
- 41.Sokolov K., Follen M., Aaron J., Pavlova I., Malpica A., Lotan R., Richards-Kortum R., “Real time vital imaging of pre-cancer using anti-EGFR antibodies conjugated to gold nanoparticles,” Cancer Res. 63(9), 1999–2004 (2003). [PubMed] [Google Scholar]
- 42.Wilson T., “Optical sectioning in fluorescence microscopy,” J. Microsc. 242(2), 111–116 (2011). 10.1111/j.1365-2818.2010.03457.x [DOI] [PubMed] [Google Scholar]


