Abstract
Laser Speckle Rheology (LSR) is an optical technique to evaluate the viscoelastic properties by analyzing the temporal fluctuations of backscattered speckle patterns. Variations of optical absorption and reduced scattering coefficients further modulate speckle fluctuations, posing a critical challenge for quantitative evaluation of viscoelasticity. We compare and contrast two different approaches applicable for correcting and isolating the collective influence of absorption and scattering, to accurately measure mechanical properties. Our results indicate that the numerical approach of Monte-Carlo ray tracing (MCRT) reliably compensates for any arbitrary optical variations. When scattering dominates absorption, yet absorption is non-negligible, diffusing wave spectroscopy (DWS) formalisms perform similar to MCRT, superseding other analytical compensation approaches such as Telegrapher equation. The computational convenience of DWS greatly simplifies the extraction of viscoelastic properties from LSR measurements in a number of chemical, industrial, and biomedical applications.
OCIS codes: (300.1030) Absorption, (290.1990) Diffusion, (170.3660) Light propagation in tissues, (170.3880) Medical and biological imaging, (290.4210) Multiple scattering, (110.6150) Speckle imaging
1. Introduction
Laser Speckle Rheology (LSR), an optical approach for the non-contact evaluation of the viscoelastic properties of the materials, has a number of industrial, chemical and biomedical applications related to material sciences, polymer engineering, food sciences, and clinical diagnosis [1–11]. The customary tool for measuring the viscoelastic properties is a mechanical rheometer, which evaluates the ratio of an applied oscillatory stress to the consequential strain in the specimen, over a limited oscillation frequency range to calculate the frequency-dependent viscoelastic modulus, G*(ω). The capability of LSR for measuring this quantity in a non-destructive/non-contact manner from the speckle fluctuations is appealing, particularly in applications where mechanical manipulation may alter the sample properties and in cases where only small sample volumes are available for measurement [1–11]. In LSR, a small volume of the sample is illuminated by a mono-chromatic laser source and a high-speed CMOS camera is used to capture the temporal fluctuations of back-scattered speckle patterns, induced by Brownian displacements of scattering particles [1, 6–13]. Cross correlation analysis of time-varying speckle image series yields the speckle intensity temporal autocorrelation curve, g2(t), from which the mean square displacement (MSD) of scattering particles, <Δr2(t)>, is retrieved [1, 10, 11, 14–18]. For low viscosity materials, Brownian movements of light scattering particles are rapid and the MSD grows quickly with time, eliciting rapid speckle fluctuations. On the contrary, in substances with large viscoelastic modulus, the confined motion of scattering centers leads to restrained growth of MSD and slow variations of speckle patterns [10, 11]. The generalized Stokes-Einstein relation (GSER) has been previously established to relate the MSD of scattering particles to the bulk viscoelastic modulus, G*(ω), of the medium [11, 14–19].
The primary challenge in extracting the viscoelastic modulus of turbid and absorbing samples from speckle frame series lies in evaluating the MSD from the measured g2(t) curve. This is because the rate of temporal speckle fluctuations depends not only on the Brownian displacement of scattering centers, but also on the optical properties, such as absorption and reduced scattering coefficients (μa, μs'), that determine the transport of light within the illuminated volume [11, 20–22]. Therefore, in order to accurately measure sample mechanical properties using LSR, it is critical to isolate the influence of optical absorption and scattering from the g2(t) measurements to accurately describe the MSD.
Traditionally, diffusing wave spectroscopy (DWS) formalism is used to link the measured g2(t) and MSD for strongly scattering media with negligible absorption [14–18]. In such media light transport is reasonably diffusive [17]. Majority of turbid viscoelastic materials, such as biological tissues, exhibit considerable absorption features (μa > 0), and highly anisotropic scattering, leading to back-scattered light rays with sub-diffusive character [23]. In this case, the simple DWS formalism is modified to incorporate the optical properties to better explain the g2(t)-MSD relation [20, 24]. Alternatively, computationally intensive Monte-Carlo ray tracing (MCRT) algorithm offers to accurately simulate the propagation of light in any medium with arbitrary optical properties and derive a numerical solution to relate g2(t) with the MSD [11, 25]. Recently, we demonstrated the performance of a new PSCT-MCRT algorithm for deriving the MSD of particles in purely scattering samples and showed improved accuracy in estimating sample mechanical properties compared to the DWS approach [11]. However, a number of materials including biological samples are not only scattering, but have light absorbing characteristics at different illumination wavelengths. Therefore, in this paper, we study the modulation of temporal speckle intensity fluctuations by µs' and µa, using test phantoms that cover a wide range of optical properties pertinent to biological tissue such as blood, and other turbid materials, like emulsions, polymers, glazes, and pigments. We then compare the performance of the simpler DWS solution and the computationally-intensive PSCT-MCRT approach in describing and correcting for the influence of varying absorption and scattering properties on the measured viscoelastic modulus from speckle intensity fluctuations.
2. Materials and methods
2.1 Preparing test phantoms of varying optical properties
The studies reported here were performed using solutions of 90% glycerol and 10% water, with identical viscosity values of η ~0.24 Pa. s (at 20° C). The optical properties of liquid phantoms were tuned by adding various concentrations of TiO2 scattering particles (dia. 400 nm, Sigma-Aldrich) and carbon light absorbing nano-powder (dia. 423 nm, Sigma-Aldrich), such that the reduced scattering and absorption coefficients ranged from: µs' = 1.2 - 129.2 mm−1 and µa = 0.14-9.95 mm−1 (@ 633 nm). These included the optical properties relevant to biological tissue, such as blood, with low µs' (1-4 mm−1) within the visible and infrared spectrum [26, 27], dairy products and common industrial coating and films with medium µs' values (4-30 mm−1) [28, 29], and rich scattering material (µs'> 30 mm−1) in which light propagation could conveniently assumed to be diffusive. The glycerol suspensions were mixed in a vortex to evenly distribute particles within the final suspension, and transferred into disposable spectroscopic cuvettes (Fischer brand, light path 10 mm, vol. 1.5 ml) for LSR measurements. In all cases, Mie theory was used to calculate the optical properties of the samples and the sizes of TiO2 and carbon particles were confirmed using a dynamic light scattering instrument (Zetasizer, Malvern Instruments Ltd., UK) [23]. Choice of water-glycerol mixtures of the same viscosity (η ~0.24 Pa) and TiO2 and carbon particles of almost identical sizes ensured that all samples were mechanically similar and had indistinguishable Brownian dynamics. Thus, any observed variability in speckle fluctuations rate was solely due to optical property differences.
2.2 Laser speckle rheology: image acquisition and analysis
Time-varying speckle images of the prepared samples were acquired using the optical setup shown in Fig. 1 and fully described in our earlier work [6, 7, 9, 10]. Briefly, a Helium-Neon laser beam (633nm, 21 mW) was polarized, expanded, and focused to a 50 µm spot. The power on the sample was 4.5 mW. Cross-polarized laser-speckle patterns were acquired at 180° backscattering geometry using a high frame rate CMOS camera (Basler Ace, acA 2000-340 km) and a frame grabber (NI PCIe-1433 Camera Link) for 2 seconds at 964 frames per second (fps) (exposure time <600 μs). Such a high frame rate, allowed calculating the speckle intensity autocorrelation function, g2(t), with sufficient temporal resolution with approximately 1000 time-varying speckle images acquired between the start point (t = 0s) up to the plateau level (t ~1s). In addition, the camera aperture was set to maintain a pixel to speckle ratio of at least 4 to ascertain sufficient spatial sampling and spatial speckle contrast. The resulting camera field of view (FOV) was 2 mm, with the illumination spot located in the center of the FOV. These adjustments raised the contrasts of speckle frame series up to the maximum value of 1. The speckle intensity temporal autocorrelation curve, g2(t), was calculated by measuring the correlation between pixel intensities in the first speckle image and subsequent images. Spatial averaging was performed over all 280 × 280 pixels in the frame, and 500 g2(t) curves evolving in time were averaged to enhance the accuracy of temporal statistics as follows [6–11]:
| (1) |
Here I(t0) and I(t + t0) refer to the speckle intensity at times t0 and t + t0, < >pixels and < >t0 indicate spatial and temporal averaging over all the pixels in the images and for the entire imaging duration (2s), respectively.
Fig. 1.
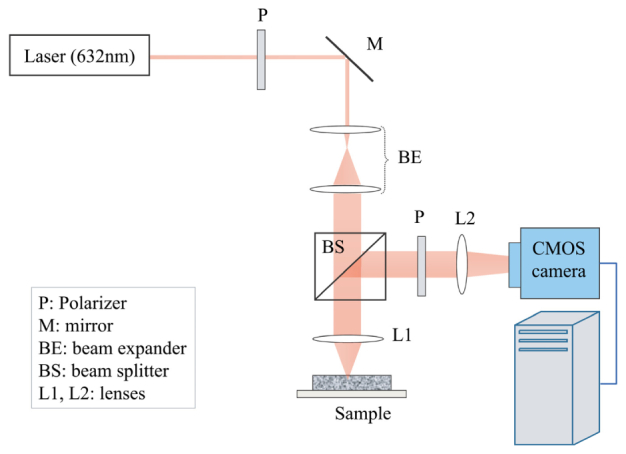
LSR Instrumentation [10]. Laser beam was passed through a polarizer (P), a beam expander (BE), and focused on the sample by a lens (L1). The backscattered light was redirected by a beam-splitter (BS) towards the camera aperture and passed through a polarizer (P). The cross polarized light was then focused by a lens (L2) at the CMOS sensor.
2.3 Extracting the MSD and viscoelastic modulus, |G*(ω)|, from g2(t) curves
As described above, accurate deduction of particles’ Brownian displacements, defined by the MSD, from the g2(t) curve is the primary challenge in deriving the sample mechanical properties from laser speckle fluctuations [11]. Towards this end, diffusing wave spectroscopy (DWS) exploits diffusion approximation to calculate the path length distribution of photons scattered back from the medium, P(S) [1]. Integrating the autocorrelation of individual paths over P(S) results in the following expression for g2(t) in the back-scattering geometry [1, 20, 24]:
| (2) |
Here k0 is the wave number, n is the refractive index of medium, <Δr2(t)> is the MSD of scattering particles, and γ is a modifying factor that reflects the ratio of long diffuse path lengths to short non-diffusive ones. It is generally assumed that γ = 5/3, but this parameter may slightly vary depending on the polarization state of the received light and the scattering particle size [1]. The second term in the exponents is related to optical properties of the sample and accounts for attenuation of long paths due to absorption. For strongly scattering media, this term reduces to zero.
We have recently derived an alternative numerical approach to describe the g2(t) and MSD relationship, by implementing a polarization-sensitive correlation transfer PSCT-MCRT algorithm which provides a more precise account of light propagation in turbid materials [11]. In short, the PSCT-MCRT approach incorporates the illumination/collection setup, sample geometry, polarization state, absorption and scattering coefficients, (µa, µs) and anisotropy factor, g, to track the scattering wave vector, defined as q = 2k0sin(θ/2), at each photon-particle collision event [11, 25]. Here θ is the polar angle of scattering. Compared to the path length distribution, P(S), exploited in DWS, the total momentum transfer distribution, P(Y) (Y = ∑q2/(2k02)), obtained from MCRT simulations, is expected to provide a superior description of correlation decay of each path [30]. A mathematically tractable solution is obtained by curve-fitting techniques, which yield the following expression for g2(t) [11]:
| (3) |
For a fixed choice of illumination/collection setup and sample geometry, the parameters γ and ζ in Eq. (3) depend only on the optical properties, namely μa and μs' = μs(1-g). While our prior work focused on the purely scattering samples [11], here, we executed the PSCT-MCRT code and calculated the (γ, ζ) pairs for µs' = 1.2-129.2 mm−1 and µa = 0.14-9.95 mm−1.
In this study, we investigated the performance of DWS and PSCT-MCRT in deducing the MSD from speckle intensity fluctuations by replacing g2exp(t) in the corresponding equations (Eqs. (2) and (3)). The MSD values were then substituted in the well-established generalized Stokes-Einstein relation (GSER) to calculate the |G*(ω)| [14–19]:
| (4) |
Here KB is the Boltzman constant (1.38 × 10⁻²³), T = 297 (room temperature) is the absolute temperature (degrees Kelvin), a~200 nm is the particle radius (based on the product specifications and independent DLS particle sizing), ω = 1/t is the loading frequency, Γ represents the gamma function, and α(t) = ∂ log <Δr2(t)>/ ∂ log t corresponds to logarithmic derivative of MSD. The GSER approximation used to estimate the G*(ω) from the MSD is well documented by others in the past [14–19]. The glycerol phantoms, studied here, were purely viscous and homogeneous. Since this criterion for the validity of GSER was met, |G*(ω)| could be directly drawn from the MSD [14–19].
2.4 Comparing the accuracy of LSR results with conventional mechanical testing
The performance of DWS and MCRT approaches in deriving the MSD and |G*(ω)| from LSR measurements was compared with reference standard mechanical rheometry (AR-G2, TA Instruments, MA) for all phantoms. Each sample (2 ml) was placed on a stationary temperature controlled peltier plate and a top plate of 40 mm diameter sheared the sample at oscillation frequencies of 0.1-100 Hz at 2% strain to obtain the frequency dependent viscoelastic modulus, G*(ω). Mechanical testing was carried out at 25°C.
3. Results
3.1 The influence of scattering properties on speckle intensity fluctuations
Figure 2 displays g2(t) curves of aqueous glycerol suspensions with identical viscosities and varying optical properties, μs': 1.2-129.2 mm−1 and μa ~0. In Fig. 2 the dotted and dashed curves correspond to theoretical g2(t) curves predicted by Dynamic Light Scattering (DLS) for single scattering (μ's very small) and the DWS formalism for rich multiple scattering (μs' large, μa/μs' = 0) [1]. Clearly all g2(t) curves lie between the theoretical limits of DLS and DWS. Moreover, decay rates accelerate with μs' [11]. For phantom samples with biologically relevant μs' values of 1.2, 1.8, and 2.5 mm−1, g2(t) curves decay faster than single scattering upper limit, but much slower than diffusion lower bound. The curves corresponding to larger μs' values have little biological relevance, but are pertinent to materials such as dairy products, glazes, and paints. Furthermore, by examining the behavior of the curves corresponding to high μs' we observe that even for μs' = 129.2 mm−1, g2(t) decays slightly slower than the predictions of DWS for strongly scattering material. This may be related to the shortcomings of the DWS equation in describing the sub-diffusive traits of the back-scattered intensity, as discussed later. Results of Fig. 2 indicate that μs' variations modify speckle fluctuations and subsequently the g2(t) curve decay rate, independent of sample mechanical properties [11].
Fig. 2.
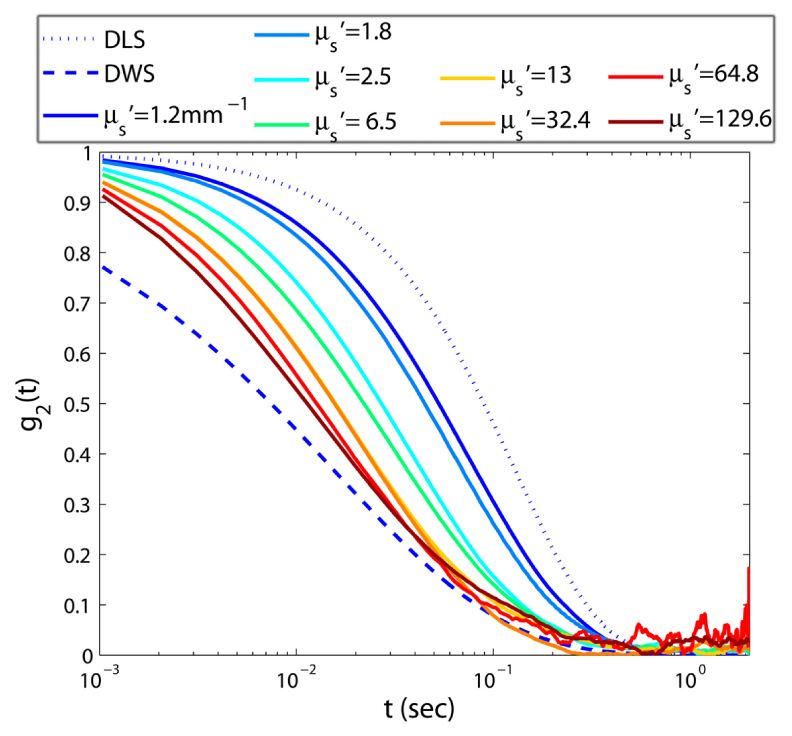
Speckle intensity temporal autocorrelation curves for aqueous glycerol suspensions of varying μs'. It is evident that speckle fluctuations speed up with increasing μs' and the decay trend of g2(t) curves is accelerated.
Next, we report the performances of DWS and PSCT-MCRT, in isolating the influence of scattering properties on the G*(ω) evaluated by the LSR. For this analysis, the MSD is deduced from the experimentally evaluated g2(t) curves of Fig. 2, using each of Eqs. (2), and (3), and substituted in Eq. (4) to calculate the frequency-dependent viscoelastic modulus |G*(ω)| displayed in Fig. 3. Standard mechanical rheometry measurement is also conducted and the results are displayed for comparison with the LSR measurements as a dashed black curve. Clearly, |G*(ω)| curves obtained via DWS formalism in Fig. 3(a) present a considerable deviation from conventional rheology. The failure in accurate extraction of |G*(ω)|, is drastically aggravated for biologically relevant μs' values (1-3 mm−1). In this range, relatively slower speckle fluctuations, generated by a smaller number of light scattering events, erroneously result in an over-estimation of the |G*(ω)|. It is only for µs' = 129.2 mm−1 that the LSR measurements, derived by DWS (Fig. 3(a)) converge to the results of mechanical rheometry.
Fig. 3.
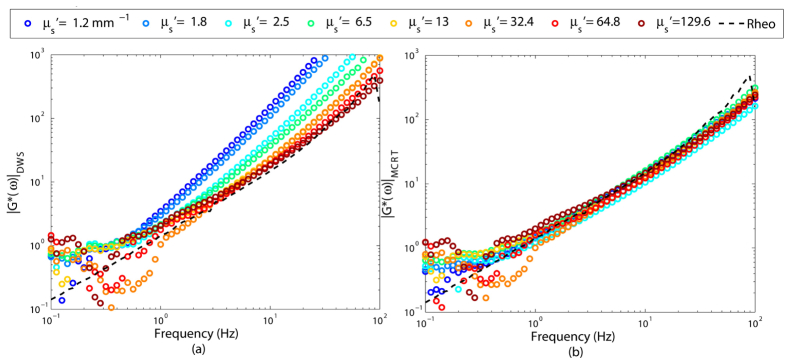
Viscoelastic modului, |G*(ω)|, extracted from g2(t) curves of Fig. 2, using (a) DWS equation, and (b) PSCT-MCRT based approach. The viscoelastic modulus measured using a conventional rheometer is shown as a black dashed curve. For these primarily scattering samples of negligible absorption, DWS fails to yield an accurate estimate of viscoelastic properties. In contrast, PSCT-MCRT successfully derives the moduli from g2(t) curves of Fig. 2.
On the contrary, the PSCT-MCRT approach succeeds in sufficiently isolating optical scattering contributions to estimate moduli for any arbitrary μs' value (Fig. 3(b)). The measured |G*(ω)| curves corresponding to weakly, moderately, and strongly scattering samples show close correspondence with the results of conventional rheology, especially at intermediate frequencies. At low and high frequency limits, a small deviation of |G*(ω)| curves is observed between LSR and mechanical rheometry potentially caused by speckle contrast artifacts and rheometer inertia limitations, respectively, as discussed later [10, 11].
3.2 The influence of absorption properties on speckle intensity fluctuations
The results presented in this section are obtained by varying optical absorption while scattering properties are kept constant. Figure 4 displays g2(t) curves of samples with identical viscosities and µs' ~2.4, with µa: 0 – 0.54 mm−1. Clearly, variation of absorption properties greatly influences the g2(t) curve. When µa increases, temporal speckle intensity fluctuations slow down, likely due to elimination of longer optical paths, which involve a larger number of scattering events. Clipping of these paths, rounds off the rapid initial decay of g2(t) curve [1]. However, the impact of absorption on the long time behavior is rather small. This part of the curves is primarily modulated by shorter optical paths that are less influenced by absorption and encountered less number of scattering events [1]. As a result, when µa increases, the curvature and the trend of g2(t) at early times are modified.
Fig. 4.
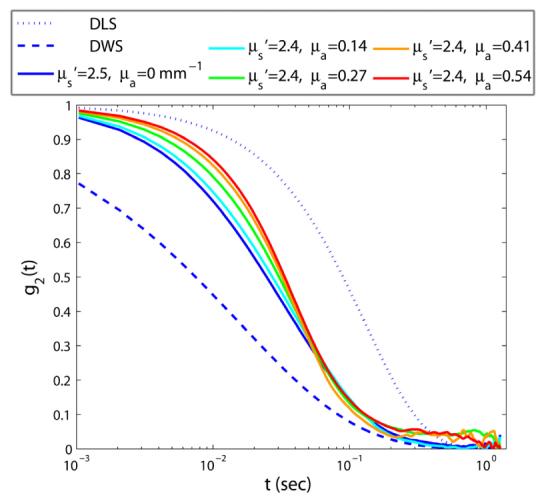
Speckle intensity temporal autocorrelation curves for aqueous glycerol suspensions of varying absorption coefficient. As μa increases, speckle fluctuations decelerate, and g2(t) curves decay slower.
Figure 5 displays the resulting |G*(ω)|, obtained from g2(t) curves of Fig. 4, as described above. In contrast to Fig. 3(a), which clearly displays the errors induced in estimated |G*(ω)| values by scattering variations, it appears that DWS is fairly resilient to absorption-induced adjustment of speckle intensity fluctuations, whenever μa is non-negligible. The capability of DWS in extracting the MSD and consequently the |G*(ω)|, in the presence of non-negligible absorption is noted in Eq. (2). This equation incorporates the influence of absorption in the term μa/μs', and predicts that for a fixed μs', an increase in μa, leads to slower speckle fluctuations, which is consistent with the experimental results of Fig. 4. Nonetheless, in the purely scattering sample, with μs' = 2.5 and μa = 0, the term μa/μs' reduces to 0 and |G*(ω)| values derived using DWS formalism exhibit a significant deviation from the rheology measurements. Moreover, in samples μa/μs' > 0.1, changes in the curvature of g2(t) curve, observed in Fig. 4, induces a slight deviation at intermediate frequencies as discussed later. In Fig. 5(b), |G*(ω)| curves derived via PSCT-MCRT approach are displayed. As expected, PSCT-MCRT effectively compensates for the attributes of absorption variation from the final |G*(ω)| curves in all cases. Just as in Fig. 3, small deviations are still present at low/high frequency limits due to experimental artifacts.
Fig. 5.
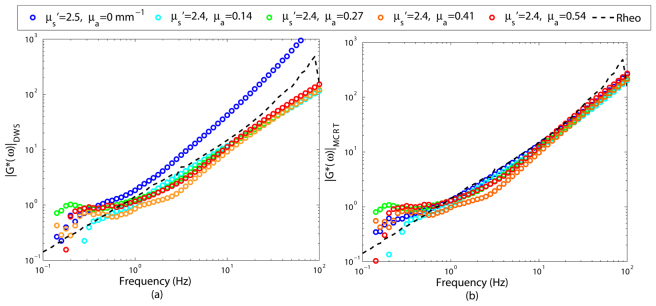
Viscoelastic modulus, |G*(ω)|, obtained from g2(t) curves of Fig. 3, using (a) DWS equation, and (b) PSCT-MCRT for glycerol suspensions of identical mechanical properties, similar reduced scattering coefficient, μs', but varying absorption coefficient, μa. The viscoelastic modulus measured using a conventional rheometer is shown as a dashed black curve. It is clear that DWS is capable of correcting for the influence of variations in μa. PSCT- MCRT performs well for any arbitrary set of optical properties.
3.3 The combined influence of scattering and absorption on speckle intensity fluctuations
In the above sections thus far, we have separately investigated the influence of scattering and absorption variations on speckle intensity fluctuations, by keeping one of the μs' and μa fixed, and modifying the other. To obtain the results in Fig. 6, both μs' and μa are varied simultaneously. At first, in Fig. 6(a), we consider the influence of increasing the μa while reducing the μs' (μa↑, μs'↓) on the speckle fluctuations. In the second scenario, in Fig. 6(b), speckle fluctuations are modified by increasing both μs' and μa (μs' ↑, μa↑).
Fig. 6.
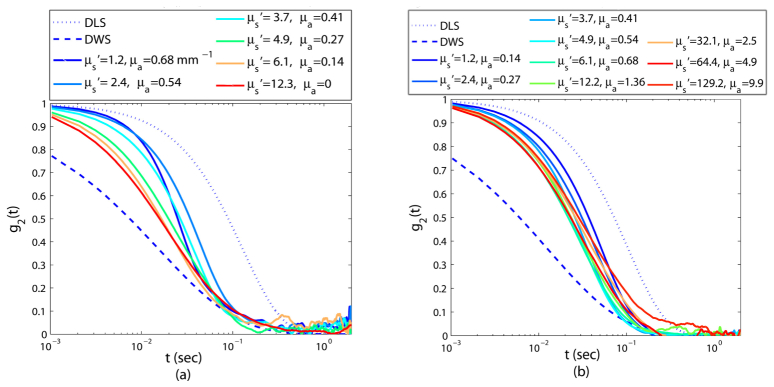
Speckle intensity temporal autocorrelation curve, g2(t) for samples of varying μs' and μa. In panel (a) samples with higher μs' have a smaller μa, whereas in panel (b) μs' and μa are proportional.
In Fig. 6(a), the differences of (μs', μa) pairs cause a significant variation in the experimentally measured g2(t). For the moderately scattering sample of negligible absorption (μs' ~13 mm−1 and μa ~0), light scatters multiple times before being detected and minute displacements of scattering particles, involved in each optical path, accumulate and induce a rapidly decaying g2(t) curve. By gradually adding small amounts of absorbing particles and reducing the scattering concentration, (for instance in samples with μ's = 6.1 mm−1, μa = 0.14 mm−1; μs' = 4.9 mm−1, μa = 0.27 mm−1, μs' = 3.7 mm−1, μa = 0.41 mm−1, and μs' = 2.4, μa = 0.54 mm−1), long optical paths are ultimately absorbed and g2(t) curves slow down, proportionally. Notice that for these curves, μa/μs' values are equal to 0.0022, 0.055, 0.11, and 0.23 respectively. Thus, as the exponent in Eq. (2) predicts, by gradual growth of μa/μs' ratio, g2(t) proportionately slows down. In one case, for the most weakly scattering samples of strong absorption, (μs' = 1.2 mm−1, μa = 0.68 mm−1), the rays scatter only a few times, due to the sparse distribution of scattering centers. Besides, strong absorption extensively eliminates long optical paths that propagate through the medium. Therefore, the initial decay of g2(t) slows down significantly, and as observed in Fig. 6(a), leading to a drastic modification of the g2(t) curvature at the intermediate times. For this phantom, the μa/μs' ratio rises to 0.49, indicating that μs' are μa comparable and the underlying assumption of DWS, i.e. μa << μs', is at the verge of breakdown.
As opposed to Fig. 6(a), in Fig. 6(b) g2(t) curves follow a very similar decay trend, despite considerable difference in optical properties. In this panel, optical properties of samples are chosen so that μs' and μa vary almost proportionally. Increasing μs' is expected to increase the number of received long optical paths of faster decorrelation. However, simultaneous increase of μa trims these paths and cancels out the influence of larger μs'. Thus, by simultaneously increasing both μs' and μa speckle fluctuations rates vary minimally, which is reflected by the small variability of μa/μs': 0.08 - 0.1, ensuing only minute shifts in the g2(t) curves.
Figures 7(a), and 7(b) display the resulting viscoelastic moduli, extracted from g2(t) curves of Fig. 6(a), using DWS and PSCT-MCRT simulations, respectively. Clearly, viscoelastic moduli corresponding to samples of low to moderate μa represent close agreement with the results of conventional rheology in both cases (Fig. 7(a) and 7(b)). Only in one case, where μs' is the lowest and the μa is the highest (μs' = 1.2, μa = 0.68 mm−1) the irregular g2(t) curvature leads to a slight deviation of the LSR results from mechanical rheometry at intermediate frequencies, especially in the case of DWS.
Fig. 7.
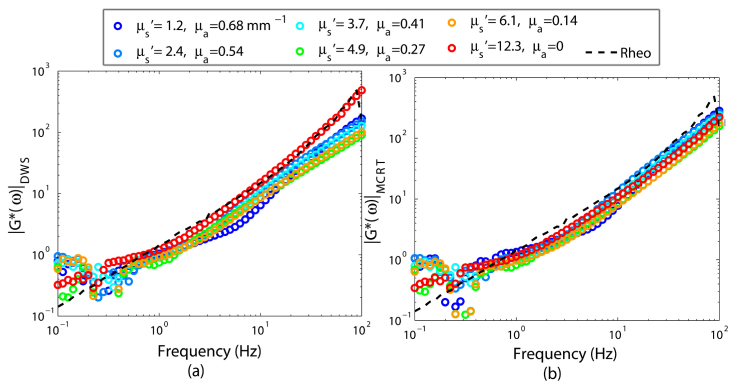
Viscoelastic modulus, |G*(ω)|, obtained from g2(t) curves of Fig. 6(a), using (a) DWS equation, and (b) PSCT-MCRT, for glycerol suspensions of identical mechanical properties and varying μ's and μa. The viscoelastic modulus measured using a conventional rheometer is shown as a black dashed curve. |G*(ω)| derived from speckle fluctuations, exhibit close agreement with conventional rheology, except when μ's = 1.2 and μa = 0.68.
Figure 8 displays the results of |G*(ω)|, obtained from g2(t) curves of Fig. 6(b), using DWS equation (Fig. 8(a)), and PSCT-MCRT (Fig. 8(b)). Both approaches can successfully isolate the contribution of optical properties in samples, for which μs' and μa are non-negligible and proportional, as shown in Fig. 8(a) and 8(b). It is worth noting that the optical properties of blood at 690 nm are very close to the phantom with μs' = 1.2 mm−1 and μa = 0.14 mm−1 [31]. Since DWS and MCRT behave the same in this case, they may accurately and effectively evaluate the viscoelastic properties of the blood, in its native state, from laser speckle fluctuations.
Fig. 8.
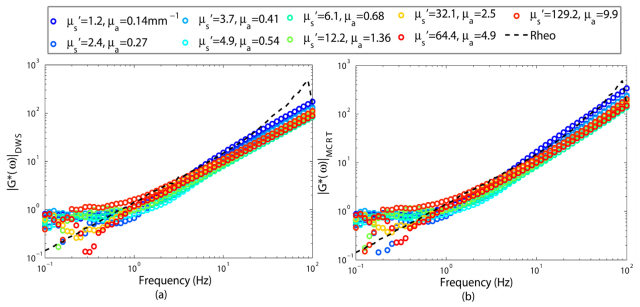
Viscoelastic modulus, |G*(ω)|, obtained from g2(t) curves of Fig. 6(b) using (a) DWS equation, and (b) PSCT-MCRT. The viscoelastic modulus measured using a conventional rheometer is shown as a black dashed curve. In both cases, modulus values match the results of conventional rheometry.
4. Discussion
We have previously established the close correspondence between the temporal trend of the g2(t) curve and mechanical properties over a wide range of viscoelastic moduli in phantoms, excised tissue, and living animals, in vivo [9–11]. Our goal in this study is to investigate the influence of absorption and scattering on the accuracy of LSR measurements. More specifically, we demonstrate that speckle modulation by μa and μs' variations, in samples of identical mechanical properties, complicates the analysis of g2(t) curve for deducing the MSD, and induces inaccuracies in the estimated viscoelastic moduli [11, 22].
The necessity of incorporating optical properties in the analysis of laser speckle contrast for blood flow quantification has been investigated by others [22, 26]. Theoretically, speckle contrast may be recovered from g2(t) through temporal integration. Nonetheless, the inverse is not true, and the g2(t) curve cannot be directly inferred from speckle contrast measurements. Thus, findings of these past studies are not directly applicable to the problem of assessing viscoelasticity from speckle fluctuations encountered in LSR. In [20], authors had a glimpse at speckle modulation induced by μs' variations. Nonetheless, the role of μa was not discussed. To address the confounding effect of both μa and μs' variations on speckle modulation, we compare the capability of DWS formalisms and Monte-Carlo based approaches, to deduce the MSD of scattering particles and eventually the viscoelastic modulus from g2(t) curves. A key result of this work is that for samples with non-negligible, moderate μa, DWS exhibits fortuitously accurate results and mirrors the computationally intensive PSCT-MCRT approach in its capability to measure MSD. The reasonable accuracy of the simpler and computationally convenient DWS solution for speckle analysis opens the possibility for real-time and rapid assessment of sample mechanical properties using LSR for chemical, industrial and biomedical applications.
The glycerol phantoms studied here have a large range of μa (0.14-9.95 mm−1) and μs' (1.2-129.2 mm−1) values similar to soft tissues and bio-fluids, as well as coatings, creams, emulsions, and paints in the visible/near-infrared window [1–5]. We have exploited Mie theory to calculate μa and μs' of these phantoms [23]. In practice, when conducting LSR in viscoelastic materials, like tissue, optical properties may be evaluated experimentally. We have previously shown that by temporal averaging of speckle frames, the diffuse reflectance profile (DRP) of the scattered light may be calculated. Then μa and μs' may be extracted by fitting the DRP to a model derived from steady state diffusion theory [7, 11, 32].
In glycerol phantoms, studied here, the MSD depends on the viscosity of the solvent and the radius of Carbon and TiO2 particles, a. Besides, optical properties may be expressed using Mie theory as [23]:
| (5) |
Here, ρ, σA and σS represent the number-density and absorption and scattering cross sections of the Carbon and TiO2 particles and g is the anisotropy factor. Both σA and σS are complex functions of source wavelength, refractive index mismatch, and the particle size, a. Therefore, by investigating the role of optical properties in speckle modulation, we also indirectly consider the contribution of particle size. Since variations of a, alter both µa and μs', it is challenging to distinguish the effect of particle size, alone, on speckle fluctuations. To determine the viscoelastic modulus, the influence of particle size is isolated by substituting a in the GSER (Eq. (4)) to accurately deduce G*(ω) from the MSD [14–19]. The GSER approximation is sufficiently accurate in homogenous viscous glycerol phantoms. Close agreement between LSR measurements of G*(ω) and the reference-standard rheometry, observed in Figs. 3, 5, 7, and 8, further confirms the validity of GSER. To enable LSR measurements in substances where scattering size in not known before hand, such as tissue, supplementary components may be integrated in the LSR setup to estimate the particle size distribution, for instance by analyzing the angle-resolved low coherence radiation or by processing the angular dependence of the diffuse intensity at multiple polarization states [33, 34].
In early DLS studies for particle sizing applications, digital correlators have been exploited to calculate the g2(t) curve of the light collected over a single speckle spot by a photomultiplier tube (PMT) or a photodiode (PD) [1]. Utilizing the intensity of only one coherent area, necessitates temporal averaging of several g2(t) curves and acquisition times of several minutes to hours. The high speed CMOS camera, used for multi-speckle acquisition here, improves the statistical accuracy of the measured g2(t) and eliminates the need for long-time acquisition [6–12].
In the current LSR setup, the 50 µm illumination beam is located at the center of the 2 mm FOV. Fluctuations of acquired speckle spots are likely influenced by distance from the illumination center. For instance in highly scattering samples, rays remitted further away from the illumination center travel longer optical paths and likely increase the rate of speckle fluctuations at peripheral regions of the FOV. In addition, cross-polarized collection of the scattered light, filters out both specular reflection and single-scattered light, enhancing the contribution of multiply scattered light on speckle fluctuations. In contrast, for strongly absorbing samples, where longer paths are significantly pruned, most of the back-scattered photons escape the sample at the vicinity of illumination center and location-dependence modulation of speckle is reduced. Equations (2) and (3), derived using DWS formalism and MCRT-based approach, incorporate the implications of path length distribution by integrating the autocorrelation function of individual light paths over the entire distribution. Equivalently, in experimental evaluation of g2(t) spatial averaging over the entire FOV reduces the influence of path length variability in the calculation of g2(t) (Eq. (1)).
Figures 3(b), 5(b), 7(b), and 8(b) demonstrate that PSCT-MCRT simulations, which take into account the illumination/detection configuration, optical properties, and polarization state provide the most accurate estimate of the MSD and the sample viscoelasticity for any arbitrary choice of optical properties [11, 35]. The PSCT-MCRT approach, although computationally intensive, accurately tracks photons in the turbid medium of known optical properties and computes the total momentum transfer Y = ∑q2/(2k02) [11]. As a result, in all cases it provides similar or superior accuracy compared to DWS.
Figures 3(a), 5(a), 7(a), and 8(a) demonstrate that for samples with non-negligible absorption, the MSD and subsequently |G*(ω)| are accurately evaluated via the DWS formalism (Eq. (2)). However, this approach fails whenever absorption is negligible, since the modifying factor of μa/μs' → 0 and the final |G*(ω)| curve exhibits a bias with respect to the results of rheometry as seen in Figs. 3(a) and 5(a) [11]. The magnitude of this bias is given by the deviation of μs' from that of a strongly scattering medium. In addition, when μa/μs' is markedly large and μs' is small, flattening of initial decay of g2(t) drastically modifies its curvature. Therefore, |G*(ω)| slightly bend at intermediate frequencies, as observed in Figs. 5(a) and 7(a). This confirms the generally cited criterion for validity of diffusion approximation, used to derive the DWS expression, that μa/μs' ≤ 0.1 [36, 37]. The competency of DWS for 0 < μa/μs' < 0.1 is explained by the broad optical path length distribution in the back-scattering geometry, which is composed of sub-diffusive ballistic and snake photons as well as diffuse light [1]. The DWS formalism is plausibly accurate in describing the behavior of the diffuse light, equivalent to the early decay of g2(t). However, it falls short in describing the long-time decay of the g2(t), related to shorter paths with fewer scattering events. The early, intermediate, and longtime decay of g2(t) curve translate into |G*(ω)| measured at high, intermediate, and low frequencies, respectively. As a result, DWS formalism accurately accounts for the viscoelastic modulus at moderate to high frequencies for samples with non-negligible absorption, such as most biological specimens and soft tissue. In particular, the demonstrated utility of the DWS approach in Fig. 8(b) for the phantom with μs' = 1.2 mm−1 and μa = 0.14 mm−1, which is similar to blood at 690 nm [31], opens new prospects for the rapid and real-time LSR measurements of the blood viscosity, in its native state. However, in living systems, for instance in the presence of blood perfusion or intra-cellular motility, LSR may not be conducive for evaluating the viscoelastic properties since the MSD is potentially influenced by both passive Brownian movements and active processes. Thus, in these cases, care should be taken when using the GSER (Eq. (4)) to deduce the G*(ω) from the MSD.
An alternative analytical solution, termed telegrapher equation, has been proposed that is slightly more complex than DWS but supposedly treats the strong absorption and non-diffusive propagation in weakly scattering samples with more accuracy [35]. It also accounts for scattering anisotropy by making the localized area around the light source devoid of diffused photons to emulate the forwardly directed anisotropic scattering of photons. In this way, photon migrations at various distances from the source are treated differently. Despite all these modifications, our preliminary experiments illustrated that the telegrapher equation does not exhibit a significant improvement over DWS [35]. The demonstrated efficacy of DWS formalism obviates the need for a more complex Monte-Carlo Ray Tracing approach, whenever noticeable absorption exists and the ratio μa/μs' < 0.1. The current development on correcting for the influence of optical properties helps to significantly improve the performance and accuracy of LSR to measure the mechanical properties of a variety of materials including biological tissue.
Acknowledgments
This study was funded by the NIH grant No. R21 HL 088306 (S.N), NIH grant No. U54 EB015408-01 (S.N), and the ARRA grant No. R21 HL 088306-02S1 (S.N).
References and links
- 1.D. A. Weitz and D. J. Pine, “Diffusing-Wave Spectroscopy,” in Dynamic Light Scattering: The Methods and Some Applications, W. Brown, ed. (Oxford University, 1993) (49). [Google Scholar]
- 2.Robins M. M., Watson A. D., Wilde P. J., “Emulsions-creaming and rheology,” Curr. Opin. Colloid Interface Sci. 7(5-6), 419–425 (2002). 10.1016/S1359-0294(02)00089-4 [DOI] [Google Scholar]
- 3.Alexander M., Dalgleish D. G., “Application of transmission diffusing wave spectroscopy to the study of gelation of milk by acidification and rennet,” Colloids Surf. B Biointerfaces 38(1-2), 83–90 (2004). 10.1016/j.colsurfb.2004.08.012 [DOI] [PubMed] [Google Scholar]
- 4.Breugem A. J., Bouchama F., Koper G. J. M., “Diffusing wave spectroscopy: A novel rheological method for drying paint films,” Surf. Coat. Int. B 88(2), 135–138 (2005). 10.1007/BF02699545 [DOI] [Google Scholar]
- 5.Brun A., Dihang H., Brunel L., “Film formation of coatings studied by diffusing-wave spectroscopy,” Prog. Org. Coat. 61(2-4), 181–191 (2008). 10.1016/j.porgcoat.2007.09.041 [DOI] [Google Scholar]
- 6.Nadkarni S. K., Bouma B. E., Helg T., Chan R., Halpern E., Chau A., Minsky M. S., Motz J. T., Houser S. L., Tearney G. J., “Characterization of atherosclerotic plaques by laser speckle imaging,” Circulation 112(6), 885–892 (2005). 10.1161/CIRCULATIONAHA.104.520098 [DOI] [PMC free article] [PubMed] [Google Scholar]
- 7.Nadkarni S. K., Bilenca A., Bouma B. E., Tearney G. J., “Measurement of fibrous cap thickness in atherosclerotic plaques by spatiotemporal analysis of laser speckle images,” J. Biomed. Opt. 11(2), 021006 (2006). 10.1117/1.2186046 [DOI] [PMC free article] [PubMed] [Google Scholar]
- 8.Nadkarni S. K., Bouma B. E., Yelin D., Gulati A., Tearney G. J., “Laser speckle imaging of atherosclerotic plaques through optical fiber bundles,” J. Biomed. Opt. 13(5), 054016 (2008). 10.1117/1.2982529 [DOI] [PMC free article] [PubMed] [Google Scholar]
- 9.Hajjarian Z., Xi J., Jaffer F. A., Tearney G. J., Nadkarni S. K., “Intravascular laser speckle imaging catheter for the mechanical evaluation of the arterial wall,” J. Biomed. Opt. 16(2), 026005 (2011). 10.1117/1.3533322 [DOI] [PMC free article] [PubMed] [Google Scholar]
- 10.Hajjarian Z., Nadkarni S. K., “Evaluating the viscoelastic properties of tissue from laser speckle fluctuations,” Sci. Rep. 2, 316 (2012). 10.1038/srep00316 [DOI] [PMC free article] [PubMed] [Google Scholar]
- 11.Hajjarian Z., Nadkarni S. K., “Evaluation and Correction for Optical Scattering Variations in Laser Speckle Rheology of Biological Fluids,” PLoS ONE 8(5), e65014 (2013). 10.1371/journal.pone.0065014 [DOI] [PMC free article] [PubMed] [Google Scholar]
- 12.Cipelletti L., Weitz D. A., “Ultralow angle dynamic light scattering with a charge coupled device camera based multispeckle multitau correlator,” Rev. Sci. Instrum. 70(8), 3214–3221 (1999). 10.1063/1.1149894 [DOI] [Google Scholar]
- 13.Pine D. J., Weitz D. A., Zhu J. X., Herbolzheimer E., “Diffusing-wave spectroscopy: dynamic light scattering in the multiple scattering limit,” J. Phys. France 51, 2101–2127 (1990). [Google Scholar]
- 14.Mason T. G., Weitz D. A., “Optical measurements of frequency-dependent linear viscoelastic moduli of complex fluids,” Phys. Rev. Lett. 74(7), 1250–1253 (1995). 10.1103/PhysRevLett.74.1250 [DOI] [PubMed] [Google Scholar]
- 15.Mason T. G., Gang H., Weitz D. A., “Diffusing-wave-spectroscopy measurements of viscoelasticity of complex fluids,” J. Opt. Soc. Am. A 14(1), 139–149 (1997). 10.1364/JOSAA.14.000139 [DOI] [Google Scholar]
- 16.Mason T. G., “Estimating the viscoelastic moduli of complex fluids using the generalized Stokes-Einstein equation,” Rheol. Acta 39(4), 371–378 (2000). 10.1007/s003970000094 [DOI] [Google Scholar]
- 17.Dasgupta B. R., Tee S. Y., Crocker J. C., Frisken B. J., Weitz D. A., “Microrheology of polyethylene oxide using diffusing wave spectroscopy and single scattering,” Phys. Rev. E Stat. Nonlin. Soft Matter Phys. 65(5), 051505 (2002). 10.1103/PhysRevE.65.051505 [DOI] [PubMed] [Google Scholar]
- 18.Dasgupta B. R., Weitz D. A., “Microrheology of cross-linked polyacrylamide networks,” Phys. Rev. E Stat. Nonlin. Soft Matter Phys. 71(2), 021504 (2005). 10.1103/PhysRevE.71.021504 [DOI] [PubMed] [Google Scholar]
- 19.Jonas M., Huang H., Kamm R. D., So P. T., “Fast fluorescence laser tracking microrheometry. I: instrument development,” Biophys. J. 94(4), 1459–1469 (2008). 10.1529/biophysj.106.098111 [DOI] [PMC free article] [PubMed] [Google Scholar]
- 20.Boas D. A., Yodh A. G., “Spatially varying dynamical properties of turbid media probed with diffusing temporal light correlation,” J. Opt. Soc. Am. A 14(1), 192–215 (1997). 10.1364/JOSAA.14.000192 [DOI] [Google Scholar]
- 21.Irwin D., Dong L., Shang Y., Cheng R., Kudrimoti M., Stevens S. D., Yu G., “Influences of tissue absorption and scattering on diffuse correlation spectroscopy blood flow measurements,” Biomed. Opt. Express 2(7), 1969–1985 (2011). 10.1364/BOE.2.001969 [DOI] [PMC free article] [PubMed] [Google Scholar]
- 22.Mazhar A., Cuccia D. J., Rice T. B., Carp S. A., Durkin A. J., Boas D. A., Choi B., Tromberg B. J., “Laser speckle imaging in the spatial frequency domain,” Biomed. Opt. Express 2(6), 1553–1563 (2011). 10.1364/BOE.2.001553 [DOI] [PMC free article] [PubMed] [Google Scholar]
- 23.L. V. Wang and H. Wu, Biomedical optics: principles and imaging (Wiley-Interscience, 2007). [Google Scholar]
- 24.Cardinaux F., Cipelletti L., Scheffold F., Schurtenberger P., “Micreorheology of giant-micelle solutions,” Europhys. Lett. 57(5), 738–744 (2002). 10.1209/epl/i2002-00525-0 [DOI] [Google Scholar]
- 25.Sakadzić S., Wang L. V., “Correlation transfer equation for multiply scattered light modulated by an ultrasonic pulse,” J. Opt. Soc. Am. A 24(9), 2797–2806 (2007). 10.1364/JOSAA.24.002797 [DOI] [PubMed] [Google Scholar]
- 26.Rice T. B., Konecky S. D., Mazhar A., Cuccia D. J., Durkin A. J., Choi B., Tromberg B. J., “Quantitative determination of dynamical properties using coherent spatial frequency domain imaging,” J. Opt. Soc. Am. A 28(10), 2108–2114 (2011). 10.1364/JOSAA.28.002108 [DOI] [PMC free article] [PubMed] [Google Scholar]
- 27.Flock S. T., Jacques S. L., Wilson B. C., Star W. M., van Gemert M. J., “Optical properties of Intralipid: a phantom medium for light propagation studies,” Lasers Surg. Med. 12(5), 510–519 (1992). 10.1002/lsm.1900120510 [DOI] [PubMed] [Google Scholar]
- 28.Calhoun W. R., Maeta H., Roy S., Bali L. M., Bali S., “Sensitive real-time measurement of the refractive index and attenuation coefficient of milk and milk-cream mixtures,” J. Dairy Sci. 93(8), 3497–3504 (2010). 10.3168/jds.2010-3045 [DOI] [PubMed] [Google Scholar]
- 29.Latour G., Elias M., Frigerio J.-M., “Determination of the Absorption and Scattering Coefficients of Pigments: Application to the Identification of the Components of Pigment Mixtures,” Appl. Spectrosc. 63(6), 604–610 (2009). 10.1366/000370209788559719 [DOI] [PubMed] [Google Scholar]
- 30.Durian D. J., “Accuracy of diffusing-wave spectroscopy theories,” Phys. Rev. E Stat. Phys. Plasmas Fluids Relat. Interdiscip. Topics 51(4), 3350–3358 (1995). 10.1103/PhysRevE.51.3350 [DOI] [PubMed] [Google Scholar]
- 31.V. V. Tuchin, Handbook of optical biomedical diagnostics (SPIE Press, 2002). [Google Scholar]
- 32.Farrell T. J., Patterson M. S., Wilson B., “A diffusion theory model of spatially resolved, steady-state diffuse reflectance for the noninvasive determination of tissue optical properties in vivo,” Med. Phys. 19(4), 879–888 (1992). 10.1118/1.596777 [DOI] [PubMed] [Google Scholar]
- 33.Giacomelli M., Zhu Y., Lee J., Wax A., “Size and shape determination of spheroidal scatterers using two-dimensional angle resolved scattering,” Opt. Express 18(14), 14616–14626 (2010). 10.1364/OE.18.014616 [DOI] [PMC free article] [PubMed] [Google Scholar]
- 34.Hielscher A. H., Mourant J. R., Bigio I. J., “Influence of particle size and concentration on the diffuse backscattering of polarized light from tissue phantoms and biological cell suspensions,” Appl. Opt. 36(1), 125–135 (1997). 10.1364/AO.36.000125 [DOI] [PubMed] [Google Scholar]
- 35.Lemieux P. A., Vera M. U., Durian D. J., “Diffusing-light spectroscopies beyond the diffusion limit:The role of ballistic transport and anisotropic scattering,” Phys. Rev. E Stat. Phys. Plasmas Fluids Relat. Interdiscip. Topics 57(4), 4498–4515 (1998). 10.1103/PhysRevE.57.4498 [DOI] [Google Scholar]
- 36.Jacques S. L., Pogue B. W., “Tutorial on diffuse light transport,” J. Biomed. Opt. 13(4), 041302 (2008). 10.1117/1.2967535 [DOI] [PubMed] [Google Scholar]
- 37.D. A. Boas, C. Pitris, and N. Ramanujam, Handbook of biomedical optics (CRC Press, 2011). [Google Scholar]


