Abstract
To realize low-dose imaging in X-ray computed tomography (CT) examination, lowering milliampere-seconds (low-mAs) or reducing the required number of projection views (sparse-view) per rotation around the body has been widely studied as an easy and effective approach. In this study, we are focusing on low-dose CT image reconstruction from the sinograms acquired with a combined low-mAs and sparse-view protocol and propose a two-step image reconstruction strategy. Specifically, to suppress significant statistical noise in the noisy and insufficient sinograms, an adaptive sinogram restoration (ASR) method is first proposed with consideration of the statistical property of sinogram data, and then to further acquire a high-quality image, a total variation based projection onto convex sets (TV-POCS) method is adopted with a slight modification. For simplicity, the present reconstruction strategy was termed as “ASR-TV-POCS.” To evaluate the present ASR-TV-POCS method, both qualitative and quantitative studies were performed on a physical phantom. Experimental results have demonstrated that the present ASR-TV-POCS method can achieve promising gains over other existing methods in terms of the noise reduction, contrast-to-noise ratio, and edge detail preservation.
OCIS codes: (110.7440) X-ray imaging, (100.3190) Inverse problems, (100.3010) Image reconstruction techniques, (110.6960) Tomography
1. Introduction
X-ray computed tomography (CT) has been widely used for clinical diagnosis and image-guided interventions over the past decades. However, excessive X-ray radiation exposure during clinical examination has been reported to increase lifetime risk of cancerous, genetic, and other diseases [1, 2]. Therefore, minimizing the radiation risks is strongly desirable in clinical practices. To realize this objective, numerous studies have focused on reducing the milliampere-seconds (low-mAs) per projection view or decreasing the required number of projection views (sparse-view) per rotation around the body [3–6]. However, in the case of low-mAs or sparse-view CT image reconstruction, the associative sinograms will be noisy and insufficient, thus resulting in a degraded image if appropriate data noise control is not applied during image reconstruction.
To address the issues of low-mAs or sparse-view CT image reconstruction, various approaches have been proposed [7–23]. For the case of low-mAs CT image reconstruction, one of the major strategies models the noise property of measurements by using an objective function in image domain and then solves the objective function for image reconstruction by using statistical iterative algorithms [7–10]. A typical example is the penalized weighted least-square (PWLS) criterion, which is constructed with consideration of the Gaussian noise characteristics of the measured sinogram data [8–10]. Additionally, an alternative strategy models the noise property of measurements by using an objective function in the projection- or sinogram-domain, achieves optimal sinogram data estimation, and then performs analytical image reconstruction via the conventional filtered back-projection (FBP) method [10–13]. For example, the penalized Poisson likelihood (PL) and PWLS objective functions for projection data preprocessing were built based on the assumptions of Poisson and Gaussian statistical characteristics of projection and sinogram data, respectively [10, 12]. These statistical-based low-mAs image reconstruction strategies have remarkable gains in achieving a superior noise-resolution tradeoff over analytical reconstruction techniques. Another strategy that directly models the image characteristics uses a sophisticated linear or non-linear filter to restore the FBP-reconstructed image [14–18]. Two famous examples are the anisotropic diffusion filter-based and wavelet-based edge-preserving CT image noise reduction techniques, which can yield significant gains over direct FBP image reconstruction in terms of noise reduction and structural information preservation [16, 17]. For sparse-view CT image reconstruction, one of the major strategies is the total variation (TV) based projection onto convex sets (POCS) methods, which can effectively deal with the data insufficiency from sparse-view sampling with the piecewise constant assumption of the desired-image [19, 20]. Furthermore, to address the limitations of the original TV constrain with isotropic edge property, different weighted-TVs, as extensions of the original one, were proposed recently [21–23]. In sum, we can observe that the existing methods for low-mAs and sparse-view based CT image reconstruction methods have different advantages in yielding a high-quality image. However, there are very few literatures for discussing CT image reconstruction with a combined low-mAs and sparse-view protocol in detail.
In this study, we are focusing on low-dose CT image reconstruction from sinograms acquired with a combined low-mAs and sparse-view protocol and propose a dedicated two-step image reconstruction strategy. Specifically, we first propose an adaptive sinogram restoration (ASR) method to suppress significant statistical noise in noisy and insufficient sinograms, and then we adopt a TV-based projection onto convex sets (TV-POCS) method to yield an artifact-free image. For simplicity, the present reconstruction strategy is termed ASR-TV-POCS in this study. In the case with a combined low-mAs and sparse-view protocol, the original TV-POCS reconstruction will suffer from the data inconsistency due to the measurement of sparse-view and low mAs [19, 20]. The present ASR-TV-POCS algorithm can be regarded as an improved version of the TV-POCS algorithm to solve the abovementioned issues for sparse-view reconstruction with low mAs by adding a preprocessing step prior to the TV-POCS reconstruction. To evaluate the present ASR-TV-POCS method, both qualitative and quantitative studies were performed on a physical phantom in terms of noise reduction, contrast-to-noise ratio, and edge detail preservation.
The remaining part of this paper is organized as follows. Section 2 first describes the TV minimization based sparse-view CT imaging model in brief, and then describes the proposed ASR-TV-POCS image reconstruction algorithm in detail. The experimental setup and evaluation metrics are also presented in this section. In section 3, experimental results are reported. Finally, the discussion and conclusion are given in sections 4 and 5, respectively.
2. Methods and materials
2.1. Brief review of TV minimization based sparse-view CT image reconstruction
Sparse-view CT image reconstruction is known as an ill-posed problem. To address this issue, Sidky et al. proposed a general iterative scheme through successive and repeated applications of POCS operator with TV minimization [19]. The associative objective function can be written as follows:
| (1) |
where y = (y1, y2, ···, yM)T represents the obtained sinogram data (projections after system calibration and logarithm transformation), μ = (μ1, μ2, ···,μN)T denotes the vector of attenuation coefficients to be estimated, where ‘T’ denotes the transpose operator. The sinogram data y and the attenuation coefficients μ are related by y = Aμ. The operator A represents the system matrix with the size of M × N. In the implementation, the associated element within matrix A could be pre-calculated by using a fast ray-tracing technique [24]. ε is an error tolerance factor used to describe the inconsistency between the measurements and the desired data conditions. The term ‖μ ‖TV represents the TV operator of the to-be-reconstructed image and is defined as follows:
| (2) |
where the attenuation coefficients μ is discretized on a two-dimensional (2-D) grid, and s and t denotes the indices of the pixel location in the 2-D image grid. For solving the constrained minimization problem of (1), TV-POCS algorithm [19] and adaptive-steepest-descent-POCS (ASD-POCS) algorithm [20] can be used.
2.2. Overview of the present ASR-TV-POCS algorithm
For the combined low-mAs and sparse-view protocol, the measured data suffers from both the sparse-view sampling induced data insufficiency and the noise induced data inconsistency. In this study, to reconstruct a high-quality image in this case, we propose a two-step image reconstruction strategy (named as “ASR-TV-POCS”). We first use an ASR method to restore the noisy sparse-view sinogram data and then perform the TV-POCS image reconstruction on the restored sinogram data.
2.2.1. Adaptive sinogram restoration
Low-mAs sinogram data usually lead to the reconstructed image containing serious noise-induced artifacts. To address this issue, several statistic-based sinogram restoration methods, such as the PWLS-based and PL-based methods, have been proposed [10, 12]. However, it is worth to note that these sinogram restoration methods often suffer from noticeable resolution loss, especially in the case of constant noise variance over all sinogram data [15, 25]. In this study, the present ASR method, aiming to overcome abovementioned issues partially on low-mAs sinogram restoration based methods, contains two steps: 1) PWLS sinogram restoration; and 2) adaptive weighting. In the following subsections, we describe the two steps in detail.
1) PWLS sinogram restoration. According to the noise model of low-dose X-ray CT measurement described in our previous work [26, 27], the PWLS cost function for sinogram restoration can be written as:
| (3) |
where p represents the ideal sinogram data to estimate, and Σ is diagonal matrix with the ith element that is the variance of sinogram data yi. R(p) is the penalty term, and β is a smoothing parameter that controls the degree of agreement between the estimated and measured data.
Based on our previous study [26, 27], the variance in (3) can be determined by the following mean-variance relationship:
| (4) |
where Ii0 denotes the incident X-ray intensity along the projection path i, p̄i and are the sample mean and variance of the sinogram data along path i, respectively, and is the background electronic noise variance. In the implementation, the sample mean p̄i could be estimated by neighborhood averaging with a 3 × 3 window. The parameters Ii0 and can be measured as part of the standard routine calibration operation in modern CT systems [26].
Taking advantage of the median in statistics and probability theory [28] that the median is more robust and sensible than the mean measure for deriving probability distributions at the central tendency, thus in this work a median penalty is proposed for sinogram restoration with the following expression:
| (5) |
where Ni indicates the set of four nearest neighbors of the i–th pixel in a 2-D sinogram grid, Median(p(Ni)) denotes the local median value of pixels within the neighborhood.
For minimizing the PWLS cost function in (3) with the median penalty, a modified iterative Gauss-Seidel update scheme [10, 29] is used as follows:
| (6) |
where index m represents the iterative number.
2) Adaptive sinogram weighting. Considering some possible resolution loss of the desired-image after PWLS sinogram restoration, we propose an adaptive sinogram weighting scheme between the original noisy sinogram y and the PWLS-restored sinogram p. It can be written as:
| (7) |
where ỹ represents the weighted sinogram, and the weight wi is determined according to the variance in (4) and is calculated as wi = 1 if , and wi = 0 if , where denotes a threshold factor indicating the noise level. In this study, the parameter δ was set such that 95% of the elements in the sinogram data exhibit variance smaller than δ. Because the associative weights are determined according to the variance of the sinogram data, after the adaptive weighting, the data with high noise level in the original sinogram are replaced by the PWLS restored one to avoid possible detail loss in sparse-view CT image reconstruction.
2.2.2. TV-POCS image reconstruction
After obtaining the restored sinogram ỹ by using the present ASR method, we can reconstruct the objective image using the TV minimization model with the following expression:
| (8) |
To solve the constrained minimization problem of (8), two independent operating steps are involved, POCS operation and TV minimization, as described in [19, 20]. In the first step, an initially estimated image is updated iteratively by the POCS operation with the simultaneous algebraic reconstruction technique (SART) algorithm [30, 31]. The associative SART update scheme can be described as follows:
| (9) |
| (10) |
| (11) |
| (12) |
where ω is a relaxation parameter for updating the current estimate of the image, k indicates the iterative number, and ȳ(μ) is the re-projected data from the current estimation of the desired image. Through the SART algorithm, the initially estimated image is updated iteratively to fulfill the data constraints and an intermediate image is obtained for further iterative update in the second step by minimizing the TV of the to-be-estimated image. To solve the TV minimization problem, the gradient decent strategy is adopted similar to that described in [20].
To ensure that the solution of the objective function in (8) is an optimal estimate, the associative Karush–Kuhn–Tucker (KKT) condition should be satisfied. Borrowing the presentation in [19], the KKT condition for the TV-POCS implementation can be reached with an indicator factor cα. Mathematically, cα can be defined as
| (13) |
where d⃗TV is a vector of the derivative of the TV term, and d⃗data is a vector of the derivative of the data constraints using the Lagrangian multiplier. Sidky and Pan stated that cα = −1.0 is a necessary condition for an optimal solution for the TV minimization with sufficient data constraints [19]. However, this necessary condition with cα = −1.0 may not be satisfied unless a large number of iteration cycles are executed. Meanwhile, extensive experiments show that very small or imperceptible changes were notable in the reconstructed images when cα went below −0.6. Thus, in this study, we used cα < −0.6 as the stop criterion of TV-POCS reconstruction without loss of generality.
2.3. Pseudo-code of the present ASR-TV-POCS algorithm
Summarily, the pseudo-code for the present ASR-TV-POCS image reconstruction algorithm is listed as follows:
| ASR steps: | 1–16 |
| 1 : | initial: p0 = y; I0, , β, δ; Niter = 20; |
| 2 : | for i = 1, 2,···, M; (Data variance estimation) |
| 3 : | |
| 4 : | |
| 5 : | end for |
| 6 : | for m = 1, 2,···, Niter; (PWLS-based sinogram restoration) |
| 7 : | for i = 1, 2,···, M; |
| 8 : | |
| 9 : | end for |
| 10 : | end for |
| 11 : | for i = 1, 2,···, M; (Adaptive weighting) |
| 12 : | if , wi = 1; |
| 13 : | else, wi = 0; |
| 14 : | end if |
| 15 : | ỹi = wi · yi + (1 − wi) · pi; |
| 16 : | end for |
| TV-POCS steps: | 17–35 |
| 17 : | initial: ; s = 1, 2,···,S, t = 1, 2, ···,T; |
| 18 : | initial: ε, τ; ω = 1; |
| 19 : | while(stop criterion is not met) |
| 20 : | for k = 1, 2,···, K; (POCS) |
| 21 : | |
| 22 : | if , ; (positivity constraints) |
| 23 : | end if |
| 24 : | end for |
| 25 : | |
| 26 : | |
| 27 : | for l = 1, 2,···, L; (TV gradient descent) |
| 28 : | |
| 29 : | end for |
| 30 : | if dy < ε, ω := 0.995 · ω; |
| 31 : | end if |
| 32 : | |
| 33 : | calculate the criterion; |
| 34 : | τ:= 0.995 · τ; |
| 35 : | end if stop criterion is satisfy |
In the implementation, the initial estimate of the to-be-restored sinogram in line 1 was set to be the noisy sinogram. For an image with array size of S × T, each of the general iterations of I cycles includes K iteration cycles of POCS operation and L iteration cycles of TV minimization by gradient descent. In our experiments, the iteration cycles of K and L were set as 2 and 10. The initial estimate of the to-be-reconstructed image in line 17 was set to be uniform with pixel values of 0. In line 18, three parameters, ε, τ, and ω, are initialized before the iteration starts. Specifically, the error tolerance factor ε was initialized based on both the noise level of the data and the number of projection-views. Similar to the parameter initialization in [19, 20], both the relaxation parameter ω for the SART operator and the step-size τ for the TV gradient descent started at 1.0 and slowly decreased to 0.0 as the iteration progressed.
2.4. Experimental data acquisitions
To evaluate the performance of the present ASD-TV-POCS for low-dose CT image reconstruction, an anthropomorphic torso phantom (Radiology Support Devices, Inc., Long Beach, CA) was used for experimental data acquisition, as shown in Fig. 1(a). The phantom was scanned by a clinical CT scanner (Siemens SOMATOM Sensation 16 CT) at five exposure levels, i.e., 17, 40, 60, 80, and 100 mAs, with the tube voltage set at 120 kVp, and the phantom was scanned in a cine mode at a fixed bed position. For each exposure level, five different datasets were produced with the projection-views of 1160, 580, 290, 145, and 116. Therefore, 25 sets of data were acquired with the protocols of different combinations of mAs and projection-views. Figure 1(b) shows the CT image reconstructed by the FBP method with ramp filter from the averaged sinogram data of 150 repeatedly measured samples acquired at 100 mAs, 120 kVp, which is used as the truth image of the phantom for quantitative evaluation in this study.
Fig. 1.

The physical phantoms used in the studies. (a) illustration of an anthropomorphic torso phantom; (b) the truth image reconstructed by the FBP method with ramp filter from the averaged sinogram data of 150 repeatedly measured samples at 100 mAs, 120 kVp.
2.5. Evaluation merits
2.5.1. Evaluation by noise reduction
The following three metrics were utilized to evaluate the noise reduction on the reconstructed images from the low-dose sinogram data for quantitative comparison: (1) peak signal-to- noise ratio (PSNR) and (2) normalized mean square error (NMSE):
| (14) |
| (15) |
where μ(n) represents the intensity value at the pixel n in the reconstructed image μ, μtruth(n) represents the intensity value at the pixel n in the truth image, N denotes the number of image pixels, and max(μtruth) represents the maximum intensity value of the truth image. In this work, the NMSE metric was also used to validate and analyze the convergence of the present ASR-TV-POCS method.
2.5.2. Evaluation by image similarity
To assess the performance of various algorithms at the local detail level, the universal quality index (UQI) [32] was utilized to conduct a region of interest (ROI) based analysis by evaluating the degree of similarity between the reconstructed and truth images. Given the aligned ROI within the reconstructed and truth images, the associative mean, variance and covariance over the ROI can be calculated as:
| (16) |
| (17) |
where μ and μtruth denote the reconstructed and truth images, respectively, q is the pixel index, and Q denotes the number of pixels within the ROI. Then, the UQI can be written as
| (18) |
The UQI measures the intensity similarity between the two images, and its value ranges from 0 to 1. A UQI value closer to 1 indicates better similarity between the reconstructed and truth images.
2.5.3. Evaluation by contrast-to-noise ratio
For quantitative evaluation of the reconstructed images, we selected two different ROIs as indicated by the blue squares in Fig. 1(b) for the calculation of the contrast-to-noise ratio (CNR). The CNR is defined as:
| (19) |
where μ̄ROI is the mean of the pixel values within the ROI, and μ̄BG is the mean of the pixel values in the background region. The terms σROI and σBG are the standard deviations of the pixel values within the ROI and the background, respectively.
2.5.4. Modulation transfer function
To evaluate the resolution of the reconstructed images, the modulation transfer function (MTF) was studied in this work. For the MTF calculation, an edge spread function (ESF) was first obtained along the profile as indicated by the red horizontal line in Fig. 1(b). A line spread function (LSF) was then obtained from the derivation of the ESF. By applying the Fourier transformation to the LSF, the MTF can be obtained. In this case, normalization may be needed so that MTF(0) = 1.
2.6. Comparison methods
To validate and evaluate the performance of the present ASR-TV-POCS method, the FBP reconstructions using the ramp filter with cutoff at Nyquist frequency from the sinogram with or without ASR preprocessing were conducted, and called “FBP” and “ASR-FBP” for simplicity. The TV-POCS method described in Sidky et al. [19, 20] was also adopted for comparison. To avoid any bias on the results from the TV-POCS and ASR-TV-POCS methods because of different numerical realizations and parameter settings, both methods were implemented with the same codes, except for the step of ASR preprocessing.
3. Results
The experimental results from different algorithms were compared and analyzed through visual inspection and quantitative measures. In addition, the convergence analysis for both the TV-POCS and ASR-TV-POCS was also discussed in this section.
3.1. Visual inspection
3.1.1. Visualization-based evaluation
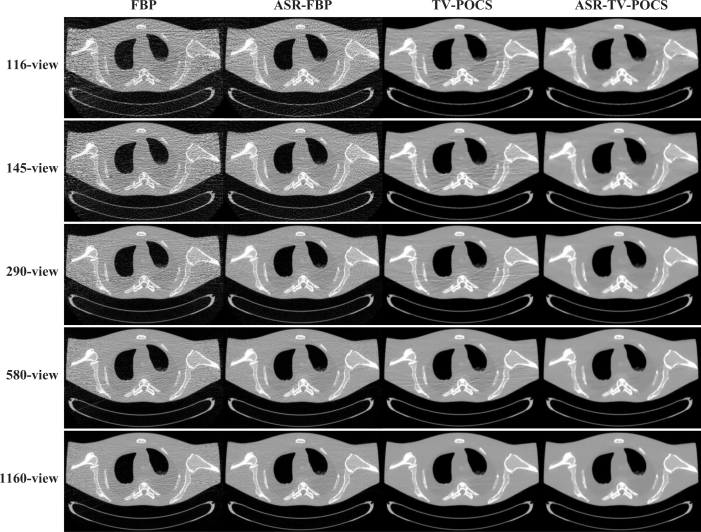
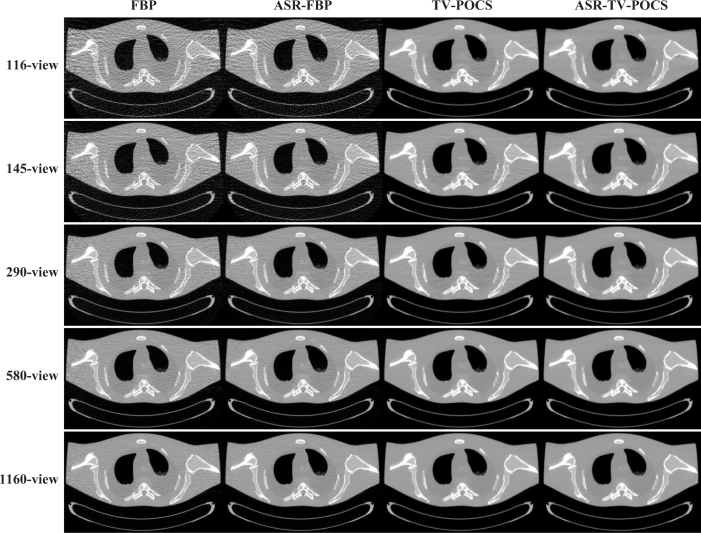
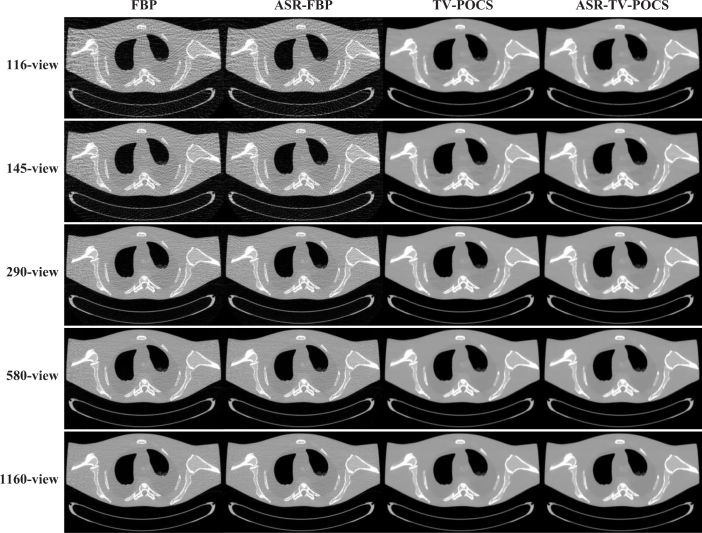
Figures 2 and 4 show the results reconstructed by different algorithms from the datasets acquired with the mAs of 17, 40, and 100, respectively. It can be observed that the images reconstructed by the ASR-FBP, TV-POCS and ASR-TV-POCS algorithms are visually better than those of FBP in all cases. Comparing the results of ASR-FBP with those of direct FBP, we can see that ASR-FBP achieves good performance in terms of both the image noise reduction and the noise-induced artifacts suppression through ASR preprocessing, especially in the low-mAs cases, i.e., 17 and 40 mAs. Although with the projection-views decreasing, the artifacts induced by the insufficient angular sampling would weaken the effect on artifacts suppression, the noise reduction by ASR-FBP remains appreciable. Comparing the results of TV-POCS and ASR-TV-POCS with those of direct FBP, it can be seen that both TV-POCS and ASR-TV-POCS algorithms have noticeable gains over direct FBP in terms of noise reduction and artifacts suppression. Hovever, in the low-mAs cases, i.e., 17 and 40 mAs, the artifacts can still be observed in the images reconstructed by TV-POCS from all five projection-view datasets. Therefore, we may say that TV-POCS, which was initially proposed under ideal noise-free conditions, has limitations in dealing with poor conditions, i.e., serious noise effect resulted from low-mAs. However, in the high mAs cases, i.e., 100 mAs, the results from TV-POCS and ASR-TV-POCS have very few or imperceptible differences in visual appearance.
Fig. 2.
The images reconstructed by the FBP, ASR-FBP, TV-POCS, and ASR-TV-POCS methods from 116, 145, 290, 580, and 1160-projection views at 17 mAs.
Fig. 3.
The images reconstructed by the FBP, ASR-FBP, TV-POCS, and ASR-TV-POCS methods from 116, 145, 290, 580, and 1160-projection views at 40 mAs.
Fig. 4.
The images reconstructed by the FBP, ASR-FBP, TV-POCS, and ASR-TV-POCS methods from 116, 145, 290, 580, and 1160-projection views at 100 mAs.
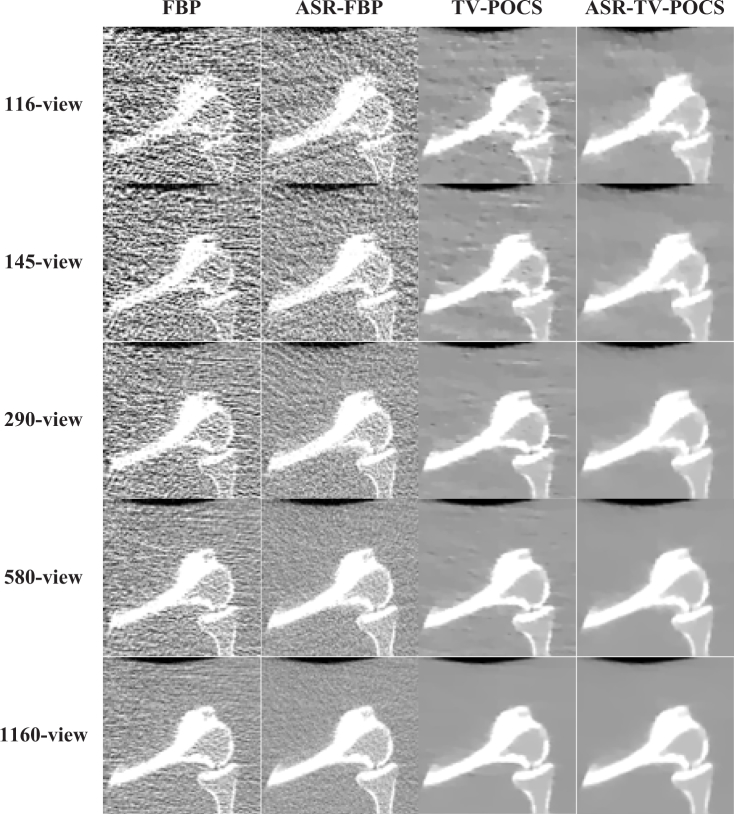
Furthermore, the zoomed details of the ROI, as indicated by the red dashed square in Fig. 1(b), within the results of 17 mAs are shown in Fig. 5 to illustrate the gains of the present ASR-TV-POCS algorithm. It can be seen that the present ASR-TV-POCS algorithm outperforms other algorithms in terms of noise reduction and artifacts suppression.
Fig. 5.
Zoomed details of the ROI in Fig. 2.
3.1.2. Profile-based evaluation
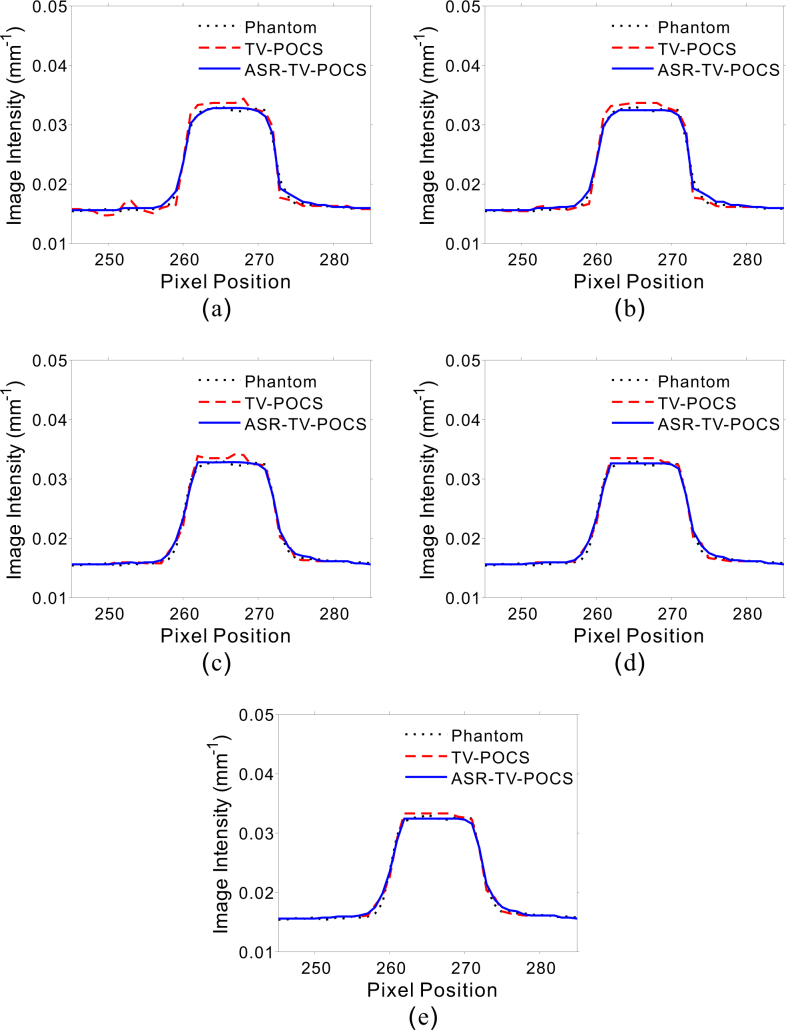
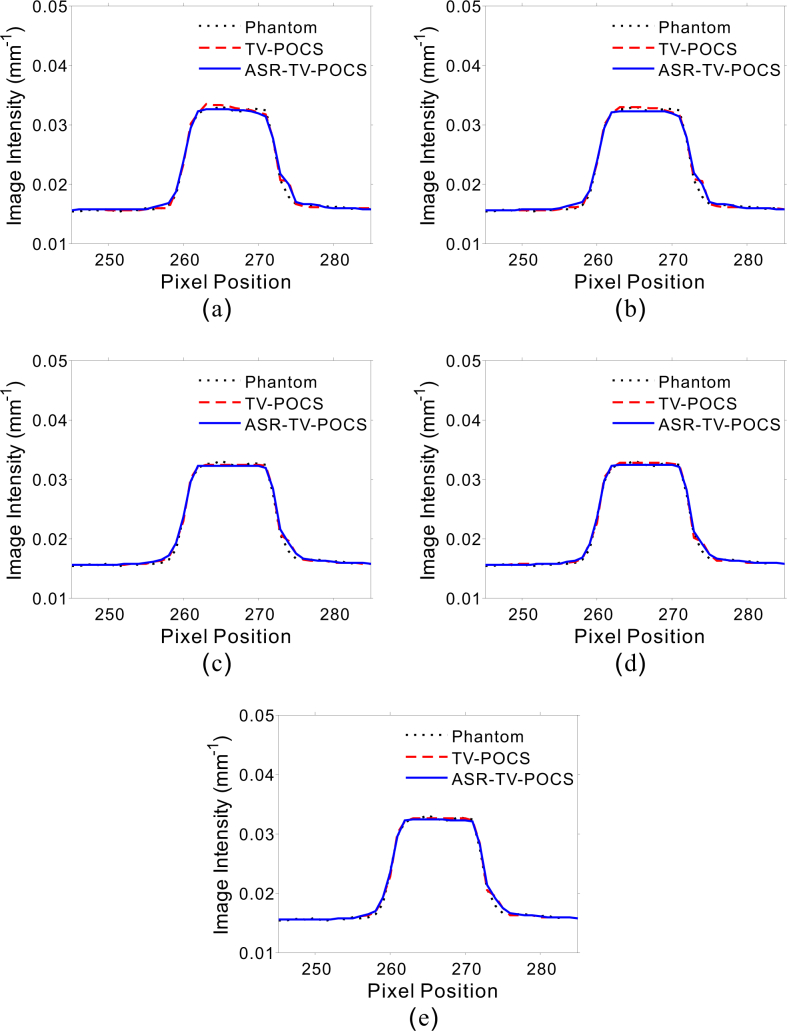
To compare the TV-POCS and the present ASR-TV-POCS methods, Figs. 6 and 7 plot the associative vertical profiles across the 245th to 285th rows at the 468th column from the results of 17 and 40mAs. It can be observed that the profiles of the results from ASR-TV-POCS are considerably closer to that of the true image than that from TV-POCS at both 17 and 40 mAs with all five projection-views. To measure quantitatively the consistency between the profiles from the true image and those from the images reconstructed by the TV-POCS and ASR-TV-POCS methods corresponding to Figs. 6 and 7, Lin’s concordance correlation coefficients from the different cases were obtained (Tables 1 and 2). The results also indicate that compared with the simple TV-POCS method, the present ASR-TV-POCS method can achieve better profiles that match the ideal ones.
Fig. 6.
Vertical profiles across the 245th to 285th rows at the 468th column from the results reconstructed by TV-POCS and ASR-TV-POCS methods at 17 mAs from the projection views of (a) 116, (b) 145, (c) 290, (d) 580, and (e) 1160.
Fig. 7.
Vertical profiles across the 245th to 285th rows at the 468th column from the results reconstructed by TV-POCS and ASR-TV-POCS methods at 40 mAs from the projection views of (a) 116, (b) 145, (c) 290, (d) 580, and (e) 1160.
Table 1.
Lin’s concordance correlation (CC) coefficient between the profiles from the true image and those from the image reconstructed by the TV-POCS and ASR-TV-POCS methods at 17 mAs.
| Views | Methods | Sample size | Lin’s CC coefficient | 95% confidence interval | p-value |
|---|---|---|---|---|---|
| 116-view | TV-POCS | 41 | 0.9926 | (0.9867, 0.9959) | p < 0.0001 |
| ASR-TV-POCS | 41 | 0.9968 | (0.9947, 0.9981) | p < 0.0001 | |
|
| |||||
| 145-view | TV-POCS | 41 | 0.9947 | (0.9904, 0.9971) | p < 0.0001 |
| ASR-TV-POCS | 41 | 0.9969 | (0.9949, 0.9981) | p < 0.0001 | |
|
| |||||
| 290-view | TV-POCS | 41 | 0.9961 | (0.9929, 0.9979) | p < 0.0001 |
| ASR-TV-POCS | 41 | 0.9974 | (0.9955, 0.9984) | p < 0.0001 | |
|
| |||||
| 580-view | TV-POCS | 41 | 0.9973 | (0.9949, 0.9985) | p < 0.0001 |
| ASR-TV-POCS | 41 | 0.9976 | (0.9957, 0.9986) | p < 0.0001 | |
|
| |||||
| 1160-view | TV-POCS | 41 | 0.9974 | (0.9952, 0.9986) | p < 0.0001 |
| ASR-TV-POCS | 41 | 0.9978 | (0.9962, 0.9988) | p < 0.0001 | |
Table 2.
Lin’s concordance correlation (CC) coefficient between the profiles from the true image and those from the image reconstructed by the TV-POCS and ASR-TV-POCS methods at 40 mAs.
| Views | Methods | Sample size | Lin’s CC coefficient | 95% confidence interval | p-value |
|---|---|---|---|---|---|
| 116-view | TV-POCS | 41 | 0.9959 | (0.9932, 0.9975) | p < 0.0001 |
| ASR-TV-POCS | 41 | 0.9966 | (0.9943, 0.9980) | p < 0.0001 | |
|
| |||||
| 145-view | TV-POCS | 41 | 0.9969 | (0.9942, 0.9982) | p < 0.0001 |
| ASR-TV-POCS | 41 | 0.9975 | (0.9948, 0.9985) | p < 0.0001 | |
|
| |||||
| 290-view | TV-POCS | 41 | 0.9973 | (0.9948, 0.9987) | p < 0.0001 |
| ASR-TV-POCS | 41 | 0.9975 | (0.9954, 0.9985) | p < 0.0001 | |
|
| |||||
| 580-view | TV-POCS | 41 | 0.9974 | (0.9949, 0.9988) | p < 0.0001 |
| ASR-TV-POCS | 41 | 0.9976 | (0.9956, 0.9986) | p < 0.0001 | |
|
| |||||
| 1160-view | TV-POCS | 41 | 0.9978 | (0.9961, 0.9989) | p < 0.0001 |
| ASR-TV-POCS | 41 | 0.9979 | (0.9965, 0.9989) | p < 0.0001 | |
3.2. Quantitative evaluation
3.2.1. Noise reduction
To evaluate quantitatively the noise reduction performance of the present ASR-TV-POCS, the PSNRs and NMSEs of the results reconstructed by different algorithms were measured in all cases. The corresponding values are listed in Tables 3 and 4. Compared with direct FBP, all three algorithms, i.e., ASR-FBP, TV-POCS, and ASR-TV-POCS, resulted in an appreciable improvement in terms of PSNR and NMSE. The present ASR-TV-POCS achieves the highest PSNR and lowest NMSE among these three algorithms. The results also demonstrate that the present ASR-TV-POCS can achieve noticeable gains over other algorithms in terms of noise and artifacts suppression.
Table 3.
PSNR (dB) measures of the results reconstructed by the four different methods.
| mAs | Views | FBP | ASR-FBP | TV-POCS | ASR-TV-POCS |
|---|---|---|---|---|---|
| 17mAs | 116-view | 16.9497 | 20.5338 | 32.6752 | 34.0324 |
| 145-view | 18.0506 | 21.7104 | 33.5324 | 34.5854 | |
| 290-view | 21.0550 | 25.2950 | 34.9461 | 36.0262 | |
| 580-view | 24.3090 | 28.9279 | 36.7447 | 37.4624 | |
| 1160-view | 27.5427 | 32.3093 | 37.7733 | 38.2918 | |
|
| |||||
| 40mAs | 116-view | 20.0626 | 21.6863 | 35.0409 | 35.2722 |
| 145-view | 21.1678 | 22.8314 | 35.6757 | 36.2402 | |
| 290-view | 24.6756 | 26.5985 | 37.7371 | 37.8855 | |
| 580-view | 28.2640 | 30.5517 | 38.2622 | 38.6150 | |
| 1160-view | 31.6701 | 34.1668 | 38.3347 | 38.6865 | |
|
| |||||
| 60mAs | 116-view | 21.2587 | 22.0740 | 35.7341 | 35.9444 |
| 145-view | 22.4605 | 23.2704 | 36.8687 | 36.9564 | |
| 290-view | 26.1021 | 27.0822 | 38.2373 | 38.4502 | |
| 580-view | 29.9948 | 31.2320 | 38.5218 | 38.6768 | |
| 1160-view | 33.6561 | 35.0743 | 38.5512 | 38.7255 | |
| 116-view | 21.9208 | 22.3529 | 36.3670 | 36.4653 | |
|
| |||||
| 80mAs | 145-view | 23.1206 | 23.5660 | 37.3681 | 37.4172 |
| 290-view | 26.9914 | 27.4973 | 38.4344 | 38.5919 | |
| 580-view | 31.1352 | 31.7663 | 38.6596 | 38.7142 | |
| 1160-view | 34.9811 | 35.7318 | 38.6622 | 38.7522 | |
| 116-view | 22.4301 | 22.6470 | 36.6651 | 36.6771 | |
|
| |||||
| 100mAs | 145-view | 23.6624 | 23.8661 | 37.7054 | 37.7195 |
| 290-view | 27.6705 | 27.9117 | 38.6482 | 38.7212 | |
| 580-view | 32.0549 | 32.3674 | 38.7372 | 38.7663 | |
| 1160-view | 36.1861 | 36.5709 | 38.7509 | 38.7962 | |
Table 4.
NMSE (10−3) measures of the results reconstructed by the four different methods.
| mAs | Views | FBP | ASR-FBP | TV-POCS | ASR-TV-POCS |
|---|---|---|---|---|---|
| 17mAs | 116-view | 405.0748 | 177.4711 | 10.8388 | 7.9299 |
| 145-view | 314.3729 | 135.3532 | 8.8975 | 6.9818 | |
| 290-view | 157.3999 | 59.2932 | 6.4253 | 5.0105 | |
| 580-view | 74.4047 | 25.6873 | 4.2466 | 3.5997 | |
| 1160-view | 35.3373 | 11.7916 | 3.3510 | 2.9739 | |
|
| |||||
| 40mAs | 116-view | 197.8073 | 136.1055 | 6.2865 | 5.9605 |
| 145-view | 153.3659 | 104.5593 | 5.4317 | 4.7696 | |
| 290-view | 68.3826 | 43.9192 | 3.3790 | 3.2655 | |
| 580-view | 29.9297 | 17.6740 | 2.9942 | 2.7606 | |
| 1160-view | 13.6615 | 7.6882 | 2.9447 | 2.7155 | |
|
| |||||
| 60mAs | 116-view | 150.1875 | 124.4819 | 5.3592 | 5.1058 |
| 145-view | 113.8819 | 94.5061 | 4.1270 | 4.0445 | |
| 290-view | 49.2368 | 39.2904 | 3.0114 | 2.8674 | |
| 580-view | 20.0919 | 15.1113 | 2.8205 | 2.7216 | |
| 1160-view | 8.6476 | 6.2384 | 2.8015 | 2.6912 | |
|
| |||||
| 80mAs | 116-view | 128.9510 | 116.7374 | 4.6324 | 4.5287 |
| 145-view | 97.8249 | 88.2880 | 3.6787 | 3.6374 | |
| 290-view | 40.1205 | 35.7090 | 2.8778 | 2.7753 | |
| 580-view | 15.4518 | 13.3622 | 2.7324 | 2.6983 | |
| 1160-view | 6.3737 | 5.3619 | 2.7308 | 2.6748 | |
|
| |||||
| 100mAs | 116-view | 114.6813 | 109.0953 | 4.3251 | 4.3131 |
| 145-view | 86.3502 | 82.3944 | 3.4038 | 3.3927 | |
| 290-view | 34.3128 | 32.4590 | 2.7396 | 2.6939 | |
| 580-view | 12.5030 | 11.6350 | 2.6840 | 2.6661 | |
| 1160-view | 4.8294 | 4.4199 | 2.6756 | 2.6478 | |
3.2.2. UQI measure
To evaluate the image similarity between the reconstructed results and the true image, we selected the ROI, as indicated by the red dashed square in Fig. 1(b), for calculating the UQI scores in all cases. The corresponding UQI scores are shown in Fig. 8. In all cases, the present ASR-TV-POCS yields higher UQI scores (more than 0.9) than other algorithms.
Fig. 8.
The UQI values of results by the FBP, ASR-FBP, TV-POCS, and ASR-TV-POCS methods from 1160, 580, 290, 145, and 116-projection views at (a) 17mAs, (b) 40mAs, (c) 60mAs, (d) 80mAs, and (e) 100 mAs.
3.2.3. CNR measure
Table 5 shows the CNRs of the results reconstructed by the four different algorithms in all cases. Evidently, the present ASR-TV-POCS can achieve significant region contrast identification, which is very important for low-dose CT image reconstruction.
Table 5.
CNR measures of the results reconstructed by the four different methods.
| mAs | Views | FBP | ASR-FBP | TV-POCS | ASR-TV-POCS |
|---|---|---|---|---|---|
| 17mAs | 116-view | 1.5716 | 2.2965 | 11.5741 | 18.0273 |
| 145-view | 1.9013 | 2.4721 | 13.5727 | 19.4408 | |
| 290-view | 2.6077 | 3.5030 | 17.9527 | 21.1393 | |
| 580-view | 3.5436 | 5.4004 | 27.7061 | 37.4360 | |
| 1160-view | 4.4914 | 7.2049 | 34.6238 | 38.9876 | |
|
| |||||
| 40mAs | 116-view | 2.4961 | 3.0681 | 15.4722 | 20.9127 |
| 145-view | 2.8017 | 3.7813 | 19.0779 | 24.4135 | |
| 290-view | 3.0881 | 4.1031 | 25.4273 | 28.1721 | |
| 580-view | 5.5786 | 6.9655 | 43.3592 | 45.8607 | |
| 1160-view | 7.5318 | 9.3623 | 49.7976 | 53.8055 | |
|
| |||||
| 60mAs | 116-view | 2.3207 | 2.6840 | 15.6362 | 22.0640 |
| 145-view | 2.4339 | 2.7271 | 26.7849 | 31.9054 | |
| 290-view | 3.9332 | 4.7478 | 39.3060 | 41.0507 | |
| 580-view | 5.8747 | 6.9673 | 60.1855 | 60.6055 | |
| 1160-view | 8.8336 | 10.0346 | 62.7326 | 64.3375 | |
|
| |||||
| 80mAs | 116-view | 3.0875 | 3.1734 | 25.9420 | 29.0968 |
| 145-view | 3.6575 | 3.8602 | 33.0278 | 44.9421 | |
| 290-view | 5.2800 | 5.4455 | 42.8485 | 46.2481 | |
| 580-view | 8.0850 | 8.2812 | 66.7918 | 67.0006 | |
| 1160-view | 9.7795 | 10.3699 | 83.4386 | 88.9086 | |
|
| |||||
| 100mAs | 116-view | 3.3557 | 3.4392 | 33.3850 | 35.3094 |
| 145-view | 3.6671 | 3.7497 | 40.4785 | 44.0944 | |
| 290-view | 5.8755 | 6.1288 | 52.1366 | 56.7234 | |
| 580-view | 8.4261 | 8.6243 | 81.6129 | 83.5234 | |
| 1160-view | 10.6703 | 11.1077 | 121.5948 | 122.5455 | |
3.2.4. MTF measure
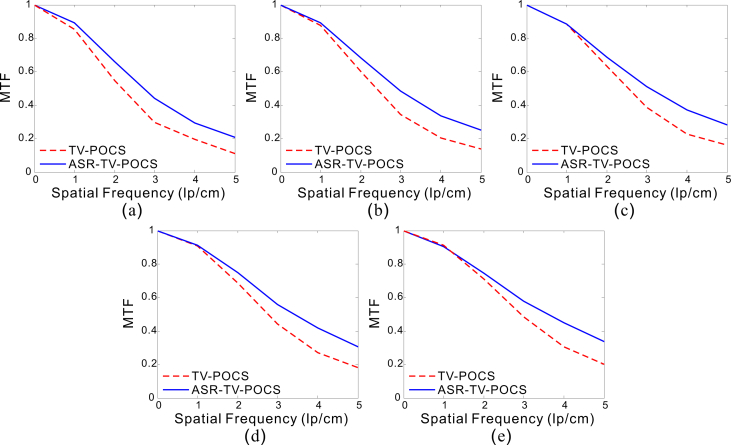
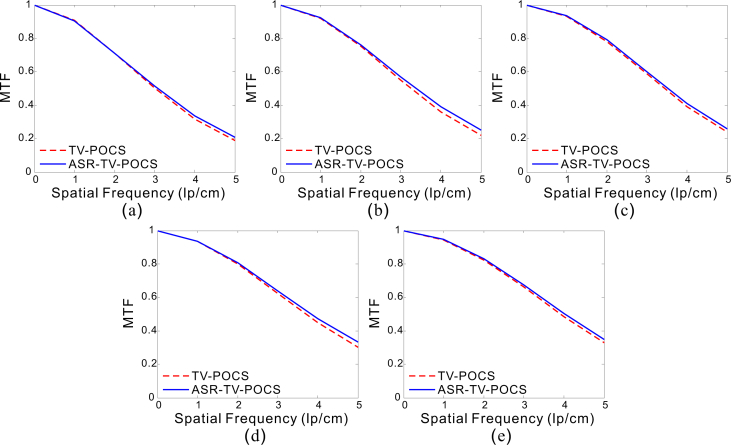
Figures 9 and 10 show the MTF curves of the results reconstructed by the TV-POCS and ASR-TV-POCS in cases of 17 and 40 mAs. It can be observed that the present ASR-TV-POCS can result in a better image resolution than the TV-POCS at both 17 and 40 mAs. The gains in the case of 17 mAs are more noticeable than those in the case of 40 mAs. This result also partially demonstrates that the ASR-TV-POCS can deal with the worse conditions than TV-POCS.
Fig. 9.
MTF curves from the results reconstructed by TV-POCS and ASR-TV-POCS methods at 17 mAs from the projection views of (a) 116, (b) 145, (c) 290, (d) 580, and (e) 1160.
Fig. 10.
MTF curves from the results reconstructed by TV-POCS and ASR-TV-POCS methods at 40 mAs from the projection views of (a) 116, (b) 145, (c) 290, (d) 580, and (e) 1160.
3.3. Convergence analysis
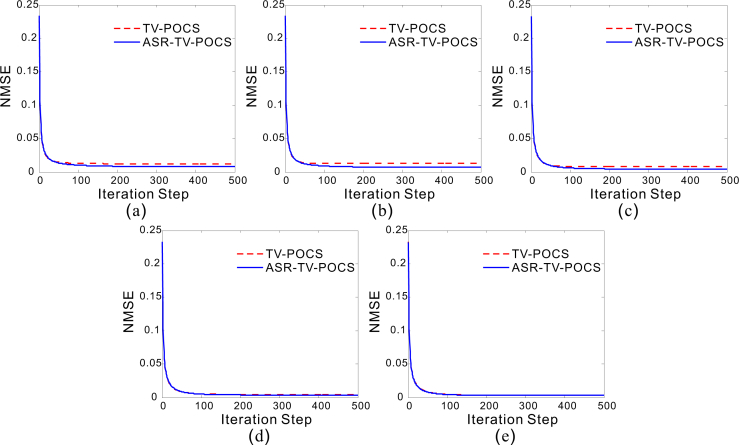
To validate and analyze the convergence of both TV-POCS and ASR-TV-POCS algorithms, the iteration steps were set to 500 without considering the stop criterion, and the NMSE of the to-be-reconstructed image in each iteration step was measured. Figure 11 shows the NMSEs with respect to the number of iterations in the case of 17 mAs. The curves with all five projection-views show that both TV-POCS and ASR-TV-POCS algorithms can yield a steady convergence solution in terms of NMSE measurements. Notably, the present ASR-TV-POCS algorithm can converge to a better solution with a lower NMSE than TV-POCS.
Fig. 11.
NMSE versus iteration step for TV-POCS and ASR-TV-POCS methods in the case of 17 mAs with the projection views of (a) 116, (b) 145, (c) 290, (d) 580, and (e) 1160.
4. Discussion
Low-dose CT image reconstruction from the projection acquired with sparse-view measurement has been extensively studied since the TV-POCS algorithm was proposed by Sidky et al. in 2006. Under the ideal noise-free conditions of each projection view, TV-POCS can achieve accurate image reconstruction even with highly under-sampled projections [19]. However, in practice, several complex factors, such as data calibration, data missing, and noise, will unavoidably violate the data consistency of the measurements. This poor condition results in the failure of the TV-POCS algorithm in spare-view CT image reconstruction. To address this issue, Sidky et al. proposed an inequality constraint with a specified tolerance to describe the data inconsistency of the measurements in 2008 [20].
To achieve the radiation dose as low as possible in CT imaging, in this work we give a preliminary study for low-dose CT image reconstruction with a combined low-mAs and sparse-view protocol. This combined protocol may provide a possible strategy to realize ultra low-dose image reconstruction in practice, but may result in data insufficiency induced by low-mAs and sparse-view sampling during data acquisition. Consequently, the results from the original TV-POCS method may suffer from noise-induced artifacts in this case. To address this problem, we presented the ASR-TV-POCS method with ASR preprocessing before TV-POCS image reconstruction. The gains from ASR-TV-POCS over TV-POCS can be observed in the case of 17 mAs through visual inspection and quantitative measurement in the section of Results. It is also worth to notice that in the case of high-mAs, the gains from the ASR-TV-POCS over the TV-POCS are not obvious with quantitative evaluation. In this work, the present ASR-TV-POCS algorithm was evaluated by performing the comparing experiments with the classical TV-POCS algorithm. As suggested by the reviewer, it would be an interesting topic to give more comparisons to other methods, such as statistical methods or techniques that include a preprocessing step prior to reconstruction.
To avoid needless sacrifice of spatial resolution for noise reduction, in the ASR preprocessing step, we proposed an adaptive sinogram restoration scheme which contains two steps: the PWLS sinogram restoration with a median penalty and the adaptive weighting. The PWLS sinogram restoration is constructed based on the noise model of low-dose X-ray CT measurement described in our previous work [26, 27], and an edge-preserving median penalty is adopted for the regularization design, different with the quadratic penalty in the previous studies [10, 12]. In addition to the statistical modeling and edge-preserving regularization design, we also introduced an adaptive weighting between the original measured data and the restored data to maintain more detailed information after sinogram smoothing through sinogram restoration. The associative weights are determined based on the variance of the sinogram data. The data with high noise level in the original sinogram are replaced by the PWLS restored one to avoid possible detail loss in sparse-view CT image reconstruction. By visual inspection between the results from the FBP and ASR-FBP methods, it can be observed that the ASR preprocessing step could achieve noise reduction without noticeable resolution loss. And the qualitative and quantitative comparison between the TV-POCS and ASR-TV-POCS methods also show that the ASR preprocessing step did not lead to the resolution loss in resulting image. In addition, the present adaptive sinogram restoration (ASR) method can also be used to the full-views case with low-mAs, and for this case we have performed several studies in our previous work [10, 13].
As for the TV-POCS and ASR-TV-POCS algorithms, it is hard to give a strict convergence proof in a mathematical form. However, the plots in Fig. 11 indicate that both the present ASR-TV-POCS and the TV-POCS algorithms can monotonically converge to their stable solutions in terms of NMSE measure. It is an interesting topic to explore the convergence of the present algorithm in the future.
5. Conclusion
In this work, we proposed a two-step image reconstruction algorithm, named as ASR-TV-POCS, for low-dose X-ray CT reconstruction with a combined low-mAs and sparse-view protocol. The two-step reconstruction schedule consists of a preprocessing step and a sparse-view reconstruction step. In the preprocessing step, an adaptive sinogram restoration method is applied for the sinogram data recovery. In the sparse-view reconstruction step, the TV-POCS algorithm is adopted. In addition to the direct TV-POCS, the preprocessing with adaptive sino-gram restoration performs well in noise reduction for noisy sinogram data, and provides better sinogram estimation compared with the noisy one. The evaluation was conducted with 25 sets of physical phantom scan data that were acquired with different combinations of mAs and projection-views. Experimental results demonstrate that the present ASR-TV-POCS method can achieve promising gains over other existing methods in terms of the noise reduction, CNR, and edge detail preservation.
Acknowledgments
This work was partially supported by the National Natural Science Foundation of China under grants (No. 81101046 and No. 81371544), the Science and Technology Program of Guangdong Province of China under grant (No. 2011A030300005), and the 973 Program of China under grant (No. 2010CB732504). Z. Liang was partially supported by the NIH/NCI under grants (#CA143111 and #CA082402).
References and links
- 1.Einstein A. J., Henzlova M. J., Rajagopalan S., “Estimating risk of cancer associated with radiation exposure from 64-slice CT coronary angiography,” J. Am. Med. Assoc. 298, 317–323 (2007). 10.1001/jama.298.3.317 [DOI] [PubMed] [Google Scholar]
- 2.Brenner D. J., Hall E. J., “CT – An increasing source of radiation exposure,” New Eng. J. Med. 357, 2277–2284 (2007). 10.1056/NEJMra072149 [DOI] [PubMed] [Google Scholar]
- 3.Kalra M. K., Wittram C., Maher M. M., Sharma A., Avinash G. B., Karau K., Halpern T. L., Saini S., Shepard J. A., “Can noise reduction filters improve low-radiation-dose chest CT images?” Pilot study Radiology 228, 257–264 (2003). [DOI] [PubMed] [Google Scholar]
- 4.Kalra M. K., Maher M. M., Toth T. L., Hamberg L. M., Blake M. A., Shepard J. A., Saini S., “Strategies for CT radiation dose optimization,” Radiology 230, 619–628 (2004). 10.1148/radiol.2303021726 [DOI] [PubMed] [Google Scholar]
- 5.McCollough C. H., Bruesewitz M. R., Kofler J. M., “CT dose reduction and dose management tools: Overview of available options,” Radiographics 26, 503–512 (2006). 10.1148/rg.262055138 [DOI] [PubMed] [Google Scholar]
- 6.Yu L., “Radiation dose reduction in computed tomography: techniques and future perspective,” Imaging Med. 1, 65–84 (2009). 10.2217/iim.09.5 [DOI] [PMC free article] [PubMed] [Google Scholar]
- 7.Yu D. F., Fessler J. A., “Edge-preserving tomographic reconstruction with nonlocal regularization,” IEEE Trans. Med. Imaging 21, 159–173 (2002). 10.1109/42.993134 [DOI] [PubMed] [Google Scholar]
- 8.Wang J., Li T., Xing L., “Iterative image reconstruction for CBCT using edge-preserving prior,” Med. Phys. 36, 252–260 (2009). 10.1118/1.3036112 [DOI] [PMC free article] [PubMed] [Google Scholar]
- 9.Ma J., Zhang H., Gao Y., Huang J., Liang Z., Feng Q., Chen W., “Iterative image reconstruction for cerebral perfusion CT using a pre-contrast scan induced edge-preserving prior,” Phys. Med. Biol. 57, 7519–7542 (2012). 10.1088/0031-9155/57/22/7519 [DOI] [PMC free article] [PubMed] [Google Scholar]
- 10.Wang J., Li T., Lu H., Liang Z., “Penalized weighted least-squares approach to sinogram noise reduction and image reconstruction for low-dose X-ray CT,” IEEE Trans. Med. Imaging 25, 1272–1283 (2006). 10.1109/TMI.2006.882141 [DOI] [PMC free article] [PubMed] [Google Scholar]
- 11.Li T., Li X., Wang J., Wen J., Lu H., Hsieh J., Liang Z., “Nonlinear sinogram smoothing for low-dose X-ray CT,” IEEE Trans. Nucl. Sci. 51, 2505–2513 (2004). 10.1109/TNS.2004.834824 [DOI] [Google Scholar]
- 12.La Rivière P. J., Bian J., Vargas P. A., “Penalized-likelihood sinogram restoration for computed tomography,” IEEE Trans. Med. Imaging 25, 1022–1036 (2006). 10.1109/TMI.2006.875429 [DOI] [PubMed] [Google Scholar]
- 13.Bian Z., Ma J., Tian L., Huang J., Zhang H., Zhang Y., Chen W., Liang Z., “Penalized weighted alpha-divergence approach to sinogram restoration for low-dose X-ray computed tomography,” in Proceeding of IEEE NSS-MIC, (2012), pp. 3675–3678 [Google Scholar]
- 14.Ma J., Huang J., Feng Q., Zhang H., Lu H., Liang Z., Chen W., “Low-dose computed tomography image restoration using previous normal-dose scan,” Med. Phys. 38, 5714–5731 (2011). 10.1118/1.3638125 [DOI] [PMC free article] [PubMed] [Google Scholar]
- 15.Bian Z., Ma J., Huang J., Zhang H., Niu S., Feng Q., Liang Z., Chen W., “SR-NLM: A sinogram restoration induced non-local means image filtering for low-dose computed tomography,” Comput. Med. Imaging Graph. 37, 293–303 (2013). 10.1016/j.compmedimag.2013.05.004 [DOI] [PMC free article] [PubMed] [Google Scholar]
- 16.Mendrik A. M., Vonken E. J., Rutten A., Viergever M. A., van Ginneken B., “Noise reduction in computed tomography scans using 3-D anisotropic hybrid diffusion with continuous switch,” IEEE Trans. Med. Imaging 28, 1585–1594 (2009). 10.1109/TMI.2009.2022368 [DOI] [PubMed] [Google Scholar]
- 17.Borsdorf A., Raupach R., Flohr T., Hornegger J., “Wavelet based noise reduction in CT-images using correlation analysis,” IEEE Trans. Med. Imaging 27, 1685–1703 (2008). 10.1109/TMI.2008.923983 [DOI] [PubMed] [Google Scholar]
- 18.Li Z., Yu L., Trzasko J. D., Lake D. S., Blezek D. J., Fletcher J. G., McCollough C. H., Manduca A., “Adaptive nonlocal means filtering based on local noise level for CT denoising,” Med. Phys. 41, 011908 (2013). 10.1118/1.4851635 [DOI] [PubMed] [Google Scholar]
- 19.Sidky E., Kao C., Pan X., “Accurate image reconstruction from few-views and limited-angle data in divergent beam CT,” J. X-Ray Sci. Technol. 14, 119–139 (2006). [Google Scholar]
- 20.Sidky E., Pan X., “Image reconstruction in circular cone-beam CT by constrained, total-variation minimization,” Phys. Med. Biol. 53, 4777–4807 (2008). 10.1088/0031-9155/53/17/021 [DOI] [PMC free article] [PubMed] [Google Scholar]
- 21.Liu Y., Ma J., Fan Y., Liang Z., “Adaptive-weighted total variation minimization for sparse data toward low-dose x-ray computed tomography image reconstruction,” Phys. Med. Biol. 57, 7923–7956 (2012). 10.1088/0031-9155/57/23/7923 [DOI] [PMC free article] [PubMed] [Google Scholar]
- 22.Liu Y., Liang Z., Ma J., Lu H., Wang K., Zhang H., Moore W., “Total variation-stokes strategy for sparse-view X-ray CT image reconstruction,” IEEE Trans. Med. Imaging, 33, 749–763 (2014). 10.1109/TMI.2013.2295738 [DOI] [PMC free article] [PubMed] [Google Scholar]
- 23.Liu N., Gao Y., Bian Z., Huang J., Chen W., Yu G., Liang Z., Ma J., “Sparse-view x-ray CT reconstruction via total generalized variation regularization,” submitted to Phys. Med. Biol. (PMB-100428), in press. [DOI] [PMC free article] [PubMed]
- 24.Han G., Liang Z., You J., “A fast ray-tracing technique for TCT and ECT studies,” in Proceeding of IEEE NSS-MIC, (Seattle, WA, 1999), pp. 1515–1518 [Google Scholar]
- 25.Wang J., Lu H., Liang Z., Eremina D., Zhang G., Wang S., Chen J., Manzione J., “An experimental study on the noise properties of X-ray CT sinogram data in radon space,” Phys. Med. Biol. 53, 3327–3341 (2008). 10.1088/0031-9155/53/12/018 [DOI] [PMC free article] [PubMed] [Google Scholar]
- 26.Ma J., Liang Z., Fan Y., Liu Y., Huang J., Li L., Chen W., Lu H., “Variance estimation of X-ray CT sinogram in radon domain,” in Proc. SPIE 8313, 83132G (2012). 10.1117/12.911669 [DOI] [Google Scholar]
- 27.Ma J., Liang Z., Fan Y., Liu Y., Huang J., Chen W., Lu H., “Variance analysis of x-ray CT sinograms in the presence of electronic noise background,” Med. Phys. 39, 4051–4065 (2012). 10.1118/1.4722751 [DOI] [PMC free article] [PubMed] [Google Scholar]
- 28.Milasevic P., Ducharme G. R., “Uniqueness of the spatial median,” The Annals of Statistics 15, 1332–1333 (1987). 10.1214/aos/1176350511 [DOI] [Google Scholar]
- 29.Sauer K., Bouman C., “A local update strategy for iterative reconstruction from projections,” IEEE Trans. Signal Process. 41, C534–C548 (1993). 10.1109/78.193196 [DOI] [Google Scholar]
- 30.Andersen A., Kak A., “Simultaneous algebraic reconstruction technique (SART): a superior implementation of ART Ultrason,” Imaging 6, 81–94 (1984). [DOI] [PubMed] [Google Scholar]
- 31.Jiang M., Wang G., “Convergence of the simultaneous algebraic reconstruction technique (SART),” in Proceeding of 35th Asilomar Conf. on Signal, Systems and Computers, (2001), pp. 360–364 [DOI] [PubMed] [Google Scholar]
- 32.Wang Z., Bovik A. C., “A universal image quality index,” IEEE Signal Process. Lett. 9, 81–84 (2002). 10.1109/97.995823 [DOI] [Google Scholar]


