

Abstract
Mass spectrometry (MS) is a powerful analytical method for the identification and quantification of co-existing post-translational modifications in histone proteins. One of the most important challenges in current chromatin biology is to characterize the relationships between co-existing histone marks, the order and hierarchy of their deposition, and their distinct biological functions. We developed the database CrossTalkDB to organize observed and reported co-existing histone marks as revealed by MS experiments of histone proteins and their derived peptides. Statistical assessment revealed sample-specific patterns for the co-frequency of histone post-translational modifications. We implemented a new method to identify positive and negative interplay between pairs of methylation and acetylation marks in proteins. Many of the detected features were conserved between different cell types or exist across species, thereby revealing general rules for cross-talk between histone marks. The observed features are in accordance with previously reported examples of cross-talk. We observed novel types of interplay among acetylated residues, revealing positive cross-talk between nearby acetylated sites but negative cross-talk for distant ones, and for discrete methylation states at Lys-9, Lys-27, and Lys-36 of histone H3, suggesting a more differentiated functional role of methylation beyond the general expectation of enhanced activity at higher methylation states.
Nucleosomes contain highly conserved proteins, histones, that are decorated with reversible covalent modifications, e.g. acetylation, mono-, di-, and trimethylation, and phosphorylation. PTMs1 of histone proteins play an important role in maintaining chromatin structure and in the dynamic regulation of DNA replication and repair, transcription of genes, and propagation of epigenetic traits. According to the early “histone code” hypothesis (1, 2), various distinct combinations of PTMs, e.g. acetylation, mono-, di-, and trimethylation, and phosphorylation at distinct amino acid residues in histones, have specific functions. In recent years, it has become evident that histone marks, i.e. co-existing PTMs, play a fundamental role in transcriptional and epigenetic regulation of the genome, and research is now directed toward improving our understanding of inter- and intramolecular PTM cross-talk in histone proteins and other types of proteins.
Proteins potentially have many different functions if the PTMs act in a combinatorial manner, i.e. there is PTM cross-talk. Different combinations of PTMs might change the chemical properties resulting in conformational changes, distinct activities, and/or the recruitment of different interacting molecules. Generally, one distinguishes between positive and negative cross-talk (3). Positive cross-talk leads to over-representation of PTM combinations, where one PTM triggers the addition of another PTM at a different residue either directly or indirectly through binding proteins. For instance, it was demonstrated that there is a correlation between methylation marks on H3K4 (lysine residue at position 4 of histone H3) and acetylation marks on other lysine residues of H3 (4, 5). Another example is the repressive H3K27me3 mark and the activating H3K4me3 mark, which form bivalent domains that maintain the repressive state of genes and that may be abrogated upon differentiation of the cell (6). Negative cross-talk results from direct competition for a single residue, such as methylation and acetylation of the same lysine residue, or indirectly by changing the protein state preventing addition and recognition of the competing PTM (3). Although identification of competition of marks for a single residue is an immediate consequence of chemical properties, proving indirect competition is more difficult and often relies on analyzing data for anti-correlations, therefore requiring experimental methods with high resolution and advanced statistical tools to provide high confidence results. From anti-correlation assessments, several histone PTMs are assumed to be mutually exclusive (7–9). Furthermore, some of the interactions leading to negative cross-talk could be experimentally shown, e.g. that the activating H3K4me3 mark inhibits the methylation of H3K9 by SUV39h (10, 11).
The vast amount of information that can be carried by histone marks may be best understood by the following example. Take a small peptide of histone H3.1, consisting of the first 10 amino acids ARTKQTARKS. This peptide can have 19 different single modifications (acetylation, mono-, di-, and tri-methylation, phosphorylation, biotinylation, and citrulination at different residues), some of which are mutually exclusive because they cannot occupy a given amino acid residue at the same time. The number of combinations results in 60 different modified peptides. The number of combinations grows exponentially with the size of the peptide leading to millions of different multiply modified histone forms and therefore a code of high complexity. Hence, the variety of possible effector molecules that read specific combination patterns is immense.
Given the fact that nucleosomes are octamers of histone proteins, i.e. 2×(H2A, H2B, H3 and H4), and that each histone type comes in several amino acid sequence variants and with different PTM marks, it then follows that the number of different combinations of histone sequences and marks is very high, for instance exceeding 10,000 potential histone proteoforms of histone H4 (12). For detailed information about human histone variants and their sites of PTMs, see the HIstome Database (13).
One of the most powerful experimental techniques for the characterization of modified histones uses chromatin immunoprecipitation experiments combined with microarray technology (ChIP-chip) or new sequencing technology (ChIP-seq), thus enabling the researcher to identify the associated DNA sequences and locate the genomic position. By using different antibodies, distinct histone marks can be investigated. Genome-wide ChIP-seq experiments help to map marks to gene promoters. An analysis of combinatorial patterns of histone modifications at promoters identified general patterns for different expression stages (8, 14, 15). Although these studies found evidence that the histones are simultaneously modified by a large number of marks, no direct evidence can be provided by ChIP-chip and ChIP-seq experiments. Several disadvantages of these techniques can be highlighted as follows. (i) They are costly and thus can be carried out in only a few laboratories. (ii) Antibodies can be nonspecific or blocked by other modifications; for instance, the phosphorylation of H3S10 blocks the access of H3K9 antibodies and methyltransferases that methylate this amino acid (16). (iii) The quality of many commercially produced antibodies is still unsatisfactory (17). (iv) Few antibodies exist for combined histone marks.
Mass spectrometry (MS) and liquid chromatography provide a powerful tool to measure abundances of proteins and their PTMs (18), and therefore MS experiments are widely used to study histones and their marks (19–22). Unfortunately, some drawbacks must be considered. (i) Spatial information about the position on the genome can only be obtained by pre-processing the sample and extracting the chromatin corresponding to a specific genomic region. (ii) Up to now, the analysis of intact histones is possible but not extended to large scale studies, due to enhanced technical challenges compared with traditional peptide analysis. Histones are preferably digested to gain enough resolution to distinguish between modifications. For instance, trimethylation and acetylation have the same nominal mass, and only some mass spectrometers have sufficient resolution and mass accuracy to distinguish between them (23, 24). Moreover, after digestion, only small peptide fragments remain, and histone marks that are distant from each other cannot be related.
A recently developed experimental strategy, known as “middle-down” proteomics, allows the characterization of entire histone tails in a large scale manner, reaching a compromise between the high instrumentation performance requirements for intact protein analysis and the more traditional and less informative screening of digested peptides (25). With this method, larger histone peptides (5–7 kDa), in particular the N terminus where most of the modifications reside, can be investigated. Hundreds of combinatorial modifications have been already identified (26–28), and future experiments will be able to identify multiply modified histones even when the marks are located far from each other. The middle-down strategy is suitable to directly measure the co-occurrence of multiple histone PTMs located on distant residues compared with commonly performed “bottom-up” MS. For a more comprehensive overview of the different MS-based proteomic strategies for histone analysis we recommend our recently published review (22).
We anticipate an increasing number of data coming from this type of experiment. Therefore, we identified the need for a structured approach to harvest, store, and interrogate this wealth of information on histone marks. We hypothesize that data mining of large scale genomics and proteomics datasets will reveal functional combinations of histone PTMs and PTM cross-talk and provide novel insights into genomic and epigenetic regulation.
We report a database, CrossTalkDB, of co-existing histone modifications that is designed to store, analyze, and compare the features and abundances of distinct co-existing histone marks, as determined experimentally by MS. We populated the database with publicly available data (26) and the results obtained in our own laboratory (27–29). The query tools enable the comparison of histone marks across different cell types and across biological experiments and even between different species. We developed statistical tools to investigate the underlying rules for combinatorial marks in nucleosomes. We find cross-talk between acetylated and methylated lysines on histone H3 not only confirming the already reported interplay but also revealing novel insight into distinct functions of different methylation states, thereby proving the utility of the CrossTalkDB database.
MATERIALS AND METHODS
Database and Web Interface
The database software consists of two interacting main modules, one for data storage/organization and one providing a user-friendly web interface. Fig. 1 shows the scheme of the software structure, including database, interaction layer, and web interface. The database core consists of a MySQL server, and the web interface uses the JavaServer Faces framework. Both servers are currently running on a common personal computer. The modular setup allows for straightforward integration of the database with other software packages. CrossTalkDB is publicly accessible through the URL http://crosstalkdb.bmb.sdu.dk.
Fig. 1.
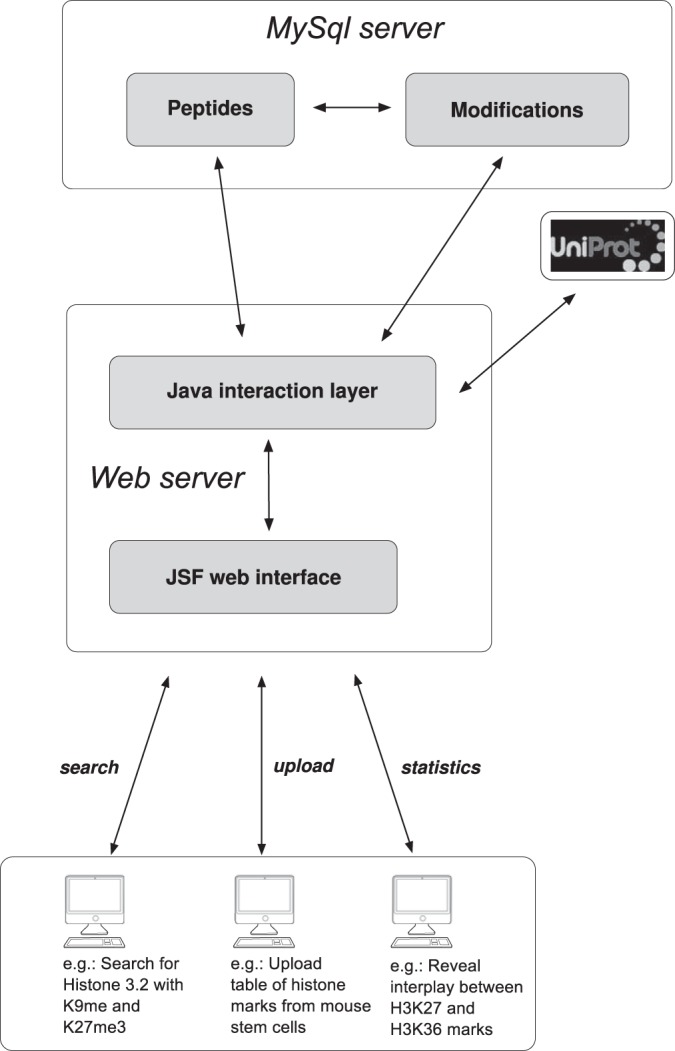
Scheme of the developed software. The data are stored in two linked MySql databases, and additional information is added from the UniProt server when uploading the data. The user can upload and download data, search the database, and carry out statistical analysis of the dataset obtained through the search.
Database Structure
The database contains the amino acid sequences of histone-derived peptides, intact histone proteins, and their modifications, as reported by proteomics experiments by MS. Amino acid residues are reported by using the standard one-letter code. The post-translational modifications are annotated by their Unimod number (30) or the commonly used abbreviation. The Brno nomenclature (31) is used to annotate and report histone marks. For example, di-methylation of lysine 4 and phosphorylation of serine 10 of histone H3, H3K4me2S10ph.
To achieve optimal performance for data input/output and database searching and statistical analysis, the peptide data was organized in two linked databases, separating general peptide sequence information from PTM annotation and features. Data are uploaded as a list by the user (as generated by a protein sequence database search engine, such as Mascot (32), SEQUEST (33), or X!Tandem (34)).
CrossTalkDB is designed to collect and analyze data coming from MS experiments that provide measurements of multiply modified histone tails or even entire histone proteins. Data from bottom-up experiments are also accepted, but such data are limited to the analysis of nearby PTMs due to too short peptide lengths. Each entry in the database contains data for a given modified peptide, including the associated UniProt accession number of the cognant protein, protein name, species of origin, and cell type or tissue specification, the amino acid sequence of the peptide, and the types and positions of PTMs.
New data tables can be uploaded. A template is available from the database website. Each upload generates a specific identifier (e.g. CrDB000010) for the data set. Each entry requires only a UniProt accession number, the peptide sequence, and the PTMs. Other information is optional. The entries do not contain information regarding peptide or PTM score obtained from database searching; therefore, results must be previously filtered for accordingly set confidence thresholds. We recommend the use of high mass resolution MS/MS (>15,000) to achieve sufficient mass accuracy to discriminate trimethylation (42.047 Da) from acetylation (42.011 Da). During the file upload process, the database is automatically retrieving the complete protein sequence and its annotations from the UniProt database (35). Additionally, bibliographic information and experimental details can be included, e.g. by providing a link to the original experimental data files (mass spectral data). This additional information should enable the user to find details on the original experimental design, setup, and analysis. Data without well defined origin (laboratory or paper reference) or lack of experimental details (e.g. no given cell type) might be removed from the database.
It is possible to include quantitative measurements of peptide abundance; however, this information is not used for statistical analysis in the current version of the database system, as they commonly lead to less accurate estimation of PTM abundance, due to the difficulties to separately quantify co-eluted and co-fragmented isobaric peptides. Instead, datasets are interrogated by using a spectral counting approach based on the number of times a given peptide was identified in the dataset, as we previously proved to be effective for long (50–60 amino acids) and heavily modified peptides (28). Therefore, it is important to upload also multiple identifications of the same histone modification pattern. In our in-house work flow, we convert the output of the Mascot engine to include the Brno nomenclature for peptide PTMs. The adaptation of the output from other search engines and subsequent software modules should be straightforward.
Web Interface
A Java-based graphical user interface allows users to interact with the database via a web browser, such as Firefox or Chrome. Users can upload their own data to the database, browse existing data, or download the complete dataset or subsets thereof. There is no restriction to access any uploaded data. The data can be searched, downloaded, and analyzed using the statistical tools provided in the software package. Each uploaded data set can be directly accessed via “Available data sets,” Fig. 2 shows the data table for one of the uploaded data sets.
Fig. 2.

Graphical user interface and associated tools can analyze and present the data in several ways. The presented view reports the experimentally observed histone marks using the Brno nomenclature. Data tables are downloadable for further analysis in other software packages.
The user can use the statistical analysis interface to view and analyze selected peptides and their PTMs. The analysis provides insight into histone PTM distributions and their cross-talk for systems, for which the peptides were preselected by specific search patterns such as cell types and protein isoforms. Individual peptide sequences or smaller sequence subsets can be further interrogated. For the chosen peptides, several graphical outputs provide an easy to interpret overview of the data (Fig. 3). We recommend usage of Chrome to visualize these graphical outputs. It is possible to combine peptides from different histone variants such as H3.1, H3.2, and H3.3 to investigate general patterns, e.g. within all histone H3 proteins. Pie chart and histogram representations are used to visualize the distribution of multiple PTMs within the peptides. Therefore, the software takes the peptides selected by the user and creates statistics about the distribution of the number of PTMs as well as the distribution of PTM types at each residue.
Fig. 3.

Enumeration and statistical analysis of the peptides and their post-translational modifications provides easy to interpret graphical overviews of large datasets. Specific peptide sequences can be chosen to be included in statistical evaluation. The pie chart shows frequency of peptides with n modifications. The colored bar plot depicts the distribution of different modifications per site. Most abundant PTM pairs are shown in the bottom plot.
The software also determines the frequency of PTM pairs, providing detailed information about combinatorial marks that characterize certain cell states. Co-occurrence frequencies of PTM pairs, hereafter denoted co-frequencies, provide global information about histone PTM combination within all chromosomes and thus characterize the overall cell state. Changes of these patterns can be understood to alter the epigenetic program, with potentially strong impact on cell phenotype. Co-frequencies are determined by summing up the number of peptides that have a certain PTM combination.
To obtain a complete picture of all co-occurring PTMs in the peptide set, the software generates a co-frequency graph. The nodes correspond to the histone marks, whereas the edge/link strength is defined by frequency of the respective modification pair. The graph can be modified by removing histone marks and spatially arranging the modifications.
Histone modifications that do not cross-talk co-occur only by chance. The more abundant a modification, the more likely it is to co-occur with other modifications. More precisely, the two completely independent marks 1 and 2 would co-occur with probability f1f2, where f1 and f2 are the probabilities of marks 1 and 2 in the dataset. Positive and negative interplay between two marks leads to co-frequencies larger or smaller than this value, i.e. these PTMs are over- or under-represented. Therefore, the dataset is corrected by dividing normalized co-frequencies by the product of the normalized abundances of both marks in the dataset. Modification pairs that were not found to co-occur at all were assigned a co-frequency value of one-tenth of the smallest measured co-frequency. Correction is carried out by calculating relative amounts of modification abundance and co-frequencies, ensuring that the sum over all peptides is one. For instance, 14 of a total of 200 peptides with H3K9me3K27ac, and H3K9me3 identified in 120 and H3K27ac in 16 peptides, leads to an interplay value of (14/200)/[(120/200]·(16/200)] ≈ 1.46. The interplay values are conveniently dealt with by taking the logarithm (e.g. log2(1.46) = 0.55) and providing the same weight to over- and under-representations. A negative log value therefore corresponds to mutual exclusion, indicating competition between the two marks, whereas positive interplay reveals enhanced, correlated cross-talk. See Table I for a detailed mathematical description of histone PTM frequency, co-frequencies, and interplay values. Details on these values and their comparison for different datasets are presented below.
Table I. Description of histone PTM frequency, co-frequencies and interplay values.
| Observable | Description | Formula | |
|---|---|---|---|
| Peptide PTMs | Modified residues r and their PTMs m | m→ = {(r1, m1), (r2, m2), …, (rn, mn)} | |
| Peptide frequency | Number of peptides with PTMs →m | Fm→ | |
| Total peptide number | All peptides | ||
| Frequency | Number of peptides with PTM a on residue r | Fa,r = F(a,r) in m→ | |
| Co-frequency | Number of peptides with PTMs (a, r) and (b, s) | Fa,r;b,s = F{(a,r), (b,s)} in m→ | |
| Interplay value | Normalized frequency of PTMs (a, r) and (b, s) |
RESULTS
Co-frequency and Interplay Patterns Between Experiments
Many laboratories are using MS analysis to annotate PTMs of proteins, including histones. By now, it is evident that histones contain a plethora of co-existing PTMs, generating many histone proteoforms. The database allows us to store such data and extract detailed information of the experimentally observed combinations of PTMs in histones. Histone PTM co-frequencies and interplay values provide details about the features of histone “language,” which allow us to characterize different cell states and to provide evidence for cross-talk. We illustrate these features using four different datasets. Table II summarizes the experimental data used to assess the power of co-frequency and interplay graphs. The datasets represent measurements of the N-terminal tails of histone H3 for different experimental setups, different cells, and different species. Quantitation was based on spectral counting for all datasets but dataset A, where we used the provided approximate abundance values as we did not have access to the individual peptide measurements. The respective graphs for dataset A were obtained with in-house software modules. Abundance values were called approximate by the authors of the original work and were therefore mainly used to identify general trends.
Table II. Details on experimental data of measurements of modifications on histone 3 (H3) tails.
| Experiment | Cell type | Species | Cell treatment | Identifications (unique) | Refs. |
|---|---|---|---|---|---|
| A | HeLa cells | Human | iHDAC | – (204) | (26) |
| B | Stem cells | Mouse | None | 374 (114) | (28) |
| C | Stem cells | Mouse | None | 2706 (313) | (27) |
| D | Suz12−/− stem cells | Mouse | Genetrap vector* | 2536 (320) | (27) |
* Genetrap vector inactivates Suz12 due to fusion protein gene insertion (43).
As shown in Fig. 3 (dataset C, Table II), we identified a large number of multiply modified histone peptides, with a majority of peptides having two or three modified amino acid residues, although the number of unmodified peptides was low, thereby confirming the large combinatorial power of a potential histone mark language yielding different functional states with respect to the combinatorial “code” on the histone. More detailed information of the identified PTMs is provided in the upper right panel of Fig. 3 that reports the distribution of PTMs per amino acid residue. The figure helps to find abundant patterns, e.g. highly abundant Lys-27 and Lys-36 PTMs with predominating dimethylated marks. We can distinguish three classes with different predominant histone marks on histone H3 residues, having predominant acetylation (Lys-18,Lys-23), di-methylation (Lys-27,Lys-36), or mono-methylated states (Lys-4,Lys-9).
Fig. 3 (bottom panel) exhibits the 12 most abundant modification pairs that were detected. As expected, K27me2K36me2 is the most abundant mark. This makes the marks K27me2 and K36me2 powerful regulators as changes in their abundance will also lead to a different distribution of cross-talking third marks within the chromosomes, with potentially strong influence on gene transcription.
The co-frequency network provides an overview of the combinatorial PTMs (Fig. 4). The network is highly interconnected, showing co-frequencies for nearly all modification pairs. However, interactions between K27me2, K36me2, K9me1, and K23ac dominate the picture, making it difficult to assess co-frequencies of less abundant marks. To visualize these patterns and to reveal underlying rules for the histone modification cross-talk, it is convenient to convert the graph into an interplay graph.
Fig. 4.

Co-frequency graph. The thickness of an edge corresponds to the number of observations of the modification pair.
The work flow presented in Fig. 5 shows our approach to obtain an optimal picture of results coming from multiple middle-down MS experiments. By inspection of PTM abundances, we determined the distribution of different PTMs both for each residue as well as within an entire dataset. Co-frequency plots help to detect pairs of histone marks that dominate a certain cell type and to investigate their changes upon perturbation. Moreover, interplay graphs display the underlying cross-talk rules, by highlighting the PTM pairs that are under- or over-represented. Finally, we identified general trends and features of cross-talk among the different datasets, as discussed below.
Fig. 5.

General work flow for the analysis. Different biological samples (see Table II) are analyzed by MS, and the results were uploaded to the database. Abundance and co-frequency graphs allow the identification of specific changes of epigenetic patterns between different cell types, for example. On the other side, the interplay graphs allow to detect rules for cross-talk, which might be cell type-specific or cell type-independent. The statistical assessment of the interplay values exhibits global rules for histone PTM cross-talk. The results from A were generated with in-house tools and not with CrossTalkDB (sample B–D).
Cell State Specific Co-frequency Patterns
With co-frequencies, we are able to quantify changes of the epigenetic landscape of cells. In Fig. 5, we show the co-frequency graphs for experiments A–D depicting the methylations on lysines 9, 27, and 36 of histone H3. Co-frequency patterns are similar between datasets B and C as could be expected, because both datasets originate from measurements of untreated mouse stem cells with two different experimental approaches. Data set D measures mouse stem cells where the protein Suppressor of Zeste 12 (Suz12), a component of the Polycomb repressive complex 2 (PRC2), was knocked out. Because PRC2 is responsible for setting the H3K27me2/3 marks (36), co-frequencies between H3K27me2/me3 and the other marks show a drastic decrease. The co-frequencies show how the knock-out affects other supposedly unrelated histone marks as for example K9me2K36me1. Hence, co-frequency graphs provide a powerful method to detect how the epigenetic landscape changes for different cell states, cell treatments, cell types, or even different species. Co-frequency strength between the depicted marks in dataset A was not as high as for the other sets. Furthermore, the pattern of dataset A shows significant differences to the other datasets, revealing high frequencies of K9me1K27me3, K9me3K27me1, and K9me1K36me3. These combinatorial marks were almost not detected in B–D. We can only speculate whether this result comes from distinct species (A, human cell line; B–D, mouse cell lines), different quantitation methods, or from the usage of a histone deacetylase inhibitor (stimulation by sodium butyrate as histone deacetylase inhibitor).
Global Cross-talk Patterns
Whereas the co-frequency graphs are suitable for the investigation of different cell states, the interplay values should provide a deeper understanding of the underlying rules of histone PTM combinations. Fig. 5 shows interplay values for the datasets A–D. We observe similarity between interplay patterns even preserved between datasets C and D. Assuming that this similarity is maintained for different experimental setups, different cell states, and even different species, we state the following conjecture: by rescaling co-frequency patterns, we are able to reveal binary cross-talk between different modifications.
Assuming that peptide abundances approximately follow a log-normal distribution, the interplay values can be described by a normal distribution (the equation for the interplay values in Table I can be written as a sum of the logarithm of peptide abundances). To identify preserved cross-talk features, we carried out a one-sample two-sided t test on the interplay values. For each pair of PTMs present in at least three of the four data sets A–D, we applied the test on the interplay values. Conserved interplay is identified for p values below ⅓ after correction for multiple testing (37), accepting that every third identification might be a false-positive. Nonetheless, we do not apply the test to detect cross-talk with high accuracy but rather assess the results by comparison with already known interplay as proof of concept. Future comparisons of additional different datasets will provide much higher confidence as appropriate statistical methods can be applied.
Fig. 6 illustrates the interplay values for Lys-9, Lys-27, and Lys-36 methylations of Fig. 5 as heat maps. Furthermore, it shows the modification pairs that were consistent in all datasets. The negative interplay between tri-methylations of Lys-9, Lys-27, and Lys-36 can be confirmed for all datasets except K27me3K36me3 in dataset D where the knock-out leads to dramatic depletion of K27me3. K9me3 and K27me3 chromatin domains do not overlap but have a sharp transition as reported previously (7, 38). We also confirm that K27me3 rarely co-exists with K36me2 or K36me3 (39). It is remarkable that the individual interplay values between Lys-9 methylations and both Lys-27 and Lys-36 methylations exhibit very similar trends. The results show mutual exclusion of identical methylation states but unexpected positive interplay between di- and tri-methylations, resulting in a X-like shape of the heat maps. For instance, we identify positive interplay between K9me3 and K36me2 as well as K9me2 and K36me3. This result challenges the common notion that a higher methylation state induces a higher functional state leading to increased cross-talk. As a consequence, our results suggest a more complex machinery that gives these different combinations a completely different joint function. For example, changing the state of K36me1 to K36me2 might have impact on the other marks on the histone tail, leading, for instance, to an increase of K27me1 to K27me2 (we found negative cross-talk for K27me1K36me2 and positive cross-talk for K27me2K36me2).
Fig. 6.

Modification interplay of the individual experimental data A–D (top panels) and significant patterns for Lys-9, Lys-27, and Lys-36 methylations (bottom panels). Positive and negative interplay is represented in green and red, respectively. The detection of patterns that were preserved between the different datasets was based on a t test (p = 1/3).
A graph of all extracted modification combinations and their average interplay values is shown in supplemental Fig. S1. We can further confirm negative interplay of the marks K18ac, K23ac, and K4me1, commonly associated with active genes, with respect to repressive Lys-9 tri-methylations (red lines for K4me1K9me3, K18acK9me3, and K23acK9me3, Fig. 7). These activating marks are known to counteract the heterochromatin formation (4, 40, 41) that is highly enriched in Lys-9 methylations. Moreover, acetylations and Lys-4 methylation generally exhibit strong correlations (4, 5). Fig. 7 confirms the correlations exhibiting positive interplay values between these PTMs. We observe positive interplay for K14acK18ac, K18acK23ac, and K23acK27ac, indicating that proximity on the peptide sequence enhances common acetylation states, perhaps due to reduced specificity of the involved acetylases. Lys-9 acetylation seems to play a different role as it only relates positively to K4me1, and it additionally exhibits negative interplay with K23ac. Moreover, we detected negative interplay between K14ac and both K23ac and K27ac. These different interplay values show that there should be a higher structural order for the co-occurrence of “activating” marks. Our observation of cross-talk between these marks suggests that different combinations of them might be related to distinct cellular functions.
Fig. 7.
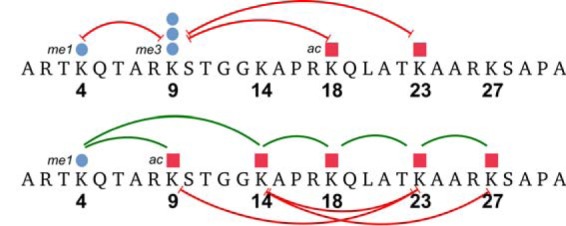
Details on previously reported as well as novel cross-talk. Top, negative interplay values between the heterochromatin mark H3K9me3 and euchromatin marks. Bottom, positive cross-talk between acetylated sites and Lys-4 mono-methylation confirms their previously known correlation. Neighboring lysines are mostly positively correlated, although more distant acetylations seem to be exclusive. These negative interplays indicate a potential higher order relationship between these marks.
In summary, our database and associated computational and statistical tools provide results that reproduce the basic rules for histone PTM cross-talk by combining the information of four significantly different experiments. The analysis of this type of interplay graph is a powerful approach to reveal the combinatorial code of the histone language.
DISCUSSION
Our methods allow researchers to collect and analyze data from MS experiments of modified proteins, including histones. It is now possible to organize and inspect results for multiply modified histones. The web interface provides statistical tools and is applicable to data subsets.
Co-frequency and interplay graphs provide powerful tools to investigate the function of combinatorial marks. With the co-frequency graph, we are able to compare the results from different experimental setups, e.g. comparing cell states and cell types. In contrast, interplay graphs provide information about the underlying rules leading to the observed co-frequencies. These graphs reveal not only details about the interplay/cross-talk between modification pairs in a given experiment, but they also exhibit common patterns of a general combinatorial language corresponding to preserved cross-talk within different experiments, cell states, and even different species. By combining the information from four experiments, we were able to confirm previously known cross-talk and reveal new information. We predict a more intertwined interplay between Lys-9, Lys-27, and Lys-36 methylation marks. A higher methylation state does not necessarily involve a more enhanced function but can also lead to a different joint function with other modifications, e.g. recruitment of different proteins to chromatin. The distinct function with respect to the methylation state might be related to different chromatin types and therefore to recently proposed colored chromatin regions (42). We also detected fine-structured cross-talk between histone PTMs associated with gene activation, such as Lys-4 mono-methylation and Lys-14, Lys-18, and Lys-23 acetylations. Different combinations of these marks might be controlled by distinct molecular mechanisms and regulatory networks.
A larger number of experiments will provide sufficient statistical power to reveal more details, to confirm potential histone modification cross-talk, and to identify species and cell type specific patterns. A larger amount of data also allows us to extend our method to a larger number of simultaneously cross-talking PTMs by identifying positive interplay between modification triplets and quadruplets. Furthermore, the combination of MS results and details on the spatial distribution of histone PTMs measured by ChIP-seq experiments, for example, will establish whether our global results are also valid at defined regions such as promoters or whether there is domain-specific cross-talk with respect to distinct genomic regions.
Footnotes
Author contributions: V.S., C.A., and O.N.J. designed research; V.S., C.A., and S.S. performed research; S.S. contributed new reagents or analytic tools; V.S. and S.S. analyzed data; V.S. and O.N.J. wrote the paper.
* This work was supported by generous financial support from the Danish Council for Independent Research, Natural Sciences (FNU), and the Danish National Research Foundation Center for Epigenetics Grant DNRF82 (to V. S., S. S., and O. N. J.).
 This article contains supplemental material.
1 The abbreviations used are:
- PTM
- post-translational modification
- ChIP-seq
- chromatin immunoprecipitation sequencing
- ChIP-chip
- chromatin immunoprecipitation chip.
REFERENCES
- 1. Jenuwein T., Allis C. D. (2001) Translating the histone code. Science 293, 1074–1080 [DOI] [PubMed] [Google Scholar]
- 2. Strahl B. D., Allis C. D. (2000) The language of covalent histone modifications. Nature 403, 41–45 [DOI] [PubMed] [Google Scholar]
- 3. Hunter T. (2007) The age of cross-talk: phosphorylation, ubiquitination, and beyond. Mol. Cell 28, 730–738 [DOI] [PubMed] [Google Scholar]
- 4. Liu C. L., Kaplan T., Kim M., Buratowski S., Schreiber S. L., Friedman N., Rando O. J. (2005) Single-nucleosome mapping of histone modifications in S. cerevisiae. PLoS Biol. 3, e328. [DOI] [PMC free article] [PubMed] [Google Scholar]
- 5. Nightingale K. P., Gendreizig S., White D. A., Bradbury C., Hollfelder F., Turner B. M. (2007) Cross-talk between histone modifications in response to histone deacetylase inhibitors: MLL4 links histone H3 acetylation and histone H3K4 methylation. J. Biol. Chem. 282, 4408–4416 [DOI] [PubMed] [Google Scholar]
- 6. Bernstein B. E., Mikkelsen T. S., Xie X., Kamal M., Huebert D. J., Cuff J., Fry B., Meissner A., Wernig M., Plath K., Jaenisch R., Wagschal A., Feil R., Schreiber S. L., Lander E. S. (2006) A bivalent chromatin structure marks key developmental genes in embryonic stem cells. Cell 125, 315–326 [DOI] [PubMed] [Google Scholar]
- 7. de Wit E., Greil F., van Steensel B. (2007) High resolution mapping reveals links of HP1 with active and inactive chromatin components. PLoS Genet. 3, e38. [DOI] [PMC free article] [PubMed] [Google Scholar]
- 8. Karlić R., Chung H.-R., Lasserre J., Vlahovicek K., Vingron M. (2010) Histone modification levels are predictive for gene expression. Proc. Natl. Acad. Sci. U.S.A. 107, 2926–2931 [DOI] [PMC free article] [PubMed] [Google Scholar]
- 9. Teng L., Tan K. (2012) Finding combinatorial histone code by semi-supervised biclustering. BMC Genomics 13, 301. [DOI] [PMC free article] [PubMed] [Google Scholar]
- 10. Nishioka K., Chuikov S., Sarma K., Erdjument-Bromage H., Allis C. D., Tempst P., Reinberg D. (2002) Set9, a novel histone H3 methyltransferase that facilitates transcription by precluding histone tail modifications required for heterochromatin formation. Genes Dev. 16, 479–489 [DOI] [PMC free article] [PubMed] [Google Scholar]
- 11. Zegerman P., Canas B., Pappin D., Kouzarides T. (2002) Histone H3 lysine 4 methylation disrupts binding of nucleosome remodeling and deacetylase (NuRD) repressor complex. J. Biol. Chem. 277, 11621–11624 [DOI] [PubMed] [Google Scholar]
- 12. Pesavento J. J., Kim Y.-B., Taylor G. K., Kelleher N. L. (2004) Shotgun annotation of histone modifications: a new approach for streamlined characterization of proteins by top down mass spectrometry. J. Am. Chem. Soc. 126, 3386–3387 [DOI] [PMC free article] [PubMed] [Google Scholar]
- 13. Khare S. P., Habib F., Sharma R., Gadewal N., Gupta S., Galande S. (2012) HIstome–a relational knowledgebase of human histone proteins and histone modifying enzymes. Nucleic Acids Res. 40, D337–D342 [DOI] [PMC free article] [PubMed] [Google Scholar]
- 14. Barski A., Cuddapah S., Cui K., Roh T.-Y., Schones D. E., Wang Z., Wei G., Chepelev I., Zhao K. (2007) High resolution profiling of histone methylations in the human genome. Cell 129, 823–837 [DOI] [PubMed] [Google Scholar]
- 15. Wang Z., Zang C., Rosenfeld J. A., Schones D. E., Barski A., Cuddapah S., Cui K., Roh T.-Y., Peng W., Zhang M. Q., Zhao K. (2008) Combinatorial patterns of histone acetylations and methylations in the human genome. Nat. Genet. 40, 897–903 [DOI] [PMC free article] [PubMed] [Google Scholar]
- 16. Duan Q., Chen H., Costa M., Dai W. (2008) Phosphorylation of H3S10 blocks the access of H3K9 by specific antibodies and histone methyltransferase. Implication in regulating chromatin dynamics and epigenetic inheritance during mitosis. J. Biol. Chem. 283, 33585–33590 [DOI] [PMC free article] [PubMed] [Google Scholar]
- 17. Park P. J. (2009) ChIP-seq: advantages and challenges of a maturing technology. Nat. Rev. Genet. 10, 669–680 [DOI] [PMC free article] [PubMed] [Google Scholar]
- 18. Jensen O. N. (2006) Interpreting the protein language using proteomics. Nat. Rev. Mol. Cell Biol. 7, 391–403 [DOI] [PubMed] [Google Scholar]
- 19. Freitas M. A., Sklenar A. R., Parthun M. R. (2004) Application of mass spectrometry to the identification and quantification of histone post-translational modifications. J. Cell. Biochem. 92, 691–700 [DOI] [PMC free article] [PubMed] [Google Scholar]
- 20. Beck H. C., Nielsen E. C., Matthiesen R., Jensen L. H., Sehested M., Finn P., Grauslund M., Hansen A. M., Jensen O. N. (2006) Quantitative proteomic analysis of post-translational modifications of human histones. Mol. Cell. Proteomics 5, 1314–1325 [DOI] [PubMed] [Google Scholar]
- 21. Trelle M. B., Jensen O. N. (2007) Functional proteomics in histone research and epigenetics. Expert Rev. Proteomics 4, 491–503 [DOI] [PubMed] [Google Scholar]
- 22. Sidoli S., Cheng L., Jensen O. N. (2012) Proteomics in chromatin biology and epigenetics: Elucidation of post-translational modifications of histone proteins by mass spectrometry. J. Proteomics 75, 3419–3433 [DOI] [PubMed] [Google Scholar]
- 23. Zhang K., Tang H., Huang L., Blankenship J. W., Jones P. R., Xiang F., Yau P. M., Burlingame A. L. (2002) Identification of acetylation and methylation sites of histone H3 from chicken erythrocytes by high accuracy matrix-assisted laser desorption ionization-time-of-flight, matrix-assisted laser desorption ionization-postsource decay, and nanoelectrospray ionization tandem mass spectrometry. Anal. Biochem. 306, 259–269 [DOI] [PubMed] [Google Scholar]
- 24. Zhang K., Yau P. M., Chandrasekhar B., New R., Kondrat R., Imai B. S., Bradbury M. E. (2004) Differentiation between peptides containing acetylated or tri-methylated lysines by mass spectrometry: an application for determining lysine 9 acetylation and methylation of histone H3. Proteomics 4, 1–10 [DOI] [PubMed] [Google Scholar]
- 25. Taverna S. D., Ueberheide B. M., Liu Y., Tackett A. J., Diaz R. L., Shabanowitz J., Chait B. T., Hunt D. F., Allis C. D. (2007) Long-distance combinatorial linkage between methylation and acetylation on histone H3 N termini. Proc. Natl. Acad. Sci. U.S.A. 104, 2086–2091 [DOI] [PMC free article] [PubMed] [Google Scholar]
- 26. Young N. L., DiMaggio P. A., Plazas-Mayorca M. D., Baliban R. C., Floudas C. A., Garcia B. A. (2009) High throughput characterization of combinatorial histone codes. Mol. Cell. Proteomics 8, 2266–2284 [DOI] [PMC free article] [PubMed] [Google Scholar]
- 27. Sidoli S., Schwämmle V., Hansen T. A., Wu X., Helin K., Jensen O. N. (2014) Automated setup for characterization of multiple modified histone tails in Suz12−/− stem cells. (In process) [Google Scholar]
- 28. Jung H. R., Sidoli S., Haldbo S., Sprenger R. R., Schwämmle V., Pasini D., Helin K., Jensen O. N. (2013) Precision mapping of co-existing modifications in histone H3 tails reveals a hierarchy of Ac/Me site occupancy and a putative signature for the permissive state of chromatin in embryonic stem cells. Anal. Chem. 85, 8232–8239 [DOI] [PubMed] [Google Scholar]
- 29. Jung H. R., Pasini D., Helin K., Jensen O. N. (2010) Quantitative mass spectrometry of histones H3.2 and H3.3 in Suz12-deficient mouse embryonic stem cells reveals distinct, dynamic post-translational modifications at Lys-27 and Lys-36. Mol. Cell. Proteomics 9, 838–850 [DOI] [PMC free article] [PubMed] [Google Scholar]
- 30. Creasy D. M., Cottrell J. S. (2004) Unimod: Protein modifications for mass spectrometry. Proteomics 4, 1534–1536 [DOI] [PubMed] [Google Scholar]
- 31. Turner B. M. (2005) Reading signals on the nucleosome with a new nomenclature for modified histones. Nat. Struct. Mol. Biol. 12, 110–112 [DOI] [PubMed] [Google Scholar]
- 32. Perkins D. N., Pappin D. J., Creasy D. M., Cottrell J. S. (1999) Probability-based protein identification by searching sequence databases using mass spectrometry data. Electrophoresis 20, 3551–3567 [DOI] [PubMed] [Google Scholar]
- 33. Eng J. K., McCormack A. L., Yates J. R. (1994) An approach to correlate tandem mass spectral data of peptides with amino acid sequences in a protein database. J. Am. Soc. Mass Spectrom. 5, 976–989 [DOI] [PubMed] [Google Scholar]
- 34. Craig R., Beavis R. C. (2004) TANDEM: matching proteins with tandem mass spectra. Bioinformatics 20, 1466–1467 [DOI] [PubMed] [Google Scholar]
- 35. Magrane M., Consortium U. (2011) UniProt Knowledgebase: a hub of integrated protein data. Database 2011, bar009. [DOI] [PMC free article] [PubMed] [Google Scholar]
- 36. Margueron R., Reinberg D. (2011) The Polycomb complex PRC2 and its mark in life. Nature 469, 343–349 [DOI] [PMC free article] [PubMed] [Google Scholar]
- 37. Storey J. D. (2002) A direct approach to false discovery rates. J. R. Stat. Soc. B. 64, 479–498 [Google Scholar]
- 38. Chandra T., Kirschner K., Thuret J.-Y., Pope B. D., Ryba T., Newman S., Ahmed K., Samarajiwa S. A., Salama R., Carroll T., Stark R., Janky R., Narita M., Xue L., Chicas A., Nũnez S., Janknecht R., Hayashi-Takanaka Y., Wilson M. D., Marshall A., Odom D. T., Babu M. M., Bazett-Jones D. P., Tavaré S., Edwards P. A., Lowe S. W., Kimura H., Gilbert D. M., Narita M. (2012) Independence of repressive histone marks and chromatin compaction during senescent heterochromatic layer formation. Mol. Cell 47, 203–214 [DOI] [PMC free article] [PubMed] [Google Scholar]
- 39. Yuan W., Xu M., Huang C., Liu N., Chen S., Zhu B. (2011) H3K36 methylation antagonizes PRC2-mediated H3K27 methylation. J. Biol. Chem. 286, 7983–7989 [DOI] [PMC free article] [PubMed] [Google Scholar]
- 40. West A. G., Huang S., Gaszner M., Litt M. D., Felsenfeld G. (2004) Recruitment of histone modifications by USF proteins at a vertebrate barrier element. Mol. Cell 16, 453–463 [DOI] [PubMed] [Google Scholar]
- 41. Chiu Y.-H., Yu Q., Sandmeier J. J., Bi X. (2003) A targeted histone acetyltransferase can create a sizable region of hyperacetylated chromatin and counteract the propagation of transcriptionally silent chromatin. Genetics 165, 115–125 [DOI] [PMC free article] [PubMed] [Google Scholar]
- 42. Filion G. J., van Bemmel J. G., Braunschweig U., Talhout W., Kind J., Ward L. D., Brugman W., de Castro I. J., Kerkhoven R. M., Bussemaker H. J., van Steensel B. (2010) Systematic protein location mapping reveals five principal chromatin types in Drosophila cells. Cell 143, 212–224 [DOI] [PMC free article] [PubMed] [Google Scholar]
- 43. Pasini D., Bracken A. P., Jensen M. R., Lazzerini Denchi E., Helin K. (2004) Suz12 is essential for mouse development and for EZH2 histone methyltransferase activity. EMBO J. 23, 4061–4071 [DOI] [PMC free article] [PubMed] [Google Scholar]