

Abstract
A compact clinically compatible fluorescence lifetime imaging microscopy (FLIM) system was designed and built for intraoperative disease diagnosis and validated in vivo in a hamster oral carcinogenesis model. This apparatus allows for the remote image collection via a flexible imaging probe consisting of a gradient index objective lens and a fiber bundle. Tissue autofluorescence (337 nm excitation) was imaged using an intensified CCD with a gate width down to 0.2 ns. We demonstrate a significant contrast in fluorescence lifetime between tumor (1.77±0.26 ns) and normal (2.50±0.36 ns) tissues at 450 nm and an over 80% intensity decrease at 390 nm emission in tumor versus normal areas. The time-resolved images were minimally affected by tissue morphology, endogenous absorbers, and illumination. These results demonstrate the potential of FLIM as an intraoperative diagnostic technique.
Autofluorescence of biological tissues provides abundant intrinsic signals revealing changes in chemical composition, metabolism, and morphology [1,2] owing to either pathologic conditions or response to therapy. Label-free fluorescence spectroscopy and imaging have been recognized as powerful tools for discrimination of diseased areas with high specificity and sensitivity [1,3,4]. Encouraging results have been reported for autofluorescence in vivo cancer diagnoses including oral, cervical, and brain tumors [1,4,5]. However, current fluorescence diagnostic techniques relying on spectrum and intensity analyses are challenged by the broad and overlapping emission spectra of endogenous fluorophores, the nonuniform illumination caused by the irregular tissue surface, and the distorted emission owing to endogenous absorbers. Fluorescence lifetime measurement can overcome such challenges because of the relative independence to the absolute intensity value [3,5]. In addition, the intrinsic fluorescence decay (lifetime) not only provides a means of differentiating fluorophores with overlapped spectra but also can be used to monitor intracellular metabolism fluctuations or local environmental fluctuations [2,3]. Consequently, fluorescence lifetime imaging microscopy (FLIM) is a promising imaging modality for diagnosis and image-guided interventions. In past decades, FLIM has been widely used for studies in biology, biophysics, and biochemistry, but few reports appeared on the ex vivo/in vivo examination of tissue [6,7], and only one work approached to endoscopic FLIM for disease diagnosis in vivo with a rigid bronchoscope [8].
The FLIM apparatus (Fig. 1) consists of a gated intensified CCD (ICCD) camera, a pulsed laser, a flexible fiber-optic based endoscope, and a filter wheel. This instrument is an improvement on a prototype system we reported previously [9]. Tissue autofluorescence induced by pulsed nitrogen laser (337 nm, 700 ps pulse width, MNL 205, LTB Lasertechnik, Berlin) was collected using the gradient index (GRIN) lens (NA of 0.5, 0.5 mm diameter, 4 mm field of view, GRINTECH GmbH, Jena) cemented to a fiber image guide (0.6 mm diameter, 2 m long, 10,000 fibers). A 20× microscope objective and a 150 mm focal length achromatic lens were used to magnify fluorescence images to the ICCD. Filter 390/70 nm (center wavelength/bandwidth) (F1) and filter 450/65 nm (F2) were switched by a motorized filter wheel.
Fig. 1.
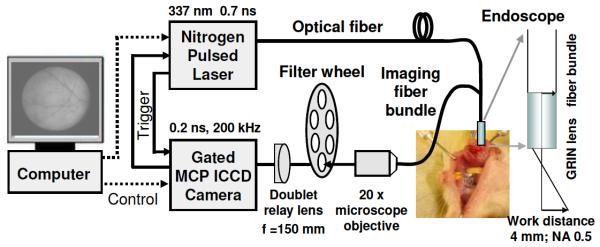
Compact FLIM system using a gated ICCD, a 700 ps pulsed laser, and a flexible fiber endoscope for tissue diagnosis in vivo.
Advanced electro-optics and fiber optics enabled the compact and robust design of this FLIM apparatus. One of the key components is the compact ICCD (4 Picos, Stanford Computer Optics, Berkeley, California) with fully integrated electronic and optical devices in a small enclosure (24 cm×14 cm×11 cm), including a multichannel plate (MCP) image intensifier, relay lenses, a CCD camera, a delay generator, and a high voltage power supply. To our knowledge this is the first application of the 4 Picos camera to fluorescence lifetime imaging. It has a gate width down to 0.2 ns with an MCP repetition rate of up to 200 kHz. The spatial resolution of the system was measured as 35 μm using a USAF test chart (Edmund Optics). The temporal resolution was tested as ≤0.5 ns based on the measurement of a standard short-lived fluorophore Rose Bengal and the analysis of instrument response function. Limited by the repetition rate (≤50 Hz) of the laser, the typical acquisition time for tissue was 120 s. Images were processed using a graphical user interface programmed in MATLAB (The MathWorks Inc.). The Laguerre polynomial deconvolution was employed to retrieve lifetimes rapidly without requiring a priori assumption about the decay profile [5,9].
The ability of the FLIM apparatus to resolve fluorophores with overlapping spectra was examined on a series of fluorophores with lifetimes distributed in a broad range (1–12 ns): coumarin 1 (C-1, in methanol), coumarin 120 (C-120, in methanol), and 9-Anthracenecarbonitrile (9CA, in ethanol, Sigma-Aldrich). Three dyes in separate capillaries were imaged and analyzed together. Figure 2 depicts the fluorescence intensity image, the lifetime map, and the lifetime histogram. The means of average lifetimes of C-1, C-120, and 9CA were measured as 1.6±0.04 (standard deviation), 3.0±0.08, and 11.2±0.64 ns, respectively. These results were in agreement with previous work [10]. The surface curvature of capillaries clearly affected the intensity image showing a nonuniform emission [Fig. 2(a)]. However, a uniform lifetime map was retrieved from each capillary [Fig. 2(b)]. This indicates that FLIM is more robust than the intensity measurement for samples with local height variations. This is an important feature for investigations of tissue where a uniform illumination cannot be easily achieved over the area of interest owing to its irregular surface.
Fig. 2.
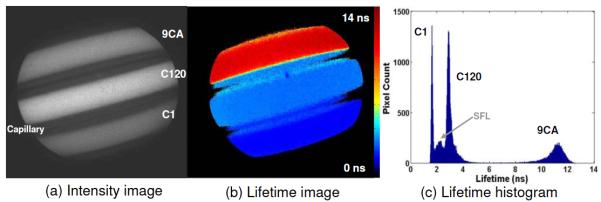
Evaluation of the FLIM apparatus on standard fluorophores with overlapping emission spectra but different lifetimes: (a) intensity image, (b) lifetime image, and (c) lifetime histogram. In (c) the small peak (SFL) between C-1 and C-120 is the scattered fluorescence light within the capillary sidewalls.
Finally this FLIM system was validated in vivo with a hamster buccal pouch carcinogenesis model for tumor demarcation. The right cheek of ten Syrian golden hamsters was painted with 0.5% 7,12-dimethylbenz[a]anthracene (DMBA) three times a week until lesions developed. The left buccal pouch was used as control. Two hamsters without treatment were imaged also as true controls. After animals were anesthetized with ketamine and xylazine, the cheek pouch was inverted and imaged with the probe perpendicular to the regions of interest. Biopsy samples were taken for histopathologic analysis (H&E and trichrome stains) and were graded as normal, dysplastic, carcinoma in situ, or squamous cell carcinoma. To have a consistent data processing, the regular method of tissue and region selection was based on (1) vision inspection during experiments by a surgeon/otolaryngologist and (2) histopathologic evaluation of a pathologist after experiments.
Figure 3 shows fluorescence intensity and lifetime images of normal cheek mucosa and carcinoma in situ recorded with F2. From the normal mucosa, the intensity image [Fig. 3(a)] visualizes blood vessel branches clearly, which is caused by the fluorescence reabsorption by the blood hemoglobin. In contrast, the lifetime image [Fig. 3(b)] exhibits a uniform mapping across the entire area with τF2(control)=1.83±0.10 ns. This suggests that the fluorescence emission of normal cheek originates from the same fluorophore(s). Also, it underscores that the presence of endogenous absorbers in tissues affects the steady state intensity much more than the fluorescence lifetime. Figures 3(c) and 3(d) display the fluorescence intensity and the lifetime images of a carcinoma tumor with surrounding normal tissue from a diseased hamster cheek. The upper right region was diagnosed as carcinoma in situ and exhibited weak fluorescence with a short lifetime (τF2(tumor)=1.30±0.08 ns) when compared with the surrounding normal area characterized by strong fluorescence with a relatively long lifetime (τF2(normal)=1.56±0.10 ns). Lifetime histograms in Fig. 3 show an obvious shift of tumor fluorescence decays toward the lower level. Figure 3 images were demonstrated with the particular interest in the margin of tumor/normal, intensity and lifetime contrast, and vessel networks but the lifetime values (both tumor and normal) were in the low range of the statistic results. By combining both lifetime and intensity information the discrimination was even more obvious as seen in Fig. 3(f). Similar trends between normal versus diseased areas were observed for all stages of the tumor progression including dysplasia, carcinoma in situ, and carcinoma, but tumor stages could not be classified clearly in this validation with limited data sets. A total of ten carcinogen-exposed hamsters were examined with 21 sites from tumors and 14 sites from normal areas. The average lifetime of the diseased sites was 1.77±0.26 ns, which was 29% lower than that from the control of 2.50±0.36 ns. These results suggest that fluorescence lifetime at 450 nm provides a means to differentiate diseased areas from normal tissue in carcinoma diagnosis.
Fig. 3.
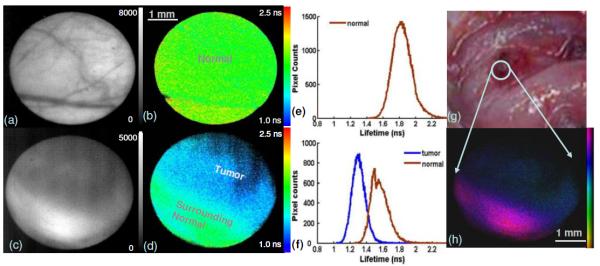
Fluorescence images of hamster cheek in vivo. Normal buccal pouch mucosa: (a) intensity image, (b) lifetime image, and (e) lifetime histogram. Carcinoma in situ with surrounding tissue: (c) intensity image, (d) lifetime map, and its histogram (f). (g) A color picture under white light. (h) Intensity-weighted lifetime image from (c) and (d). Two histogram regions were selected referring to the bright field and fluorescence intensity images. Each region covered about 60%–80% central area for both tumor and normal.
With filter F1 a strong fluorescence emission was observed for normal cheeks in contrast to tumor areas, where the intensity decreased over 80%. The fluorescence lifetime of τF1(normal)=3.17±0.42 ns was longer than that at F2 emission. In this study, the very weak fluorescence with a low signal-to-noise ratio from tumor caused difficulties in retrieving lifetime information.
As demonstrated by previous studies, the autofluorescence of oral mucosa upon UV excitation primarily originates from collagen and nicotinamide adenine dinucleotide (NADH) [1,4,7,11]. Here, fluorescence signal through F1 most likely corresponds to collagen (peak emission at 380–400 nm) whereas that through F2 is mainly from NADH (450–460 nm). Collagen cross links are considered as the dominant contributors to the autofluorescence of normal oral mucosa with fluorescence lifetimes in the range of 2.5–5 ns [1,2,9]. NADH, a coenzyme associated with cellular metabolism, is the main contributor to the fluorescence emission of oral carcinoma [1,4,7]. Free NADH has a fluorescence lifetime of less than 0.5 ns, while protein-bound NADH presents longer lifetime values, typically above 1 ns [3,7]. In agreement with these earlier reports, F2 at 450/65 nm was considered as an adequate subband for carcinoma examination in this study. The decrease in intensity and lifetime of the autofluorescence from cancerous sites, consistent with previous results [1,4,7,10], reflects the biochemical compositional changes within tissue, as the relative contribution of NADH (short lifetimes and low quantum yield) increases during the progression of metabolically active cancer cells while the ratio of collagen (long lifetime and high quantum yield) declines owing to the degradation of connective tissue matrix.
The validation of the portable endoscopic FLIM for oral carcinoma diagnosis in vivo has demonstrated the capability of FLIM to discriminate malignant tissue from normal mucosa by label-free autofluorescence examination. Using information from both intensity and lifetime, FLIM is an effective method to characterize endogenous fluorophores in living systems. It can be potentially used to perform optical delineation of tumors during surgical interventions or noninvasive cancer screening. Further improvements are still underway, including the use of a megahertz fiber laser as the excitation source to achieve video-rate imaging with a much shorter acquisition time and a user-friendly interface for rapid image processing and tissue classification.
Acknowledgments
This work was supported by the National Institutes of Health (NIH) (grants R01-HL67377, R21-EB003628, and UL1 RR024146), the National Science Foundation (NSF) Center for Biophotonics Science and Technology, and the Cancer Center at University of California Davis. The authors would like to thank Douglas Stephens, Yang Sun, and Florentine Rutaganira for their technical help and discussions.
References
- 1.Richards-Kortum R, Sevick-Muraca E. Annu. Rev. Phys. Chem. 1996;47:555. doi: 10.1146/annurev.physchem.47.1.555. [DOI] [PubMed] [Google Scholar]
- 2.Lakowicz JR. Principle of Fluorescence Spectroscopy. Springer; 2006. [Google Scholar]
- 3.Elson D, Requejo-Isidro J, Munro I, Reavell F, Siegel J, Suhling K, Tadrous P, Benninger R, Lanigan P, McGinty J, Talbot C, Treanor B, Webb S, Sandison A, Wallace A, Davis D, Lever J, Neil M, Phillips D, Stamp G, French P. Photochem. Photobiol. Sci. 2004;3:795. doi: 10.1039/b316456j. [DOI] [PubMed] [Google Scholar]
- 4.Pavlova I, Williams M, El-Naggar A, Richards-Kortum R, Gillenwater A. Clin. Cancer Res. 2008;14:2396. doi: 10.1158/1078-0432.CCR-07-1609. [DOI] [PMC free article] [PubMed] [Google Scholar]
- 5.Butte PV, Pikul BK, Hever A, Yong WH, Black KL, Marcu L. J. Biomed. Opt. 2005;10:064026. doi: 10.1117/1.2141624. [DOI] [PMC free article] [PubMed] [Google Scholar]
- 6.Munro I, McGinty J, Galletly N, Requejo-Isidro J, Lanigan PMP, Elson DS, Dunsby C, Neil MAA, Lever MJ, Stamp GWH, French PMW. J. Biomed. Opt. 2005;10:051403. doi: 10.1117/1.2102807. [DOI] [PubMed] [Google Scholar]
- 7.Skala MC, Riching KM, Bird DK, Gendron-Fitzpatrick A, Eickhoff J, Eliceiri KW, Keely PJ, Ramanujam N. J. Biomed. Opt. 2007;12:024014. doi: 10.1117/1.2717503. [DOI] [PMC free article] [PubMed] [Google Scholar]
- 8.Mizeret J, Stepinac T, Hansroul M, Studzinski A, van den Bergh H, Wagnieres G. Rev. Sci. Instrum. 1999;70:4689. [Google Scholar]
- 9.Elson DS, Jo JA, Marcu L. New J. Phys. 2007;9:127. doi: 10.1088/1367-2630/9/5/127. [DOI] [PMC free article] [PubMed] [Google Scholar]
- 10.Sun Y, Liu R, Elson DS, Hollars CW, Jo JA, Park J, Sun Y, Marcu L. Opt. Lett. 2008;33:630. doi: 10.1364/ol.33.000630. [DOI] [PMC free article] [PubMed] [Google Scholar]
- 11.Chen CT, Chiang HK, Chow SN, Wang CY, Lee YS, Tsai JC, Chiang CP. J. Oral Pathol. Med. 1998;27:470. doi: 10.1111/j.1600-0714.1998.tb01914.x. [DOI] [PubMed] [Google Scholar]