

Abstract
In 2013, we reported that local reninangiotensin system (local RAS) components express during the hypertrophic differentiation of chondrocytes and can modulate it, using ATDC5 cell line that involves differentiation from mesenchymal stem cells to calcified hypertrophic chondrocytes. However, the expressions of local RAS components in normal chondrocytes have not been revealed yet. The purpose of this study is to examine the expression of the local RAS components in chondrocytes in vivo and the conditions allowing the expression. We stained five major regions of 8-week-old C57BL/6 adult mice in which chondrocytes exist, including epiphyseal plates and hyaline cartilages, with antibodies to local RAS components. We also examined the expression of local RAS components in the cultured bovine’s articular cartilage chondrocytes using quantitative reverse transcription polymerase chain reaction and western blot analysis. In result, hypertrophic chondrocytes of epiphyseal plates included in the tibia and the lamina terminals expressed local RAS components. However, hyaline chondrocytes, including the knee articular cartilages, the parenchyma of nasal septums and of the tracheal walls, did not express local RAS components. Cultured bovine’s articular cartilage chondrocytes also did not express local RAS components. However, inducing hypertrophy by administering interleukin-1β or tumor necrosis factor-α, the cultured articular chondrocytes also expressed angiotensin II type 1 receptor and angiotensin II type 2 receptor. In conclusion, local RAS components express particularly in chondrocytes which occur hypertrophy and do not in hyaline chondrocytes. The results are in accord with our previous in vitro study. We think this novel knowledge is important to investigate cartilage hypertrophy and diseases induced by hypertrophic changes like osteoarthritis.
Key words: Local RAS, hypertrophic chondrocytes, hyaline chondrocytes, hypertrophy
Introduction
Renin was first identified by Tigerstedt and Bergman in 1898.1 Since then, a reninangiotensin system (RAS) has been investigated extensively. RAS was first recognized as a systemic cardiovascular homeostatic system.2 Thus, inhibit of the systemic RAS has been important clinical tools in treatments of cardiovascular and renal diseases such as heart failure, hypertension and diabetic nephropathy.3 In addition, it is now recognized that a RAS also operates locally. This local tissue-specific RAS (local RAS) has been identified in many organs.3 It has been shown that a local RAS also exerts a distinct biological action in each organ. For example, local RAS components comprise the reaction pathways between astrocytes and neurons, and include neurotransmitters and co-transmitters in the central nerve system.4 The angiotensin II type 1 receptor (AT1R) was found in human sperm, where angiotensin II increases both the percentage of motile sperm and their linear velocity, and in the tail of rat.5 In the musculoskeletal system, expression of a local RAS has been found in the synovium of chronic arthritis6 and in the callus of bone fracture.7 Angiotensin II activates osteoclasts to accelerate osteoporosis,8 and treatment with angiotensin-converting enzyme (ACE) inhibitors contributes to reduce fracture risk.9 In 2013, we reported that local RAS expresses during the hypertrophic differentiation of chondrocytes and has functions to modulate it using ATDC5 cell line.10 However, it is still unknown whether a local RAS expresses in normal chondrocytes in vivo.
Here we investigated the expression of local RAS in chondrocytes using mice and the conditions allowing the expression using primary culturing system of bovine’s articular cartilage chondrocytes.
Materials and Methods
Animals
Eight-week-old C57BL/6 female mice were purchased from CLEA Japan Inc. (Tokyo, Japan). The metatarsophalangeal (MTP) joints of 10-month-old bovine were supplied by Hannan-Chiksan Col. (Habikino, Japan). All experiments were conducted according to the guidelines of the Animal Welfare Committee of Kinki University.
Staining of chondrocytes of mice
Knee joints, nasal septums, tracheal tubes and spines of 8-week-old C57BL/6 adult female mice were resected after euthanization pentobarbital. The resected tissues were fixed in 10% formalin neutral buffer solution for 24 h. Then, knee joints and spines were decalcified in 10% EDTA solution for 3 weeks. The fixed and decalcified tissues were embedded in paraffin and then sliced into serial sections of 3 µm. Sections were deparaffinized in xylene and rehydrated in a descending graded series of alcohol. Some sections were double-stained with alizarin red and Alcian blue. Other sections were stained immunochemically. Endogenous peroxidase was blocked by 3% H2O2 for 20 min. After blocking with normal bovine serum for 60 min at room temperature, the sections were incubated overnight with primary antibodies (15 h at 4°C). Sections for control staining were incubated with normal rabbit serum and normal goat serum instead of primary antibodies (15 h at 4°C). The primary antibodies were as follows: anti-ANG rabbit monoclonal antibody (1:200 in phosphatebuffered saline (PBS); Abcam, Cambridge, UK, #108334); anti-ACE1 rabbit monoclonal antibody (1:200 in PBS; Abcam, #75762); anti-AT1R goat polyclonal antibody (1:200 in PBS; Santa Cruz Biotechnology, Santa Cruz, CA, USA, #31181); and anti-AT2R rabbit polyclonal antibody (1:200 in PBS; Santa Cruz Biotechnology, #9040). The sections were incubated with the secondary antibody for 1 h at room temperature. Horseradish peroxidase-conjugated bovine anti-goat IgG antibody (1:1000 in PBS; Santa Cruz Biotechnology, #2350) was used as the secondary antibody for AT1R staining. Horseradish peroxidase-conjugated bovine anti-rabbit IgG antibody (1:1000 in PBS; Santa Cruz Biotechnology, #2370) was used as the secondary antibody for ANG staining, ACE1 staining, and AT2R staining. The staining was visualized with a diaminobenzidine chromogen kit (DAB Chromogen; Dako, Glostrup, Denmark) and counterstained lightly with Mayer’s hem alum solution. These stained samples were observed using a light microscope (BZ-9000; Keyence, Osaka, Japan).
Cell culture
Chondrocytes were isolated from articular cartilage of the MTP joints of 10-month-old bovine by digestion with 0.08% collagenase (Wako Pure Chemical Industries, Osaka, Japan) for 6 h at 37°C. After filtration, cells were cultured in Dulbecco’s modified Eagle’s medium (Gibco, Grand Island, NY, USA) supplemented with 200 U/mL of penicillin, 40 g/mL of streptomycin, and 10% fetal bovine serum at 37°C in a humidified hypoxic atmosphere (5% O2 and CO2). Cells were seeded at a density of 2×10⁴ in 35 mm plates and cultured in a monolayer until confluence and for 96 h thereafter. The cells were allocated into eight groups (groups A-H) and treated with various reagents when they reached confluence. Cells assigned to group A were treated with phosphate buffered saline. Group B was treated with 0.1 ng/mL interleukin-1β (IL-1β); group C was treated with 1.0 ng/mL IL-1β; group D was treated with 10 ng/mL IL-1β; group E was treated with 1.0 ng/mL tumor necrosis factor-alpha (TNF-α); group F was treated with 10 ng/mL TNF-α; group G was treated with 100 ng/mL TNF-α and group H (control) was cultured without adding any agents. IL-1β and TNF-α were purchased from Wako Pure Chemical Industries (Osaka, Japan).
Quantitative reverse transcription PCR
Total RNA was extracted from cultured bovine’s chondrocytes using TRIzol (Invitrogen, Carlsbad, CA, USA) according to the manufacturer’s protocol. Cells that were administered agents were treated with TRIzol 6 h after the administration (groups A-G). The extracted total RNA was reverse-transcribed using random primers under standard conditions with a high-capacity cDNA reverse transcription kit (Applied Biosystems, Foster City, CA, USA). This first strand cDNA (1:10 dilution) was amplified. Quantitative reverse transcription PCR (QRT–PCR) was performed using Perfect real-time SYBR green II (Takara Bio, Inc., Shiga, Japan). PCR amplifications were performed with the Thermal Cycler Dice Real Time PCR System (Takara Bio, Inc.) at 95°C for 15 s, followed by 40 cycles of 95°C for 5 s and 60°C for 30 s. Relative quantification of the gene of interest was normalized to the housekeeping gene for β-actin in the comparative CT method. To quantify the relative expression of each gene, Ct values were normalized against the endogenous reference (ΔCt = Ct target – Ct β-actin) and were compared with a calibrator using the ΔΔCt method (ΔΔCt = ΔCt sample – ΔCt calibrator). We used the average Ct value for untreated cells as a calibrator (group H). All experiments included negative controls, which consisted of no cDNA for each primer pair. Primer pairs used in this study were as follows: AT1R, forward primer 5’-TCTGAGACTGACTAACCCAAG-3’ and reverse primer 5’-ATGTAATTGTGCCTTCCAGC-3’; AT2R, forward primer 5’- ACTTCTCC-CTTGCCACCATC-3’ and reverse primer 5’-ATGCTTATCCGATGGCTTATG-3’; ACE1, forward primer 5’-GACAGATACATCAACCTCAGG-3’ and reverse primer 5’- ATCGGTAACATCAAGATTGG-3’; ANG, forward primer 5’- TCAATGCC-TACGTCCACTTC-3’ and reverse primer 5’-TCCACCCAGAACTCCTTGAG-3’; p-actin, forward primer 5’- AGGTCATCACCATCGGCAAT-3’ and reverse primer 5’- GAATGCCGCAGGATTCCAT-3’.
Western blot analysis
Cultured bovine chondrocytes were homogenized in sodium dodecyl sulfate (SDS) buffer (4% SDS, 125 mM tris-glycine, 10% 2–mercaptoethanol, 2% bromophenol blue in 30% glycerol) and subjected to polyacrylamide gel electrophoresis in the presence of SDS followed by electrotransfer onto polyvinylidene difluoride membranes (Hybond-P; Amersham Pharmacia Biotech, Buckinghamshire, UK). Cells that were administered agents were homogenized in SDS buffer 24 h after the administration (groups A-G). The membranes were blocked overnight with Block Ace (Dainippon Sumitomo Pharma, Osaka, Japan) and treated with a primary antibody overnight at 4°C. Primary antibodies were diluted to 1:10000 with PBS. The membranes were then treated with horseradish peroxidase-conjugated secondary antibodies for 1 h while shaking gently at room temperature. Secondary antibodies were diluted 1:50000 with PBS. Detection was realized by enhanced chemiluminescence (ECL) with an ECL Plus western blotting detection system (Amersham Pharmacia Biotech, Buckinghamshire, UK) and a charge-coupled device based chemiluminescent analyzer, LAS 4000 (GE Healthcare Ltd., Buckinghamshire, UK). Primary antibodies were as follows: antiactin goat polyclonal antibody (Santa Cruz Biotechnology, #1616); anti-ANG rabbit monoclonal antibody (Abcam, #108334); anti-ACE1 goat polyclonal antibody (Santa Cruz Biotechnology, #12187); anti-AT1R rabbit polyclonal antibody (EMD Millipore, Billerica, MA, USA, #15552); anti-AT2R rabbit polyclonal antibody (Santa Cruz Biotechnology, #9040). Secondary antibodies were as follows: antigoat IgG horseradish peroxidase-conjugated donkey antibody (Santa Cruz Biotechnology, #2020) for actin and ACE1 detection; anti-rabbit-IgG horseradish peroxidase-conjugated goat antibody (Santa Cruz Biotechnology, #2004) for ANG, AT1R and AT2R detection.
Statistical analysis of the data
All experiments were performed four times. Results were presented as means ± SD and processed using Stat View 5.0 statistical software. Differences between results were evaluated using Dunnett’s test and P<0.05 was considered statistically significant.
Results
We first examined the localization of chondrocytes in knee joints, nasal septums, tracheal tubes and spines of 8-week-old adult C57BL/6 female mice using double staining with Alcian red and alizarin blue. The areas which were stained with Alcian blue were epiphyseal plates of the tibia (Figure 1 A,E), articular cartilages and meniscus of knee joints (Figure 1 A,F), parenchyma of nasal septums (Figure 1 B,G), tracheal walls (Figure 1 C,H), epiphyseal plates of spine, chondrocytes of lamina terminalis, annulus fibrosus and nucleus pulposus (Figure 1 D,I). We considered these areas contained chondrocytes. So, we immunohistochemically stained the areas with antibodies for local RAS components. The hypertrophic chondrocytes of epiphyseal plates of the tibia and spine were stained with ACE1, ANG, AT1R and AT2R (Figure 2 A-H). However, articular cartilages and meniscus of knee joints (Figure 3 A,E,I,M), parenchyma of nasal septums (Figure 3 B,F,J,N), tracheal walls (Figure 3 C,G,K,O), chondrocytes of lamina terminalis, annulus fibrosus and nucleus pulposus were not stained immunohistochemically with local RAS components (Figure 3 D,H,L,P). Control stains did not detect any unspecific immunohistchemical reactions (Figure 4 A-D).
Figure 1.
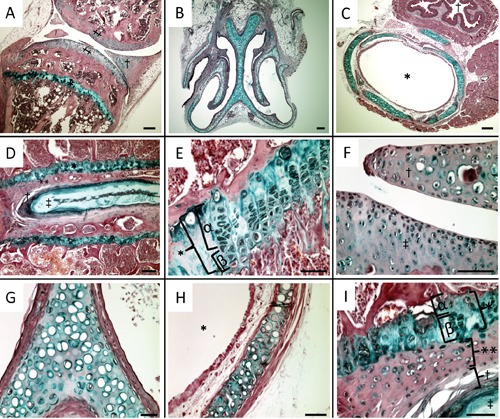
Localization of chondrocytes in knee joints, nasal septums, tracheal tubes and spines of 8-week-old C57BL/6 adult female mice: double-staining with alizarin red and Alcian blue. A) Meniscus and articular cartilage of knee joints and epiphyseal plate of the tibia were stained with Alcian blue; †, meniscus; ‡, articular cartilage; *, epiphyseal plate. B,G) Parenchyma of nasal septum was stained with Alcian blue. C,H) Tracheal walls were stained with Alcian blue; †, esophagus; *, intratracheal. D,I) Epiphyseal plates of spine, chondrocytes of lamina terminalis, annulus fibrosus and nucleus pulposus were stained with Alcian blue; *, epiphyseal plate; α, proliferating zone; (β, hypertrophic zone; **, lamina terminalis; †, annulus fibrosus; ‡, nucleus pulposus. E) Epiphyseal plate of the tibia was stained with Alcian blue; *, epiphyseal plate; α, proliferating zone; β, hypertrophic zone. F) Articular cartilage and meniscus of knee joints were stained with Alcian blue. Scale bars: A-D) 100 µm; E-I) 50 µm. Magnifications: A-C) 4×; D-I) 40×.
Figure 2.
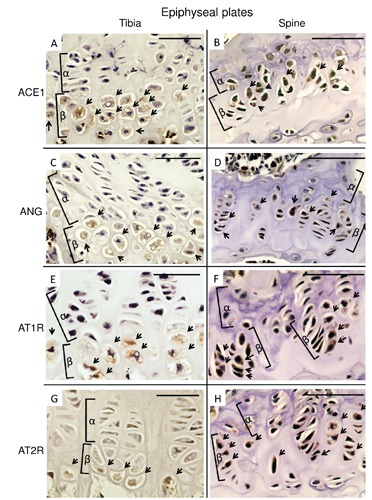
Immunohistochemical micrographs of local renin-angiotensin system components in epiphyseal plate of the tibia and the spine. A,B), ACE1. C,D), ANG. E,F), AT1R. G,H), AT2R. A,C,E,G), Tibia. B,D,F,H), Spine. The hypertrophic chondrocytes in epiphyseal plates of each section were stained with each local renin-angiotensin system components; cells stained with antibodies were indicated with arrows; α, proliferating zone; β, hypertrophic zone; ACE1, angiotensin-converting enzyme 1; ANG, angiotensinogen; AT1R, angiotensin II type 1 receptor; AT2R, angiotensin II type 2 receptor. Scale bars: 50 µm. Magnification: 100×.
Figure 3.
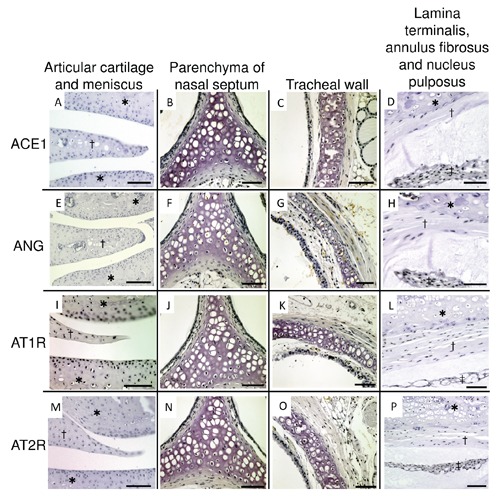
Immunohistochemical micrographs of local renin-angiotensin system components in articular cartilage and meniscus of knee joint, parenchyma of nasal septum, tracheal wall, lamina terminalis, annulus fibrosus and nucleus pulposus. A-D), ACE1. E-H), ANG. I-L), AT1R. M-P), AT2R. A,E,I,M), articular cartilage and meniscus; †, meniscus; *, articular cartilage. B,F,J,N), parenchyma of nasal septum. C,G,K,O) tracheal wall. D,H,L,P), lamina terminalis, annulus fibrosus and nucleus pulposus; *, lamina terminalis; †, annulus fibrosus; ‡, nucleus pulposus. Each chondrocytes of each section were not stained with local renin-angiotensin system components. ACE1, angiotensin-converting enzyme 1; ANG, angiotensinogen; AT1R, angiotensin II type 1 receptor; AT2R, angiotensin II type 2 receptor. Scale bars: A,C-E,G-I,K-M,O,P) 50 µm; B,F,J,N) 100 µm. Magnification: 40×.
Figure 4.
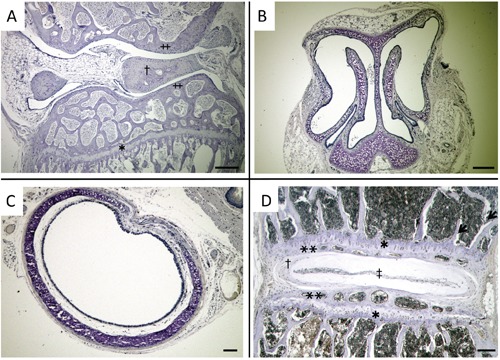
Micrographs of immunohistchemical control stains. A) Knee joint; †, meniscus; ‡, articular cartilage; *, epiphyseal plate. B) Nose. C) Trachea. D) Spine; *, epiphyseal plate; **, lamina terminalis; †, annulus fibrosus; ‡, nucleus pulposus. Unspecific immunohistochemical reactions were not detected. Scale bars: 100 µm. Magnification: 40×.
We also examined the expression of local RAS components in articular cartilage chondrocytes using primary culturing system. We performed QRT-PCR analysis and western blot analysis in cultured bovine cartilage chondrocytes when they reached at confluence without any agents (group H). Both mRNA expressions and protein synthesis of ACE1, ANG, AT1R and AT2R were not detected. We also administered IL-1β or TNF-α into the cells to induce a hypertrophy. Despite of administering IL-1β or TNF-α, ACE1 and ANG were not detected in both QRT-PCR and western blot analysis. However, the expressions of AT1R and AT2R were detected in both QRT-PCR and western blot analysis administering IL-1β or TNF-α (groups B-G; Figure 5 A-D). Especially, the mRNA expressions of AT1R and AT2R were induced administering in a concentrationdependent manner of IL-1β or TNF-α (Figure 5 A,B). Any difference between control cells and cells administered PBS was not detected both in QRT-PCR analysis and western blot analysis.
Figure 5.
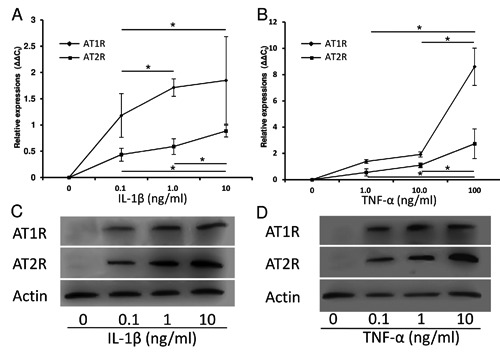
Expressions of AT1R and AT2R in cultured bovine’s articular cartilage chondrocytes. A) Both mRNA expressions of AT1R and AT2R were not detected without administering any agents; the expressions of AT1R and AT2R were induced administering IL-1β in a concentration-dependent manner. B) Both mRNA expressions of AT1R and ATR are not detected without administering any agents; the expressions of AT1R and AT2R were induced administering TNF-α in a concentration-dependent manner. C) Both protein synthesis of AT1R and ATR were not detected without administering any agents; the protein synthesis of AT1R and AT2R were induced administering IL-1β. D) Both protein synthesis of AT1R and ATR were not detected without administering any agents; the protein synthesis of AT1R and AT2R were induced administering TNF-α. *, P<0.05 between treatments; AT1R, angiotensin II type 1 receptor, AT2R, angiotensin II type 2 receptor, IL-1β, interleukin-1β; TNF-α, tumor necrosis factor-alpha.
Discussion
The existence of local RAS has been reported in many tissues.3 However, no report has described the expression of local RAS in chondrocytes of normal tissues in vivo study. We examined the expression of local RAS components in the five major tissues which include chondrocytes. Chondrocytes are roughly classified into two groups; one is the group of chondrocytes which are in even stable like articular cartilages chondrocytes, namely hyaline chondrocytes, and the other is the group of the chondrocytes which differentiate like chondrocytes of epiphyseal plates, namely hypertrophic chondrocytes.11,12 The expressions of local RAS components were not detected in the chondrocytes of articular cartilages of knee joints, parenchyma of nasal septum and parenchyma of tracheal walls. In these areas, chondrocytes were hyaline chondrocytes and were considered not to differentiate hypertrophically.11,12 On the other hand, local RAS components were expressed in chondrocytes of epiphyseal plates of the tibia and the spin. In these areas, chondrocytes are under the hypertrophic differentiation.13,14 These results suggested that local RAS components particularly express in the chondrocytes undergoing hypertrophic differentiation in vivo.
Murata et al. showed IL-1β induces VEGF expression in human articular chondrocytes.15 Also, Ohba et al. reported that TNF-α induces VEGF in chondrocytes of nucleus pulposus.16 It is also known that VEGF couples hypertrophic cartilage remodeling, ossification and angiogenesis during endochondral bone formation.17 Hence, to induce a hypertrophy, we administered TNF-α or IL-1β into the bovine chondrocytes primary culturing system. However, the cultured cells did not express local RAS components, they expressed AT1R and AT2R administering IL-1β or TNF-α. This result suggested that hyaline cartilage also can express local RAS components particularly under hypertrophy.
We showed that local RAS expresses strongly correlated with hypertrophy. Also, in our previous in vitro study using ATDC5 cell line, we had shown that local RAS expresses in chondrocytes according to the hypertrophic change.10 In this point, our present study is accordance with our previous study. We had also reported local RAS has functions to modulate the hypertrophy of chondrocytes in vitro.10 Local RAS may exert similar functions in vivo, too; however, it is still unknown. We think this novel knowledge is helpful to investigate cartilage hypertrophy and diseases induced by hypertrophy like osteoarthritis.
In conclusion, according to the results of previous in vitro study using ATDC5 cell line, chondrocytes that are in term of hypertrophy express local RAS components in vivo, too. Articular cartilage hyaline chondrocytes also can express local RAS components by inducing their hypertrophy.
Acknowledgments
The authors gratefully acknowledge Katsumi Okumoto, Life Science Research Institute, Kinki University, for technical advice and assistance. They also thank Naoko Ohoshi, Department of Orthopaedic Surgery, Faculty of Medicine, Kinki University, for technical assistance in the experiments.
Funding Statement
Funding: this work was partially supported by the Grant-in-Aid from the Ministry of Education, Culture, Sports, Science and Technology of Japan (JSPS KAKENHI Grant N. 25462389).
References
- 1.Tigerstedt R, Bergman PG. Niere und Kreislauf. Skand Arch Physiol. 1898;8:223-71 [Google Scholar]
- 2.Marks LS, Maxwell MH. Tigerstedt and the discovery of renin. An historical note. Hypertension 1979;1:384-8 [DOI] [PubMed] [Google Scholar]
- 3.Paul M, Poyan Mehr A, Kreutz R. Physiology of local renin-angiotensin systems. Physiol Rev. 2006;86:747-803 [DOI] [PubMed] [Google Scholar]
- 4.Paul M, Bader M, Steckelings UM, Voigtländer T, Ganten D. The reninangiotensin system in the brain. Localization and functional significance. Arzneimittelforschung. 1993;43:207-13 [PubMed] [Google Scholar]
- 5.Zhao W, Leung PY, Chew SB, Chan HC, Wong PY. Localization and distribution of angiotensin II in the rat epididymis J. Endocrinol. 1996;149:217-22 [DOI] [PubMed] [Google Scholar]
- 6.Price A, Lockhart JC, Ferrell WR, Gsell W, McLean S, Sturrock RD. Angiotensin II type 1 receptor as a novel therapeutic target in rheumatoid arthritis: in vivo analyses in rodent models of arthritis and ex vivo analyses in human inflammatory synovitis. Arthritis Rheum. 2007;56:441-7 [DOI] [PubMed] [Google Scholar]
- 7.Garcia P, Schwenzer S, Slotta JE, Scheuer C, Tami AE, Holstein JH, et al. Inhibition of angiotensin-converting enzyme stimulates fracture healing and periosteal callus formation - role of a local renin-angiotensin system. Br J Pharmacol. 2010;159:1672-80 [DOI] [PMC free article] [PubMed] [Google Scholar]
- 8.Shimizu H, Nakagami H, Osako MK, Hanayama R, Kunugiza Y, Kizawa T, et al. Angiotensin II accelerates osteoporosis by activating osteoclasts. FASEB J. 2008;22: 2465-75 [DOI] [PubMed] [Google Scholar]
- 9.Rejnmark L, Vestergaard P, Mosekilde L. Treatment with beta-blockers. ACE inhibitors, and calcium-channel blockers is associated with a reduced fracture risk: a nationwide case-control study. J Hypertens. 2006;24:581-9 [DOI] [PubMed] [Google Scholar]
- 10.Tsukamoto I, Inoue S, Teramura T, Takehara T, Ohtani K, Akagi M. Activating types 1 and 2 angiotensin II receptors modulate the hypertrophic differentiation of chondrocytes FEBS Open Bio. 2013;3:279-84 [DOI] [PMC free article] [PubMed] [Google Scholar]
- 11.Buckwalter JA, Mankin HJ. Articular cartilage, part I: Tissue design and chondrocytematrix interactions. J Bone Joint Surg 1997;79A:600-611 [Google Scholar]
- 12.Ulrich-Vinther M, Maloney MD, Schwarz EM, Rosier R, O'Keefe RJ. Articular cartilage biology. J Am Acad Orthop Surg. 2003;11:421-30 [DOI] [PubMed] [Google Scholar]
- 13.van der Eerden BC, Karperien M, Wit JM. Systemic and local regulation of the growth plate. Endocr Rev. 2003;24:782-801 [DOI] [PubMed] [Google Scholar]
- 14.Kronenberg HM. Developmental regulation of the growth plate. Nature. 2003; 423:332-6 [DOI] [PubMed] [Google Scholar]
- 15.Murata M, Yudoh K, Nakamura H, Kato T, Inoue K, Chiba J, et al. Distinct signaling pathways are involved in hypoxia- and IL-1-induced VEGF expression in human articular chondrocytes J Orthop Res. 2006; 24:1544-54 [DOI] [PubMed] [Google Scholar]
- 16.Ohba T, Haro H, Ando T, Wako M, Suenaga F, Aso Y, et al. TNF-alpha-induced NF-kappaB signaling reverses age-related declines in VEGF induction and angiogenic activity in intervertebral disc tissues. J Orthop Res. 2009;27:229-35 [DOI] [PubMed] [Google Scholar]
- 17.Gerber HP, Vu TH, Ryan AM, Kowalski J, Werb Z, Ferrara N. VEGF couples hypertrophic cartilage remodeling, ossification and angiogenesis during endochondral bone formation. Nat Med. 1999;5:623-8 [DOI] [PubMed] [Google Scholar]