

Abstract
Positron emission tomography (PET) radioligands for a reversible central nervous system (CNS) demand a high specific to nonspecific signal characterized by the binding potential (BPND). The quantification of BPND requires the determination of the nondisplaceable binding usually derived from a reference region devoid of the target of interest. However, for many CNS targets, there is no valid reference region available. In such cases, the total volume of distribution (VT) is often used as the outcome measure, which includes both the specific and nonspecific binding signals. Here we present a graphical method that allows for direct comparison of the binding potential of ligands using the regional VT data alone via linear regression. The method was first validated using literature data for five serotonin transporter ligands, for which a reference region exists, and then applied to two second generation 18 kDa translocator protein radioligands, namely [11C]PBR28 and [18F]PBR111. The analysis determined that [11C]PBR28 had a higher BPND than [18F]PBR111.
Keywords: graphical analysis, PET, radioligand comparison, specific binding, TSPO
Introduction
The discovery and development of positron emission tomography (PET) probes for imaging central nervous system targets is a complex process, which suffers from high attrition. Although metrics have been developed for radioligand selection based on careful screening of the physicochemical properties of candidate compounds1 and more comprehensively, biomathematical modeling,2 it is often the case that multiple candidate ligands with promising properties are tested in preclinical or clinical species, and thus it is important to systematically determine the optimal probe to take forward. Often, at such a stage, the compound providing the highest specific to nonspecific signal is chosen. Although this is not the only criterion for a better ligand, in the scenario where candidates show good blood–brain barrier (BBB) penetration and evidence for reversible kinetics, identifying the radioligand with the higher signal-to-noise is a good metric on which to optimize radioligand selection.
For a reversible system, the specific to nonspecific ratio of a radioligand is characterized by the binding potential (BPND), which is the partition coefficient corresponding to the concentration of the ligand in the specifically bound to nondisplaceable (free plus nonspecifically bound) tissue compartments at equilibrium. BPND can be derived from the total volume of distribution of the radioligand (VT) if there is a reference region devoid of the specific target, which provides an estimate of the nondisplaceable volume of distribution (VND).3, 4 If there is a blocking agent available, VND can also be quantified using the original and extended Lassen plot irrespective of the existence of a reference region.5, 6 When there is no valid reference region or blocking agents, the total VT is often used as an outcome measure to evaluate the in vivo signal, although a higher VT does not necessarily lead to a higher BPND as VT is the sum of both the specific and nondisplaceable signal.
There are many central nervous system targets that are expressed ubiquitously in the brain, and thus for these it will not be possible to define a true reference. One such important target is the marker for neuroinflammation, the 18 kDa translocator protein (TSPO), which is expressed on the outer mitochondrial membrane and elevated in a variety of neuroinflammatory brain diseases.7 [11C](R)-PK11195 has been widely used as the PET probe for imaging TSPO over the past two decades, however, it suffers from high nonspecific binding (the free fraction in nondisplaceable tissue is only 2%2) and low signal-to-noise. More recent radioligands proposed for this target, hereafter referred to as second generation radioligands, have been found to express different affinities between subjects within the population, which are determined by a single nucleotide polymorphism in the TSPO gene.8, 9, 10 Such ligands include [11C]PBR28 and [18F]PBR111, which have been shown previously to be able to displace PK11195 in vitro in human brain tissue.8 Although these ligands have preferable properties in vitro over [11C](R)-PK11195,11 the quantification and comparison of the binding potential of these ligands in vivo has been limited owing to the lack of a valid reference region.12
Previously, a number of graphical methods based on linear regression have been developed for PET data to provide fast and robust quantification of the outcome measures, such as the Patlak plot to estimate the irreversible uptake constant KI,13 the Logan plot to estimate VT,14 the Lassen and occupancy plots to estimate occupancies and VND.5, 6 These graphical analysis methods have been used extensively in PET studies and are all easily implemented using standard linear regression techniques. More recently, Dickstein et al15 has compared the in vivo affinity of two TSPO ligands by assessing their free fraction corrected VT values graphically.
As an optimal reversible tracer should not only have good affinity for the target, but more importantly a high signal-to-noise ratio, here, we aim to compare the binding potential of different radioligands irrespective of the existence of a true reference region. Inspired by these graphical methods, we derived the full linear equation which relates the regional VT estimates of two radioligands, assuming they bind to the same target. When presented graphically, the intercept of the linear regression allows for a direct comparison of their BPND values.
In this paper, we first introduce the proposed graphical analysis approach followed by its validation with a PET data set consisting of five serotonin transporter (SERT) ligands for which cerebellum is considered as a suitable reference region. The existence of the reference region for the SERT data allows for a proper validation of the method when the true VND and BPND values can be calculated. The method is then applied to two second generation TSPO ligands [11C]PBR2816 and [18F]PBR111,17 for which a reference region is unavailable, to assess which one has the superior signal in humans. Finally, as graphical analyses can lead to noise-induced bias in parameter estimates when noise is present in both the x- and y-variables,6, 18, 19, 20 we also investigated the impact of noise on the output of the approach.
Materials and methods
Theory
The graphical method for comparing the BPND of two radioligands can be derived from the equation for VT if there exists n(⩾2) regions with sufficiently different target densities. If two PET scans are performed in the same subject with ligand A and B, then the VT estimates of the ligands can be expressed as,
 |
 |
where  ,
, ,
, and
and  are the total volumes of distribution and target densities in the n regions,
  and
and  are the homogeneous nondisplaceable volumes of distribution,
  ,
,  ,
,  , and
, and  are the equilibrium dissociation constants and the free fractions in tissue for ligands A and B, respectively.
If the ligands bind to the same target with 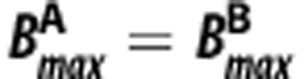 , then equations (1) and (2) can be rearranged to yield,
 |
Given 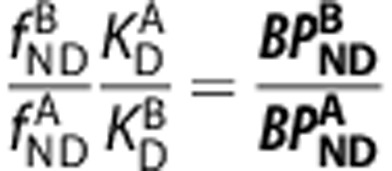 , equation (3) can be simplified to,
 |
An assumption of passive diffusion of the ligands A and B across the BBB leads to the relationships 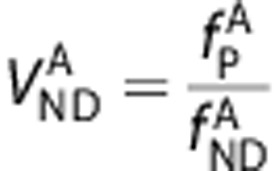 and
and 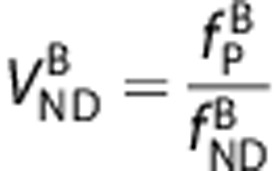 .2, 21 By substituting these into the first term of equation (4), we derive an equation that directly relates
  and
and  to the specific binding ratio,
 |
When represented graphically (x-axis= y-axis=
 ), equation (5) produces a linear relationship between the VT of the two ligands with the y-intercept equal to
 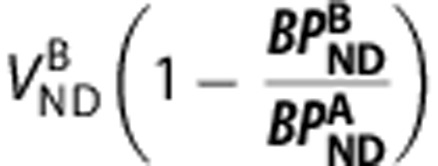 and the slope equal to
 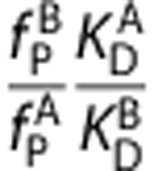 . If
. If  and
and  have been measured, the in vivo affinity ratio of the ligands
 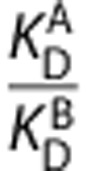 can be determined from the slope.
In summary, by plotting  (on y-axis) against
  (on x-axis) across n regions with differing levels of binding, (i) the linearity of the regression indicates the ligands bind to the same target, or targets with the same distribution within the regions examined; (ii) the gradient provides estimates of the in vivo affinity ratio given measurements of fp, and (iii) the y-intercept identifies which ligand has higher signal-to-noise in vivo (BPND), i.e.
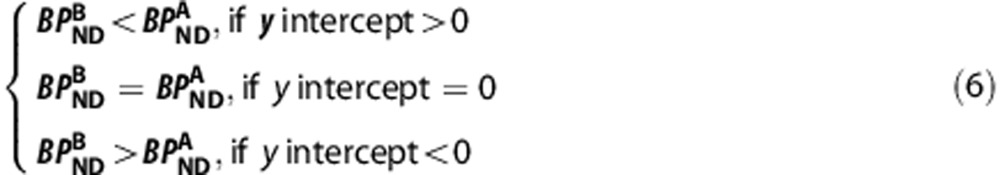 |
In the scenario when the ligands pass the BBB via active transport, the relationship between the VT values of the two ligands can only be defined as in equation (4) rather than equation (5), however, the compound with a higher binding potential is still identified by equation (6).
Validation Based on SERT Data where a Reference Region Exists
To validate the graphical method, we applied it to a comprehensive PET primate data set involving five radioligands for SERT, namely [11C]McN5652, [11C]ADAM, [11C]DASB, [11C]DAPA, and [11C]AFM.22 In brief, two baboons were studied twice with each of the five ligands. For each scan, dynamic blood, metabolite, and tissue data were acquired for 91 minute and analyzed with a one-tissue compartment model to derive regional estimates of VT for midbrain, thalamus, hippocampus, striatum, temporal cortex, occipital cortex, and cerebellum. The BPND values were then calculated from the VT estimates using cerebellum as a reference region because of the low-to-negligible levels of SERT in this region. The fp was measured using ultrafiltration and the affinities of the ligands represented by the inhibition constants (Ki) were measured in rat frontal cortex homogenates using [3H]Paroxetine.22
The graphical analysis (equation (5)) was applied to all the ligands to investigate if they bind to the same target, and to compare their in vivo affinities and BPND values. These results were then evaluated with the previous analysis directly using cerebellum as a reference region.
Application to the TSPO Radioligands [11C]PBR28 and [18F]PBR111
The study was conducted at the Imanova Centre for Imaging Sciences, London and was approved by West London Research Ethics Committee and ARSAC (Administration of Radioactive Substances Advisory Committee). We followed International Conference on Harmonisation (ICH) guidelines. All subjects (seven healthy volunteers, 52±2 years, four female, three high-affinity binders (HABs) and four mixed-affinity binders (MABs)) gave written informed consent, and their eligibility was confirmed via full medical history, physical and neurologic examinations, routine blood tests, and electrocardiogram.
All subjects underwent a 90 minute PET scan with [11C]PBR28 in the morning and a 120-minute scan with [18F]PBR111 in the afternoon on the same day using a Siemens Biograph 6 PET-CT scanner (SIEMENS, Knoxville, TN). The ligands were injected intravenously and the injected activities were 340.16±13.60 MBq for [11C]PBR28 and 166.00±5.14 MBq for [18F]PBR111. The imaging procedures were detailed previously.12 Briefly, PET data were reconstructed using filtered back projection with corrections for attenuation and scatter. Dynamic data were binned into 26 frames for [11C]PBR28 and 29 frames for [18F]PBR111 (durations: 8 × 15 second, 3 × 1 minute, 5 × 2 minute, 5 × 5 minute, 5 or 8 × 10 minute). Arterial blood data were sampled via the radial artery to generate an arterial plasma input function. Blood samples taken at 5, 10, 20, 30, 50, 70, 90, and/or 120 minute were also analyzed using high-performance liquid chromatography to determine the fraction of parent radioactivity in arterial plasma, which were subsequently fitted to a sigmoid model. The resulting fitted parent fraction profile was multiplied by the total plasma curve and then smoothed postpeak using a triexponential fit to derive the parent plasma input function. The fP was measured through ultrafiltration with filters pretreated with 5% tween80 to reduce nonspecific binding to the filter membrane.23
Image analysis and kinetic modeling were performed with an analysis pipeline developed in house. For both ligands, dynamic PET data were corrected for motion via frame-to-frame image registration and aligned with the individual's structural T1 MRI image with a mutual information cost function. An in-house neuroanatomic atlas24 was nonlinearly deformed into the individual's space to derive regional time-activity curves in regions of moderate and high binding including brain stem, thalamus, hippocampus, global cortical regions, cerebellum, and representative low-binding regions such as striatum.25 A two-tissue compartment model utilizing the metabolite corrected plasma input function with fixed blood volume (5%) was used to estimate the VT for the regions of interest for both ligands. The graphical approach (equation (5)) was then applied to the VT estimates of the two compounds to compare their specific to nonspecific binding and in vivo affinities.
Investigations on Linearity and Impact of Noise
The positive linear relationship between the  and
and  of radioligand A and B in equation (5) is derived on the basis of the assumption that they bind to the same target. To demonstrate the capability of the graphical method in detecting ligands that bind to different sites, we tested the method on VT values for [11C]WAY100635, which targets the 5HT1A receptors and [11C]DASB, which targets the SERT. Based on BPND data of the two ligands in the same subjects,26 we generated their VT values using VND reported elsewhere (
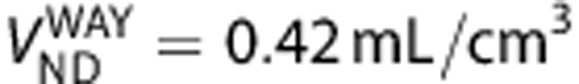 27 and
 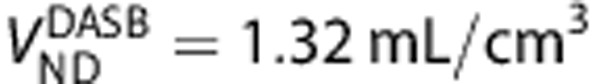 ,28) in 13 brain regions including raphe, striatum, globus pallidus, thalamus, hippocampus, insula, anterior cingulate, posterior cingulate, base side of frontal cortex, frontal convexity, temporal cortex, occipital cortex, and parietal cortex. The graphical method was then applied to compare the binding of the two ligands.
Standard linear regression assumes data on the x-axis is noiseless. However, in the graphical method presented there is noise in both x- and y- variables. The violation of this assumption may result in bias on the gradient and intercept estimates as has been shown previously.6, 18, 19, 20 To evaluate the impact on the regression from noise, we swapped the x- and y-axis of the SERT data set (for 10 pairs of radioligands), re-estimated the slope and the intercept, and then compared these with the estimates from the original direct estimation.
Results
SERT
The application of the graphical analysis to compare five SERT ligands is illustrated in Figure 1. A linear relationship was observed between the VT across regions for all the ligand pairs providing evidence that they bind to the same target. As listed in Table 1, all 10 regressions yielded a positive y-intercept, which according to equation (6) indicates that the ligand on the x-axis has a higher BPND. Therefore, the rank order of the binding potential of the five ligands as determined from the regressions was [11C]AFM>[11C]DASB>[11C]DAPA>[11C]McN5652≈[11C]ADAM. [11C]McN5652 and [11C]ADAM had similar BPND values as the y-intercept was close to 0 (95% confidence interval=(0.71, 8.84)). This is highly consistent with the rank order derived from the estimation of BPND based on a reference region: [11C]AFM>[11C]DASB≈[11C]DAPA>[11C]McN5652≈[11C]ADAM.22
Figure 1.

Application of the graphical analysis to five SERT radioligands: [11C]McN5652, [11C]ADAM, [11C]DASB, [11C]DAPA, and [11C]AFM. Paired comparisons are plotted for the regional (midbrain, thalamus, hippocampus, striatum, temporal cortex, occipital cortex, and cerebellum) VT estimates for all 10 possible permutations. SERT, serotonin transporter.
Table 1. Application of the graphical analysis to five SERT radioligands: [11C]McN5652, [11C]ADAM, [11C]DASB, [11C]DAPA, and [11C]AFM.
| x-Axis | y-Axis |
|||||||
|---|---|---|---|---|---|---|---|---|
| [11C]DASB |
[11C]DAPA |
[11C]McN5652 |
[11C]ADAM |
|||||
| Slope | y-Intercept | Slope | y-Intercept | Slope | y-Intercept | Slope | y-Intercept | |
| [11C]AFM | 0.43 (0.01) | 4.06 (0.87) | 0.58 (0.02) | 14.76 (1.33) | 0.38 (0.03) | 18.04 (1.95) | 0.37 (0.02) | 21.92 (1.44) |
| [11C]DASB | — | — | 1.33 (0.05) | 9.46 (1.59) | 0.88 (0.06) | 14.45 (1.90) | 0.86 (0.04) | 18.42 (1.30) |
| [11C]DAPA | — | — | — | — | 0.66 (0.04) | 8.22 (1.94) | 0.64 (0.02) | 12.36 (1.12) |
| [11C]McN5652 | — | — | — | — | — | — | 0.97 (0.05) | 4.78 (2.08) |
Linear regressions from paired VT comparisons of the radioligands are tabulated, s.e. in brackets. SERT, serotonin transporter; VT, total volume of distribution.
The in vivo KD ratio between six pairs of ligands was estimated with the graphical analysis using the fp data (fp was not measured for [11C]McN5652 owing to high filter retention). These in vivo KD ratios agree with the ones derived based on the VT estimates with a reference region (r=0.9973, P<0.0001) and are generally consistent with the in vitro Ki ratios (r=0.7582, P=0.0841, see Supplementary Figure 1).
TSPO
Images of [11C]PBR28 and [18F]PBR111 in one HAB (add images (%ID/L) over the 90 minute and 120 minute, respectively) are shown in Figure 2. The distribution of the two ligands was similar across the brain, with highest uptake in brain stem and thalamus, followed by hippocampus, cerebellum, cortical regions, and lowest in striatum. For both ligands, radiometabolites appeared quickly after parent administration. At the end of the scan, the parent compound of [18F]PBR111 accounted for ∼20% of the total concentration in plasma, compared with 5% for [11C]PBR28. The measured free fraction in plasma for [11C]PBR28 is one-third of [18F]PBR111 ( and
and  ). A two-tissue compartment model described the kinetics well for both ligands (Figures 3A–D). Within each subject, [18F]PBR111 showed faster clearance than [11C]PBR28 in all the regions examined, and this pattern was present across genetic groups as illustrated in Figures 3E–J. As shown in Table 2, the VT values of [11C]PBR28 were higher than [18F]PBR111 in both HABs and MABs across all regions examined.
Figure 2.

Multimodal images from one HAB subject in the TSPO study: (top) T1 structural MRI, (middle and bottom) add images (%ID/L) of [11C]PBR28 and [18F]PBR111 over the scan duration. HAB, high-affinity binder; MRI, magnetic resonance imaging; TSPO, translocator protein.
Figure 3.

Comparison of [11C]PBR28 and [18F]PBR111. (A) and (B): parent plasma input function in an HAB for the two ligands, respectively. (C) and (D): a two-tissue compartment model fit for the TACs in thalamus, cortical regions, and striatum in an HAB for the two ligands. (E)–(J): population TACs of [11C]PBR28 and [18F]PBR111 in HABs (left) and MABs (right) in the thalamus, cortical regions, and striatum. HAB, high-affinity binder; MAB, mixed-affinity binder; TAC, time-activity curve.
Table 2. Regional V T estimates of [11C]PBR28 and [18F]PBR111 (mL/cm3).
| [11C]PBR28 |
[18F]PBR111 |
|||
|---|---|---|---|---|
| HAB (n=3) | MAB (n=4) | HAB (n=3) | MAB (n=4) | |
| Brain stem | 8.54±0.87 | 4.00±0.58 | 6.42±0.88 | 3.49±0.45 |
| Thalamus | 7.06±0.80 | 3.51±0.85 | 5.90±0.63 | 3.34±0.71 |
| Cortical | 6.25±0.40 | 3.34±0.90 | 5.64±0.77 | 3.15±0.48 |
| Cerebellum | 6.34±0.54 | 3.43±0.90 | 5.44±0.61 | 3.08±0.39 |
| Striatum | 5.65±0.37 | 3.07±0.68 | 5.32±0.49 | 2.89±0.70 |
VT, total volume of distribution.
When applying the graphical method to the VT data for each subject with [11C]PBR28 on the x-axis and [18F]PBR111 on the y-axis (Figure 4), a linear relationship was observed in all seven subjects with positive y-intercepts indicating that the two ligands bind to the same target for both HABs and MABs, and that [11C]PBR28 has a higher BPND than [18F]PBR111 in both genetic groups. According to equation (5), the in vivo
 derived from the gradients was 8.4±6.8 for HABs and 6.6±4.7 for MABs. This in vivo affinity ratio was consistent with the Ki values for these ligands measured in vitro using human brain homogenates tissue, where in vitro
 is ∼4.6 in HABs and 3.7 in MABs.8
Figure 4.

Application of the graphical method to [11C]PBR28 and [18F]PBR111 in (n=3) HABs and (n=4) MABs. HAB, high-affinity binder; MAB, mixed-affinity binder.
Linearity and Impact of Noise
The scatter plot and the regression applied to the VT data of [11C]WAY100635 and [11C]DASB are shown in Figure 5. The data points in the scatter plot are primarily located within two clusters with one cluster including mainly the cortical regions which express 5HT1A receptors in high densities and the other cluster containing regions such as raphe, striatum, globus pallidus, and thalamus, which are the SERT-rich regions. No positive linear relationship is observed between the VT values of these two ligands, which agrees with the hypothesis that a linear relationship with positive correlation should only be expected between two ligands that bind to the same target.
Figure 5.

Application of the graphical method to ligands with different target distributions: [11C]WAY100635 (5HT1A) and [11C]DASB (SERT). The lack of a positive linear relationship indicates that the targets for the two radioligands are different. SERT, serotonin transporter.
After swapping the axes for the paired SERT data in Figure 1, all the y-intercept values are now negative implying that the rank order of the BPND of the ligands remains the same and is unaffected to a significant level by noise on the axes for this data set (Supplementary Table 1). To evaluate the bias on the affinity ratio introduced by noise on the axes, we plotted the slope in Table 1 against the reciprocal of the slope after swapping the axes, and found good agreement between the two estimates and negligible bias in the estimated affinity ratio.
Discussions
For a central nervous system target, a reversible radioligand with high signal-to-noise will provide good sensitivity in detecting small changes in the target signal. In this paper, we present a graphical method which enables direct comparison of the binding potential of two ligands, based on the relationship between their regional VT estimates. A positive linear relationship across a set of regions with differing target density indicates that the ligands bind to the same target or targets with the same distribution, under the assumption that the nonspecific binding is homogeneous for each ligand and the KD for each ligand is the same across regions. This relationship permits a simple linear regression, which enables easy comparison of the signal-to-noise (BPND) of the two ligands based on the sign of the axis intercept irrespective of whether a valid reference region exists. If the fp is measured and passive diffusion assumption is met, then the affinity ratio can also be derived from the slope. This method was validated using a SERT PET data set consisting of five radioligands. The rank of the BPND values and the in vivo affinity ratios for these ligands determined by the graphical analysis were highly consistent with the ones generated when using the cerebellum as a reference region.
We have investigated whether there is any significant noise-induced bias in this graphical method using standard linear regression, by swapping the x- and y-axis and re-evaluating the slope and intercept. The analysis showed that with the SERT data set, there is negligible bias on either the slope or the intercept. However, if noise-induced bias was deemed to be problematic, then alternative estimation methods that take into account noise on both axes such as total least squares29 and likelihood estimation30 can easily be used. The method also identifies whether radioligands bind to different targets by evaluating the linearity of the VT relationship across regions, as shown with the [11C]WAY100635 and [11C]DASB data set where a positive linear correlation is not observed. Note that the performance of the graphical method also relies on a large dynamic range of the regional VT values of two ligands. This becomes particularly important when there is high noise on the VT measurements, in which case the confidence interval of the y-intercept might be too large to be useful for signal-to-noise comparison if the dynamic range of VT is small. Therefore this method might be of limited use for targets that have uniform distributions across regions.
In addition to a good specific to nonspecific signal, a successful in vivo imaging probe for a central nervous system target should possess high selectivity, good BBB penetration, suitable kinetics, and the ability to be radiolabelled and administered to humans at tracer levels. Although a higher BPND is not the only criterion for selection of a better ligand, at the stage when multiple candidate compounds with good BBB penetration and evidence of reversible kinetics are tested for the first time in vivo, this is a good metric for optimizing radioligand selection, given that irreversible binding and potential flow limitation issues are not a concern.
Therefore, this graphical method is particularly useful when an optimal radioligand needs to be chosen among several promising candidates, especially for targets without a true reference region or a blocking agent to determine the nonspecific binding. The imaging of the TSPO is one area which suffers from these limitations. A number of radioligands have been introduced for this target and the selection of a ligand with the best signal has been hampered by the lack of a reference region for this target. For this reason, we applied the proposed graphical analysis approach to two second generation TSPO ligands [11C]PBR28 and [18F]PBR111, and showed that both ligands bind to TSPO as illustrated by the linearity of the regression and that [11C]PBR28 has a higher signal-to-noise than [18F]PBR111 in vivo in healthy humans. This approach can be easily applied to other second generation TSPO ligands to enable a straightforward comparison of in vivo signals and may help contribute to the community reaching a consensus on an optimal ligand for this target.
The graphical method provides a valuable and straightforward tool to assess whether ligands bind to the same target and to compare their specific signals particularly when no reference region is available. It has the potential to be used to help facilitate the selection of the optimal radioligand for a specific target.
Acknowledgments
The authors acknowledge GlaxoSmithKline and Paul Matthews for providing the PET data, and Yvonne Lewis, Awet Tewolde, Rahul Dimber, Michelle Cunneen, James Anscombe, Mayca Onega, Ashley Weekes, Aruloly Kamalakaran, Jan Passchier, and Graham Searle for data collection and analysis. The authors also thank Bayer and ANSTO for providing preclinical data on [18F]PBR111.
The authors declare no conflict of interest.
Footnotes
Supplementary Information accompanies the paper on the Journal of Cerebral Blood Flow & Metabolism website (http://www.nature.com/jcbfm)
Dr Qi Guo is a postdoc supported by the Medical Research Council (MRC), UK (grant G0900891). Dr Federico Turkheimer was supported by the ‘PET Methodology Programme Grant' from MRC UK (G1100809/1). This work was financially supported by a grant from the UK Medical Research Council (G0900891).
Supplementary Material
References
- Zhang L, Villalobos A, Beck EM, Bocan T, Chappie TA, Chen L, et al. Design and selection parameters to accelerate the discovery of novel central nervous system positron emission tomography (PET) ligands and their application in the development of a novel phosphodiesterase 2A PET ligand. J Med Chem. 2013;56:4568–4579. doi: 10.1021/jm400312y. [DOI] [PubMed] [Google Scholar]
- Guo Q, Brady M, Gunn RN. A biomathematical modeling approach to central nervous system radioligand discovery and development. J Nucl Med. 2009;50:1715–1723. doi: 10.2967/jnumed.109.063800. [DOI] [PubMed] [Google Scholar]
- Mintun MA, Raichle ME, Kilbourn MR, Wooten GF, Welch MJ. A quantitative model for the in vivo assessment of drug binding sites with positron emission tomography. Ann Neurol. 1984;15:217–227. doi: 10.1002/ana.410150302. [DOI] [PubMed] [Google Scholar]
- Innis RB, Cunningham VJ, Delforge J, Fujita M, Gjedde A, Gunn RN, et al. Consensus nomenclature for in vivo imaging of reversibly binding radioligands. J Cereb Blood Flow Metab. 2007;27:1533–1539. doi: 10.1038/sj.jcbfm.9600493. [DOI] [PubMed] [Google Scholar]
- Lassen NA, Bartenstein PA, Lammertsma AA, Prevett MC, Turton DR, Luthra SK, et al. Benzodiazepine receptor quantification in vivo in humans using [11C]flumazenil and PET: application of the steady-state principle. J Cereb Blood Flow Metab. 1995;15:152–165. doi: 10.1038/jcbfm.1995.17. [DOI] [PubMed] [Google Scholar]
- Cunningham VJ, Rabiner EA, Slifstein M, Laruelle M, Gunn RN. Measuring drug occupancy in the absence of a reference region: the Lassen plot re-visited. J Cereb Blood Flow Metab. 2010;30:46–50. doi: 10.1038/jcbfm.2009.190. [DOI] [PMC free article] [PubMed] [Google Scholar]
- Banati RB. Visualising microglial activation in vivo. Glia. 2002;40:206–217. doi: 10.1002/glia.10144. [DOI] [PubMed] [Google Scholar]
- Owen DR, Gunn RN, Rabiner EA, Bennacef I, Fujita M, Kreisl WC, et al. Mixed-affinity binding in humans with 18-kDa translocator protein ligands. J Nucl Med. 2011;52:24–32. doi: 10.2967/jnumed.110.079459. [DOI] [PMC free article] [PubMed] [Google Scholar]
- Owen DR, Yeo AJ, Gunn RN, Song K, Wadsworth G, Lewis A, et al. An 18-kDa translocator protein (TSPO) polymorphism explains differences in binding affinity of the PET radioligand PBR28. J Cereb Blood Flow Metab. 2012;32:1–5. doi: 10.1038/jcbfm.2011.147. [DOI] [PMC free article] [PubMed] [Google Scholar]
- Kreisl WC, Jenko KJ, Hines CS, Lyoo CH, Corona W, Morse CL, et al. A genetic polymorphism for translocator protein 18 kDa affects both in vitro and in vivo radioligand binding in human brain to this putative biomarker of neuroinflammation. J Cereb Blood Flow Metab. 2013;33:53–58. doi: 10.1038/jcbfm.2012.131. [DOI] [PMC free article] [PubMed] [Google Scholar]
- Guo Q, Owen DR, Rabiner EA, Turkheimer FE, Gunn RN. Identifying improved TSPO PET imaging probes through biomathematics: the impact of multiple TSPO binding sites in vivo. Neuroimage. 2012;60:902–910. doi: 10.1016/j.neuroimage.2011.12.078. [DOI] [PMC free article] [PubMed] [Google Scholar]
- Guo Q, Colasanti A, Owen DR, Onega M, Kamalakaran A, Bennacef I, et al. Quantification of the specific TSPO signal of [18F]PBR111 in healthy humans: a genetic polymorphism effect on in vivo binding. J Nucl Med. 2013;54:1915–1923. doi: 10.2967/jnumed.113.121020. [DOI] [PubMed] [Google Scholar]
- Patlak CS, Blasberg RG, Fenstermacher JD. Graphical evaluation of blood-to-brain transfer constants from multiple-time uptake data. J Cereb Blood Flow Metab. 1983;3:1–7. doi: 10.1038/jcbfm.1983.1. [DOI] [PubMed] [Google Scholar]
- Logan J, Fowler JS, Volkow ND, Wolf AP, Dewey SL, Schlyer DJ, et al. Graphical analysis of reversible radioligand binding from time-activity measurements applied to [N-11C-methyl]-(-)-cocaine PET studies in human subjects. J Cereb Blood Flow Metab. 1990;10:740–747. doi: 10.1038/jcbfm.1990.127. [DOI] [PubMed] [Google Scholar]
- Dickstein LP, Zoghbi SS, Fujimura Y, Imaizumi M, Zhang Y, Pike VW, et al. Comparison of 18F- and 11C-labeled aryloxyanilide analogs to measure translocator protein in human brain using positron emission tomography. Eur J Nucl Med Mol Imaging. 2011;38:352–357. doi: 10.1007/s00259-010-1622-y. [DOI] [PMC free article] [PubMed] [Google Scholar]
- Brown AK, Fujita M, Fujimura Y, Liow JS, Stabin M, Ryu YH, et al. Radiation dosimetry and biodistribution in monkey and man of 11C-PBR28: a PET radioligand to image inflammation. J Nucl Med. 2007;48:2072–2079. doi: 10.2967/jnumed.107.044842. [DOI] [PubMed] [Google Scholar]
- Fookes CJ, Pham TQ, Mattner F, Greguric I, Loc'h C, Liu X, et al. Synthesis and biological evaluation of substituted [18F]imidazo[1,2-a]pyridines and [18F]pyrazolo[1,5-a]pyrimidines for the study of the peripheral benzodiazepine receptor using positron emission tomography. J Med Chem. 2008;51:3700–3712. doi: 10.1021/jm7014556. [DOI] [PubMed] [Google Scholar]
- Cunningham VJ. Non-linear regression techniques in data analysis. Med Inform (Lond) 1985;10:137–142. doi: 10.3109/14639238509010848. [DOI] [PubMed] [Google Scholar]
- Carson R. Quantification of Brain Function: Tracer Kinetics and Image Analysis in Brain PET: Proceedings of Brain PET'93 Akita Quantification of Brain Function, Akita, Japan, 29-31 May. Excerpta Medica: New York, NY; 1993. PET parameter estimation using linear integration methods: bias and variability consideration; pp. 499–507. [Google Scholar]
- Slifstein M, Laruelle M. Effects of statistical noise on graphic analysis of PET neuroreceptor studies. J Nucl Med. 2000;41:2083–2088. [PubMed] [Google Scholar]
- Gunn RN, Summerfield SG, Salinas CA, Read KD, Guo Q, Searle GE, et al. Combining PET biodistribution and equilibrium dialysis assays to assess the free brain concentration and BBB transport of CNS drugs. J Cereb Blood Flow Metab. 2012;32:874–883. doi: 10.1038/jcbfm.2012.1. [DOI] [PMC free article] [PubMed] [Google Scholar]
- Huang Y, Hwang DR, Narendran R, Sudo Y, Chatterjee R, Bae SA, et al. Comparative evaluation in nonhuman primates of five PET radiotracers for imaging the serotonin transporters: [11C]McN 5652, [11C]ADAM, [11C]DASB, [11C]DAPA, and [11C]AFM. J Cereb Blood Flow Metab. 2002;22:1377–1398. doi: 10.1097/01.WCB.0000040948.67415.05. [DOI] [PubMed] [Google Scholar]
- Lee KJ, Mower R, Hollenbeck T, Castelo J, Johnson N, Gordon P, et al. Modulation of nonspecific binding in ultrafiltration protein binding studies. Pharm Res. 2003;20:1015–1021. doi: 10.1023/a:1024406221962. [DOI] [PubMed] [Google Scholar]
- Tziortzi AC, Searle GE, Tzimopoulou S, Salinas C, Beaver JD, Jenkinson M, et al. Imaging dopamine receptors in humans with [11C]-(+)-PHNO: dissection of D3 signal and anatomy. Neuroimage. 2011;54:264–277. doi: 10.1016/j.neuroimage.2010.06.044. [DOI] [PubMed] [Google Scholar]
- Fujita M, Imaizumi M, Zoghbi SS, Fujimura Y, Farris AG, Suhara T, et al. Kinetic analysis in healthy humans of a novel positron emission tomography radioligand to image the peripheral benzodiazepine receptor, a potential biomarker for inflammation. Neuroimage. 2008;40:43–52. doi: 10.1016/j.neuroimage.2007.11.011. [DOI] [PMC free article] [PubMed] [Google Scholar]
- Takano H, Ito H, Takahashi H, Arakawa R, Okumura M, Kodaka F, et al. Serotonergic neurotransmission in the living human brain: a positron emission tomography study using [11C]DASB and [11C]WAY100635 in young healthy men. Synapse. 2011;65:624–633. doi: 10.1002/syn.20883. [DOI] [PubMed] [Google Scholar]
- Gunn RN, Lammertsma AA, Grasby PM. Quantitative analysis of [carbonyl-11C]WAY-100635 PET studies. Nucl Med Biol. 2000;27:477–482. doi: 10.1016/s0969-8051(00)00115-3. [DOI] [PubMed] [Google Scholar]
- Talbot PS, Frankle WG, Hwang DR, Huang Y, Suckow RF, Slifstein M, et al. Effects of reduced endogenous 5-HT on the in vivo binding of the serotonin transporter radioligand 11C-DASB in healthy humans. Synapse. 2005;55:164–175. doi: 10.1002/syn.20105. [DOI] [PubMed] [Google Scholar]
- Varga J, Szabo Z. Modified regression model for the Logan plot. J Cereb Blood Flow Metab. 2002;22:240–244. doi: 10.1097/00004647-200202000-00012. [DOI] [PMC free article] [PubMed] [Google Scholar]
- Ogden RT. Estimation of kinetic parameters in graphical analysis of PET imaging data. Stat Med. 2003;22:3557–3568. doi: 10.1002/sim.1562. [DOI] [PubMed] [Google Scholar]
Associated Data
This section collects any data citations, data availability statements, or supplementary materials included in this article.