

Abstract
Intraglottal velocity measurements were taken using particle image velocimetry and the corresponding estimates for the intraglottal pressure were computed using the pressure Poisson equation. Results from five canine larynges showed that when the flow separated from the divergent glottal walls during closing, the vortices that were formed in the separated region of the glottis created negative pressure near the superior aspect of the folds. The magnitude of the negative pressure was directly proportional to the subglottal pressure. At low subglottal pressure, negative pressures at the superior edge were not observed when the divergence angle of the wall was minimal and the glottal flow did not separate from the wall.
I. Introduction
In order to understand the mechanisms of self induced oscillations during vocal fold vibration, an understanding is needed of the forces exerted on the glottal tissue by intraglottal airflow. These forces are produced by intraglottal pressures, which primarily depend on subglottal pressure, intraglottal velocity fields, intraglottal geometry, and vocal tract geometry; this paper focuses on computing the intraglottal pressures during vocal fold closing from direct measures of subglottal pressure, intraglottal velocity fields, and intraglottal geometry in excised canine larynges with no vocal tract.
Flow separation in the glottis occurs when the airflow cannot follow the glottal wall. During the opening phase, the glottis takes on the shape of a converging nozzle and the airflow is attached to the entire medial surface of the vocal folds; in this case, all theoretical models assume that the flow separates from the superior surface of the vocal folds at the glottal exit. During the closing phase, the glottis takes on the shape of a diverging nozzle. As the diverging angle of the duct exceeds a certain value, the flow cannot follow the glottal wall and will separate from the medial surface inside the glottis.
The assumptions about flow separation and the intraglottal velocity fields vary between analytical and computational models when the glottis is divergent. These assumptions affect the values of the associated intraglottal pressures and can be broadly classified into three types: The first model assumes that flow separation occurs at the glottal exit (e.g., Ishizaka and Matsudaira, 1972). This assumption implies that Bernoulli's law can be used to compute the pressure distribution throughout the entire glottis. Therefore this model predicts that the intraglottal pressure is more negative at the inferior aspect of the glottis than the superior aspect during closing. Negative pressure refers to the gauge pressure, or pressure relative to atmospheric pressure. The second model (.e.g. Pelorson et al., 1994) assumes that intraglottal flow separation occurs but that the pressures downstream of the location where the flow separates are equal to atmospheric pressure. In this type of model, Bernoulli's law can still be used upstream of the point of flow separation. Thus the intraglottal pressures will be determined by the location of the separation. The third model assumes that the flow separation occurs inside the glottis, resulting in negative pressure near the superior edge of the glottis produced by the flow separation vortices (Khosla et al., 2007); however, this approach only proposes qualitative information about the pressure (e.g. the pressure is more negative in the superior aspect when flow separation occurs) since it was based on flow measurements taken above the glottis.
The assumption behind the third model is supported by the intraglottal pressure measurements in the excised hemilarynx of Alipour and Scherer (2000), in the static mechanical model of Alipour and Scherer (2002), and the computational work of Mihaescu et al. (2010). All these studies showed that during the closing phase, significant negative pressures forms near the superior aspect of the glottis. Titze (1988) suggested that small magnitude of negative pressure might form near the superior aspect of the folds due to the inertia forces from the vocal tract that are acting on the glottal jet. In our current studies and in the case of Alipour and Scherer (2000) and Mihaescu et al., a vocal tract is not used; therefore if negative intraglottal pressures exist, inertance effects cannot explain the mechanism.
Our hypothesis is that during the closing phase, intraglottal negative pressures are produced near the superior aspect of the folds due to the flow separation mechanism and in particular the flow separation vortices that are forming. This hypothesis is tested in the current study by computing the intraglottal pressure distributions from flow velocity measurements taken using particle image velocimetry (PIV). While PIV measurements have been used to measure intraglottal velocity fields in the excised canine larynx (Khosla et al. 2014, Oren et al. 2014) and in cam driven models (Triep and Brucker, 2010), this is the first study to use the derived velocity fields to compute intraglottal pressures in an excised canine larynx or dynamic mechanical model. Results from five canine larynges are shown and further innovations are discussed. The computed intraglottal pressures are also compared to actual intraglottal pressures measurements in a hemilarynx model.
II. Methods
Five excised larynges were harvested from shared research mongrel canines immediately after the animals were euthanized. All cartilage and soft tissue above the vocal folds were removed in order to produce an unobstructed view of the folds. Adduction of the folds was obtained by placing a suture through both vocal processes at the same level. The trachea was fitted over an aerodynamic nozzle that conditioned (i.e. laminarize) the airflow entering the glottis. Detail description of the experimental setup and the nozzle can be found in Oren et al. (In-Press).
Time-resolved PIV measurements were performed in the mid-membranous plane, defined as the halfway point between the anterior commissure and vocal process. A total of 2,000 PIV images were taken at a sampling rate of 5kHz with a spatial resolution of 83pixel/mm. Velocity measurements were taken by illuminating the flow field with the laser from above the larynx and placing the PIV camera above the vocal folds (in the x-z plane) at an oblique angle of 40° relative to the x-y plane. Projecting the laser sheet from above the larynx enabled to take intraglottal velocity measurements because of the divergent shape of the glottis during closing. The entire glottal velocity field (at the mid-membranous plane) cannot measure during opening due to the convergent shape of the glottis. Figure 1 depicts schematically the intraglottal flow measurement (for an arbitrary phase during closing phase). It also defines the coordinate system where the z-plane is directed out of the page. The velocity components are defined as u, v, and w in the x, y, and z directions, respectively.
Figure 1.
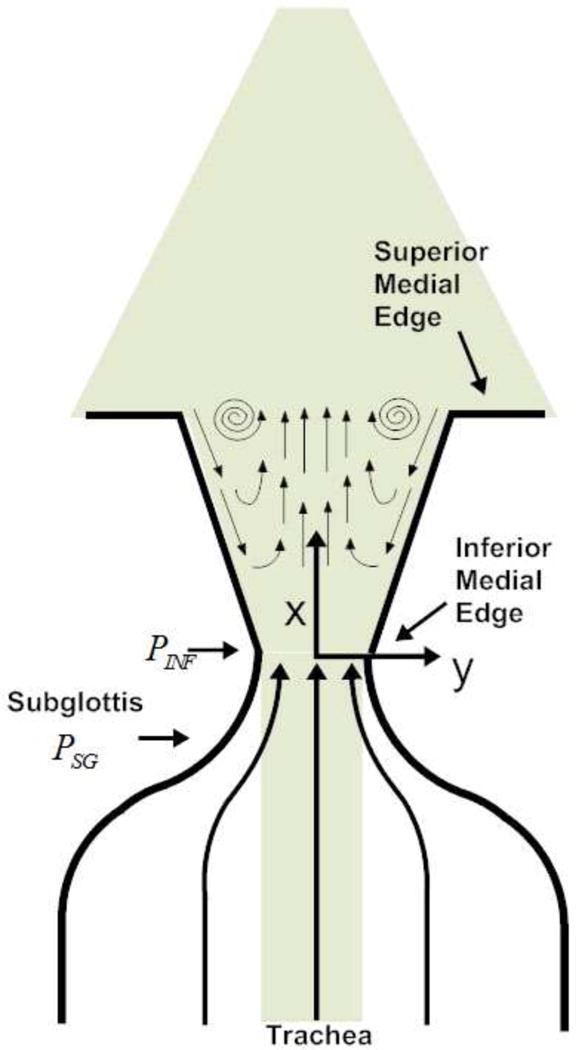
Schematic of the PIV measurement at the mid-membranous plane (showing for an arbitrary phase during closing). The z-axis is pointing out of the page. u, v, and w are velocity components in the x, y, and z directions. The PIV camera is located on the x-z plane, anterior and superior to the larynx. The laser sheet is projected from above the larynx in the x-y plane. The inferior edge of the can be identified by the collimation of light. PSG is the subglottal pressure, which is assumed to be the same as the pressure measured in the nozzle. PINF is the pressure at the inferior edge, which is computed according to Eqn. 2.
The glottal opening was captured with a high-speed (HS) video camera using 25.5pixel/mm resolution. The camera was placed approximately 80cm above the glottis and a total of 14,000 images were taken for each case at a sampling rate of 20kHz. The acquisition of the glottal opening images was synchronized with the acquisition of the PIV images based on the TTL signal of both cameras.
An electroglottograph (EGG) was used to determine the beginning of the glottal opening by attaching its electrodes to the cricoid. The EGG signal was also used to determine the phase of each PIV and HS image by matching its time derivative to the TTL signal recorded from the cameras. The phase of the glottal cycle is defined by θ varying from θ = 0° or 360 at the beginning of superior edge opening, as determined from the HS images of the glottal area.
The upstream static pressure was measured inside the nozzle using a pressure transducer (Honeywell, FPG). The pressure measurement inside the nozzle was used as the value for the subglottal pressure, PSG. The sampling rates for the pressure transducer, EGG, and TTL signals, were 200kHz using a National Instrument data acquisition system (NI, PXIe-6356). The timing of the PIV, high-speed images, and data acquisition was synchronized using a shared reference clock.
III. Pressure computations from PIV
The intraglottal pressure distribution of the glottal flow field was calculated from the velocity measurements using the pressure Poisson equation for incompressible flow. This method of calculating pressure values from PIV data was shown to have good agreement with direct measurements (de Kat and van Oudheusden, 2012). The pressure Poisson equation is derived from the inviscid Navier-Stokes equations by applying the divergence operator and simplifying using the continuity equation for steady flow (Anderson and Wendt, 1995):
| (1) |
where the right hand side of the equation can be solved using the velocity data obtained by PIV.
In order to solve the pressure Poisson equation, which is an elliptic equation, the boundary conditions must be known. In case of the glottal flow, the boundary conditions are the pressure conditions specified upstream, downstream, and on the glottal wall. The inferior pressure (PINF) was applied as the upstream boundary. It was computed from the subglottal pressure, (PSG), which was measured inside the nozzle, using Bernoulli's equation:
| (2) |
PINF and PSG are shown in Figure 1. The use of Bernoulli's equation is based on the assumption that the airflow inside the nozzle and in the subglottal region is steady and laminar. Q is the measured flow rate, which was measured upstream using a flow meter (MicroMotion Inc, CMF025 Coriolis Flow Meter). ASG and AINF are the areas inside the nozzle and the minimum subglottal opening area (measured from the HS images at the inferior aspect of the folds during closing), respectively. The pressure at the downstream (upper) boundary, located at the highest axial location of the PIV measurements, was assumed to be atmospheric. This was typically 3-4mm above the superior edge of the folds in the excised larynx. The pressure gradient normal to the wall was assumed to be zero (dP /dn = 0).
In order to use the Poisson equation to compute the pressure from the velocity data, several assumptions have been made about the intraglottal flow. The first assumption was that the flow at the mid-membranous plane was planar. Khosla et al. (2008) measured the flow velocity in the sagittal and transverse planes immediately above the folds. They showed that w=0 directly above the folds and is negligibly small even at 10mm above the folds. Scherer et al. (2010) estimated in a computational static model that near the posterior/anterior edges of the folds the magnitude of the out-of-plane velocity (w) could be no more than 10% of the axial velocity magnitude. Scherer's model also predicted that w = 0 in the mid-membranous plane. Therefore it is reasonable to assume that during vibration, the intraglottal flow is two-dimensional in the coronal plane at the mid-membranous point; however this assumption would not be reasonable if the pressure was computed near the vocal process or anterior commissure or if it was measured at 1 cm above the folds. Thus the computations in this paper only refer to the velocity and pressures inside the glottis at the mid-membranous plane.
Another assumption made in order to solve the pressure Poisson equation assumes that the normal pressure gradient is zero at the wall (dP/dn=0); the underlying assumption is that the velocity of the glottal wall is much less than the velocity of the jet. Note that due to the small angular change in mid-membranous plane, dn ≈ dy. In our cases, the mean velocity of the glottal wall, which can be considered as the transverse velocity of the flow at the wall (v), was about 1 m/s (also shown by Döllinger et al., 2005). Since the velocity of the jet (about 40-50m/s) is more than an order of magnitude larger than the velocity if the glottal wall, the dP/dn = 0 assumption is reasonable.
The derivation of the pressure Poisson equation also assumes that there is no unsteady component (∂V/∂t = 0) in the flow. Applying this assumption for the glottal flow is based on the quasi-steady approximation. The quasi-steady approximation describes the unsteady flow as a series of steady flows with time varied wall geometry (i.e. boundary conditions) and assumes that acceleration effects in the flow can be neglected. Krane et al. (2010) argued that the quasi-steady assumption is valid for the glottal flow when the convective acceleration is much greater than temporal acceleration, and the assumption cannot be used during the beginning of opening and the rapid shutoff phases (Krane et al., 2007, Mongeau et al., 1997, and Zhang et al., 2002). In the current study, the quasi-steady assumption was used for calculating the pressure only during closing phase, prior to the rapid shutoff phase. The assumption of ∂V / ∂t = 0 was also needed because the 5kHz acquisition rate of the PIV was not sufficed to capture the changes in the temporal dynamics of the flow.
The sensitivity of the pressure computations to the location of the upper boundary atmospheric pressure condition was determined by comparing the computed pressure results when the upper boundary was moved from the glottis exit to 5mm above it. The resulting difference between upper boundary placements at 3mm above the glottis to 5mm were less than 10%.
IV. Results
Phonation in each larynx was tested at three subglottal pressures: low, medium, and high. The data acquisition was initiated about 10sec after the onset of phonation to allow for the vibration frequency to stabilize. The main experimental parameters are summarized in Table 1.
Table 1. Experimental parameters for the study.
| Larynx | Folds length (mm) | Subglottal pressure (cmH2O) | Fo (Hz) | Notes |
| L1 | 14.0 | 10.0 | 153 | Male canine |
| 19.4 | 124 | |||
| 25.5 | 126 | |||
| L2 | 14.2 | 15.1 | 115 | Female canine Zipper-effect during closing |
| 18.5 | 126 | |||
| 21.5 | 193 | |||
| L3 | 14.5 | 14.7 | 96 | Female canine Zipper-effect during closing |
| 19.1 | 348 | |||
| 24.9 | 383 | |||
| L4 | 14.0 | 18.8 | 87 | Male canine |
| 22.8 | 118 | |||
| 27.2 | 119 | |||
| L5 | 17.0 | 15.2 | 66 | Male canine |
| 20.2 | 84 | |||
| 27.5 | 104 |
The velocity field of the glottal flow and the corresponding pressure distribution at low subglottal pressure in larynx L1 (PSG =10.0cmH2O, θ = 197°) are shown in Figure 2. The phase shown occurred in the middle of the closing cycle (150° < θ < 250°). At low PSG there was a minimal lateral displacement of the folds and consequently a minimal divergence angle was formed in the glottis during closing. As a result, the glottal flow did not separate from the glottal wall during closing (Fig. 2a). The corresponding intraglottal pressure distribution shows that the pressure was nearly atmospheric at the superior edge (Fig. 2b).
Figure 2.
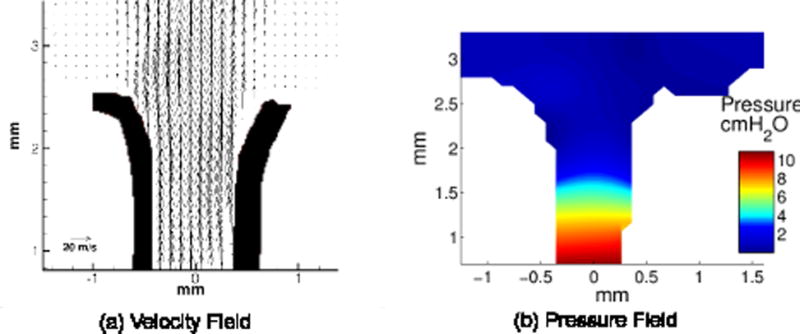
Intraglottal velocity field and pressure distribution during closing (θ = 197°) for low subglottal pressure (PSG =10.0cmH20) in larynx L1.
The intraglottal velocity field and pressure distribution for three phases during closing (θ = 128°, 135° , and 137°) for larynx L1 at high subglottal pressure (PSG =25.5cmH2O) are shown in Figure 3. The images were taken during a single cycle (i.e. from consecutive PIV images). At high PSG there was a greater displacement of the folds laterally and a larger divergent angle was formed in the glottis during closing. At the beginning of closing, the flow separated at the glottal exit (Fig. 3a) and the computed pressure at the superior edge was nearly atmospheric (Fig. 3b). This is similar to what is shown for the low PSG condition in this larynx. The divergence angle in the glottis started to increase during the middle of closing (θ = 135°, Fig. 3c) and the glottal flow separated from the left wall. Entrainment flow entered the glottis into the void that was formed between the wall and the jet. Fig 3c shows that the entrainment near the superior edge developed into a vortex. The corresponding pressure computations show that negative pressure was formed near the superior aspect of the fold (Fig. 3d) and the lowest (negative) value, -8.8cmH2O, to occur inside the vortex. In the current case shown for L1, the maximum flow separation in the glottis occurred around θ = 137° (Fig. 3e). The size of the vortex near the left fold continued to grow and the lowest negative pressure at the superior edge was computed to be -14.6cmH2O (Fig. 3f).
Figure 3.
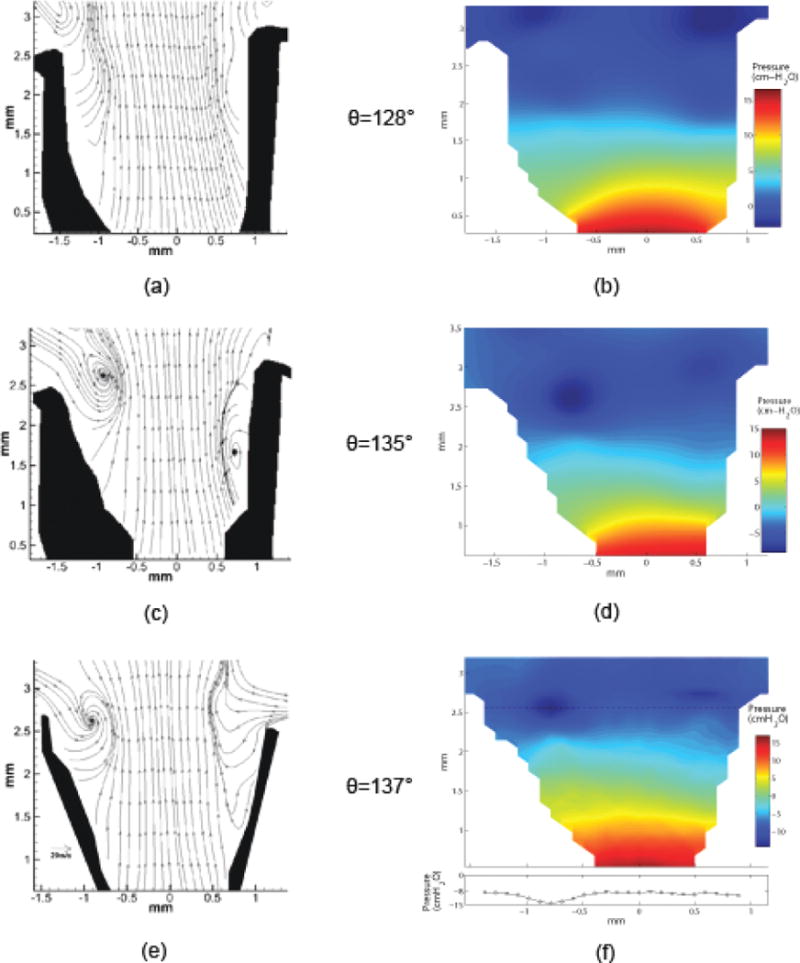
Intraglottal velocity fields and pressure distributions during closing for high subglottal pressure in larynx L1. a , b) θ = 128°; c, d) θ = 135°; e, f) θ = 137°.
The values computed for the intraglottal pressure distributions are based on the assumptions discussed in Section III, one of which was the quasi-steady approximation. Krane et al. (2010) argued that the quasi-steady assumption is invalid at the final phase of closing, which they identified to begin when the rapid drop in the centerline velocity occurs. This centerline velocity, Ucl , in larynx L1 at high PSG is shown in Figure 4. Ucl is taken as the (instantaneous) maximum velocity in the jet measured at the glottal exit. Also plotted in Fig. 4 is the corresponding lowest negative pressure value computed near the superior aspect. The region marked by the dashed area is when the quasi-steady assumption is no longer valid and the uncertainty of the pressure calculations in this region is not known. Note that the lowest values of the negative pressure in the glottis occurred when the quasi-steady assumption is still valid.
Figure 4.
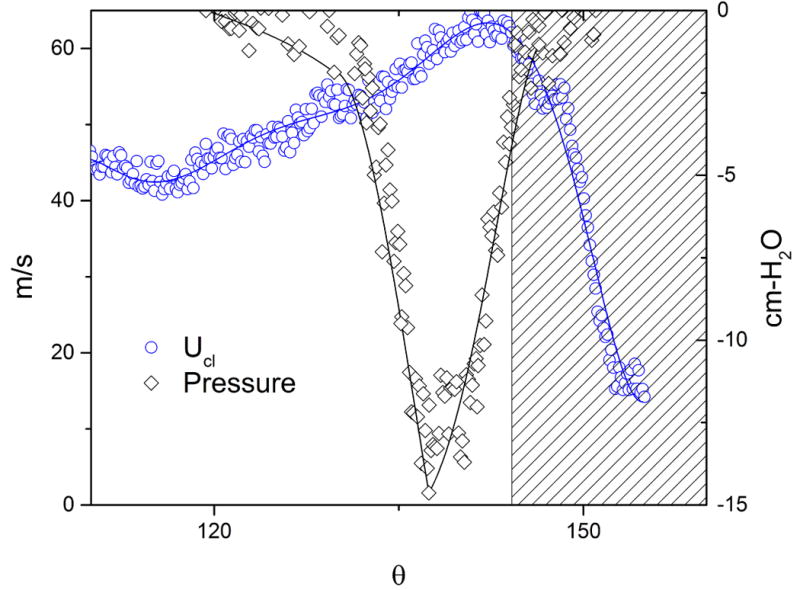
Centerline velocity and the lowest negative pressure measured near the superior edge in larynx L1 during closing (at high PSG). The shaded region marks the period where rapid closing occurs and the quasi-steady assumption is invalid.
The evolution of the negative pressure near the superior aspect of the folds during closing is shown in Figure 5 for the five larynges at the low, medium, and high PSG. Each symbol in the scatter plots indicates the value for the most negative pressure that was computed inside the glottis. The values always occurred near the superior aspect of the folds and downstream of the location where the flow separated. The figure shows that the magnitude, the duration, and the waveform of the negative pressure that develops in the glottis during closing are dependent on the larynx and PSG. The duration of the closing phase, which is shown as the horizontal bars, also varied between the larynges. The vertical line on each bar marks the juncture in closing where the quasi-steady assumption was invalid (based on the drop in Ucl). Fig 5 also shows that the negative pressure in the glottis did not begin to develop at the onset of closing, rather it developed when the entrainment flow begun to enter the glottis.
Figure 5.
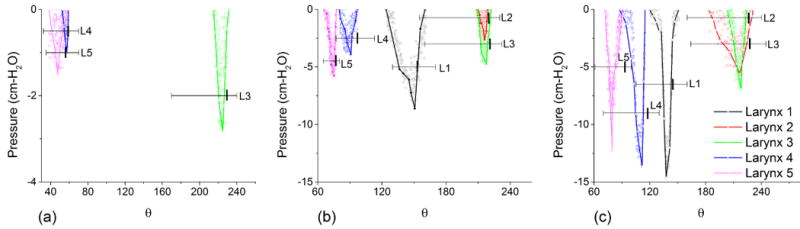
The most negative intraglottal pressures estimated during closing for a) low, b) medium, and c) high PSG . The value shown in each phase is taken as the most negative pressure computed near the superior aspect of the folds. Horizontal lines indicate the duration of the closing cycle. The vertical line on each horizontal bar marks the juncture where the quasi-steady assumption is invalid. The uncertainty of the pressure calculations that are between the vertical line and the end of closing is not known.
At low PSG, the lowest negative pressures in larynges L3-L5 were -2.8, -1.0, and -1.5cmH2O (Fig. 6a). Intraglottal negative pressures were not observed in L1 and L2 because the flow did not separate from the glottal wall (see Fig. 2).
Figure 6.
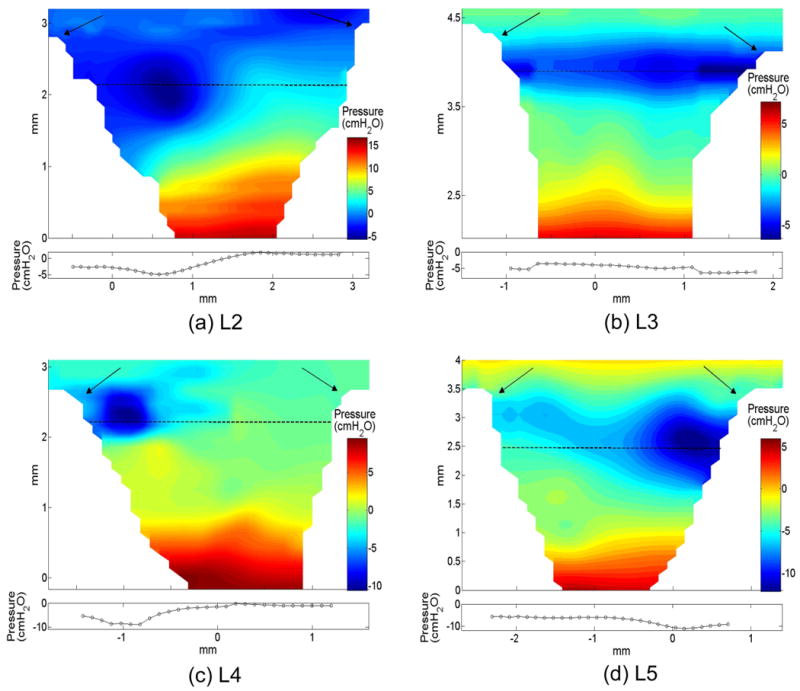
Intraglottal pressure distributions at the phases where the lowest negative pressure occurred for larynges L2-L5. The pressure values along the dashed lines are shown below each image. Arrows indicate the approximate location of the superior edge.
At high PSG, the most negative pressure values for larynges L1 through L5 were: -14.6, -5.6, -7.9, -13.6, and -12.2cmH2O, respectively (Fig. 5c). These magnitudes were similar to the negative pressures in the hemilarynx of Alipour and Scherer (2000), who measured -6.0 and -15.5cmH2O at the superior aspect for subglottal pressures of 25 and 27cmH2O. Negative pressures were also computed for the medium PSG in larynges L1-L5 with the most negative values of -8.6, -2.6, -4.7, -3.9, and -5.7cmH2O (Fig. 5b). In all cases, the peak values of the negative magnitude were computed when the quasi-steady approximation was still valid.
Following their peaks, the magnitude of the intraglottal negative pressure was reduced as the divergence angle between the folds was decreased and less entrainment entered the glottis. The pressure values shown in Fig. 5 that were computed close to the end of closing phase have higher uncertainty because the quasi-steady assumption is invalid at this phase.
The pressure waveforms in Figure 5 occurred at different phases of the glottal cycle due to the different durations of the opening, closing and closed phases of the glottal cycle. Larynges L2 and L3 were characterized with a very short closed phase (i.e. the duration in which the folds are fully adducted) compared to Larynges L4 and L5. However, the occurrence of the negative pressure inside the glottis was always at the mid-to-end phase of closing.
The instantaneous velocity fields where the lowest negative pressure occurred for larynges L2-L5 in high PSG are shown in Figure 6 (L1 was shown in Fig. 3f). In all cases the most negative pressure occurred when a flow separation vortex was present near the superior aspect of the fold. The lateral distribution of the pressure along the dashed line, which mark the superior aspect of the fold, is shown at the bottom of each image. The images show that while there was a significant change in the transglottal pressure (going from PINF to the superior aspect of the fold), the lateral distribution of the pressure in the glottis was more constant; the most negative pressure was computed at the center of the vortex or at the center of the entrainment flow and the magnitude remained nearly the same at the adjacent wall.
Figure 7 shows the lowest negative pressure that occurred near the superior aspect as a function of PSG. The red solid line marks the linear regression fit to the data. The figure shows that the magnitude of PSG was correlated with the magnitude of the intraglottal negative pressure. Higher PSG magnitudes increased the velocity of the glottal jet and the lateral displacement of the folds. The latter resulted in a larger divergence angle of the folds. Both factors then augmented the entrainment flow and the strength of the vortical flow within the separated region, which were directly related to the negative pressure magnitude.
Figure 7.
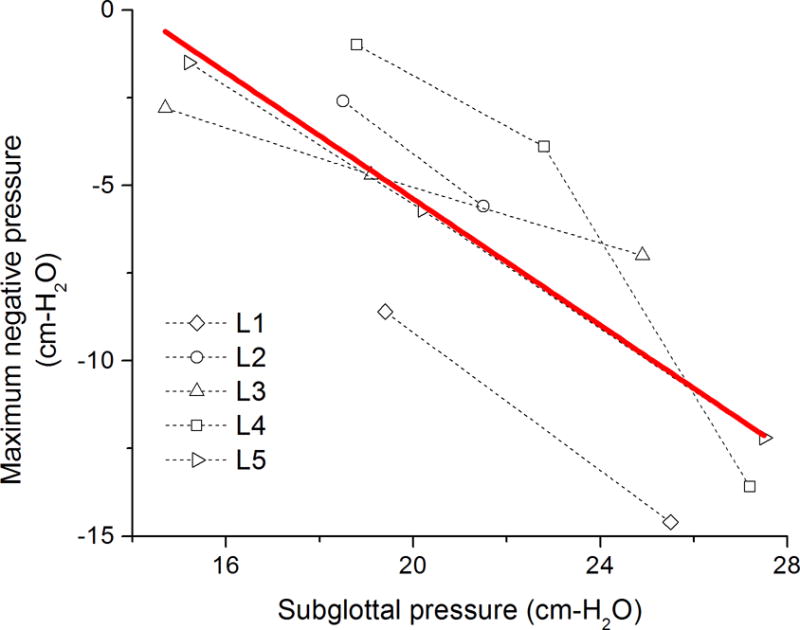
Lowest negative pressure as a function of subglottal pressure. The solid red line marks the linear regression fit to the data.
V. Discussion and Conclusion
The present study is the first to report the intraglottal pressure distribution in a tissue model with both vocal folds. The results from five canine larynges show that negative pressures are formed near the superior aspect of the folds when intraglottal flow separation occurs. The values of the negative pressure are in general agreement with those previously reported in an excised canine hemilarynx model (Alipour and Scherer, 2000). These negative pressures cannot be explained by Titze (1988), who suggested that intraglottal negative pressure can develop due to the inertia forces in the vocal tract, because a vocal tract was not used in the current study or the hemilarynx model. The significance of the current study is that it shows how intraglottal flow separation and vortices can produces negative pressure near the superior edge.
At low subglottal pressures, the divergence angle of the folds during closing was minimal and the intraglottal flow did not separate from the folds, which yields pressure that was nearly atmospheric near the superior edge. As the subglottal pressure was increased, the divergence angle increased and the flow separated from the glottal wall. External flow then entrained into the area between the separated flow and the wall and consequently induced negative pressure near the superior aspect of the fold. At high subglottal pressure, the entrainment may roll into vortices, which amplified the magnitude of the negative pressure.
In some of the cases shown above there was a noticeable asymmetry in the motion of the vocal fold. As a result, the flow distribution was not symmetric (e.g. vortex formed only on one side of the glottal jet, Fig 3e), or the (lateral) pressure distribution in the glottis was not symmetric (e.g. Fig 5c). It is likely that the apparent asymmetry was localized to the medial plane of measurement and may stem from the inherent quality of the PIV data near the wall. The motion of the folds was viewed as symmetric when observed from above using the HS camera.
Further work is needed in order to better understand how the magnitude and duration of the intraglottal negative pressure affect the closing mechanism of the folds. The relative importance of vocal fold elasticity and the glottal wall dynamics are currently being investigated. These factors, together with the suction force, which is created by the negative pressure near the superior aspect of the fold, would then be used to model the closing mechanism of the folds.
Acknowledgments
The authors acknowledge the support of NIH Grant No. 5R01DC009435. The authors thank Doug Dembinski and John Cha for their contribution in performing the experiments.
Footnotes
Conflict of interest: The authors have no financial or personal interests that could inappropriately influence (bias) the work in this manuscript.
Publisher's Disclaimer: This is a PDF file of an unedited manuscript that has been accepted for publication. As a service to our customers we are providing this early version of the manuscript. The manuscript will undergo copyediting, typesetting, and review of the resulting proof before it is published in its final citable form. Please note that during the production process errors may be discovered which could affect the content, and all legal disclaimers that apply to the journal pertain.
Contributor Information
Liran Oren, Department of Otolaryngology-Head and Neck Surgery, University of Cincinnati, 231 Albert Sabin Way, Cincinnati, Ohio 45267-0528, Tel: (513) 558 - 003, Fax: (513) 558 – 5203.
Sid Khosla, Department of Otolaryngology-Head and Neck Surgery, University of Cincinnati, 231 Albert Sabin Way, Cincinnati, Ohio 45267-0528, Tel: (513) 558 - 003, Fax: (513) 558 – 5203.
Ephraim Gutmark, Department of Aerospace Engineering and Engineering Mechanics, University of Cincinnati, 310 Rhodes Hall, Cincinnati, Ohio 45221-0070, Tel: (513) 556 - 1227, Fax: (513) 556 – 5038.
References
- Alipour F, Scherer R. Dynamic glottal pressures in an excised hemilarynx model. Journal of Voice. 2000;14:443–454. doi: 10.1016/s0892-1997(00)80002-8. [DOI] [PubMed] [Google Scholar]
- Alipour F, Scherer R. Pressure and velocity profiles in a static mechanical hemilarynx model. The Journal of the Acoustical Society of America. 2002;112:2996–3003. doi: 10.1121/1.1519540. [DOI] [PubMed] [Google Scholar]
- Anderson J, Wendt J. Computational fluid dynamics. McGraw-Hill; New York: 1995. pp. 1–792. [Google Scholar]
- de Kat R, van Oudheusden B. Instantaneous planar pressure determination from PIV in turbulent flow. Experiments in Fluids. 2012;52:1089–1106. [Google Scholar]
- Döllinger M, Berry D, Berke G. A quantitative study of the medial surface dynamics of an in vivo canine vocal fold during phonation. The Laryngoscope. 2005;115:1646–1654. doi: 10.1097/01.mlg.0000175068.25914.61. [DOI] [PubMed] [Google Scholar]
- Ishizaka K, Matsudaira M. Monograph No 8. Speech Communication Research Laboratory; Santa Barbara: 1972. Fluid mechanical considerations of vocal cord vibration. [Google Scholar]
- Khosla S, Murugappan S, Lakhamraju R, Gutmark E. Using particle imaging velocimetry to measure anterior-posterior velocity gradients in the excised canine larynx model. The Annals of Otology, Rhinology, and Laryngology. 2008;117:134–144. doi: 10.1177/000348940811700212. [DOI] [PMC free article] [PubMed] [Google Scholar]
- Khosla S, Muruguppan S, Gutmark E, Scherer R. Vortical flow field during phonation in an excised canine larynx model. The Annals of Otology, Rhinology, and Laryngology. 2007;116:217–228. doi: 10.1177/000348940711600310. [DOI] [PMC free article] [PubMed] [Google Scholar]
- Khosla S, Oren L, Ying J, Gutmark E. Direct simultaneous measurement of intraglottal geometry and velocity fields in excised larynges. The Laryngoscope. doi: 10.1002/lary.24512. In-Press. [DOI] [PubMed] [Google Scholar]
- Krane M, Barry M, Wei T. Unsteady behavior of flow in a scaled-up vocal folds model. The Journal of the Acoustical Society of America. 2007;122:3659–3570. doi: 10.1121/1.2409485. [DOI] [PMC free article] [PubMed] [Google Scholar]
- Krane M, Barry M, Wei T. Dynamics of temporal variations in phonatory flow. The Journal of the Acoustical Society of America. 2010;128:372–383. doi: 10.1121/1.3365312. [DOI] [PMC free article] [PubMed] [Google Scholar]
- Mihaescu M, Khosla S, Murugappan S, Gutmark E. Unsteady laryngeal airflow simulations of the intra-glottal vortical structures. The Journal of the Acoustical Society of America. 2010;127:435–444. doi: 10.1121/1.3271276. [DOI] [PMC free article] [PubMed] [Google Scholar]
- Mongeau L, Franchek N, Coker C, Kubli R. Characteristics of a pulsating jet through a small modulated orifice, with application to voice production. The Journal of the Acoustical Society of America. 1997;102:1121–1133. doi: 10.1121/1.419864. [DOI] [PubMed] [Google Scholar]
- Oren L, Gutmark E, Khosla S. Intraglottal geometry and velocity measurements in canine larynges. The Journal of the Acoustical Society of America. 2014;135(1):380–388. doi: 10.1121/1.4837222. [DOI] [PMC free article] [PubMed] [Google Scholar]
- Pelorson X, Hirschberg A, Van Hassel R, Wijnands A, Auregan Y. Theoretical and experimental study of quasisteady-flow separation within the glottis during phonation. application to a modified two-mass model. The Journal of the Acoustical Society of America. 1994;96:3416–3431. [Google Scholar]
- Scherer RC, Torkaman S, Kucinschi BR, Afjeh AA. Intraglottal pressures in a three-dimensional model with a non-rectangular glottal shape. The Journal of the Acoustical Society of America. 2010;128:828–838. doi: 10.1121/1.3455838. [DOI] [PMC free article] [PubMed] [Google Scholar]
- Titze IR. The physics of small-amplitude oscillation of the vocal folds. The Journal of the Acoustical Society of America. 1988;83:1536–1552. doi: 10.1121/1.395910. [DOI] [PubMed] [Google Scholar]
- Triep M, Brücker C. Three-dimensional nature of the glottal jet. The Journal of the Acoustical Society of America. 2010;127:1537–1547. doi: 10.1121/1.3299202. [DOI] [PubMed] [Google Scholar]
- Zhang Z, Mongeau L, Frankel S. Experimental verification of the quasi-steady approximation for aerodynamic sound generation by pulsating jets in tubes. The Journal of the Acoustical Society of America. 2002;112:1652–1663. doi: 10.1121/1.1506159. [DOI] [PubMed] [Google Scholar]