Abstract
The nature of the highly efficient energy transfer in photosynthetic light-harvesting complexes is a subject of intense research. Unfortunately, the low fluorescence efficiency and limited photostability hampers the study of individual light-harvesting complexes at ambient conditions. Here we demonstrate an over 500-fold fluorescence enhancement of light-harvesting complex 2 (LH2) at the single-molecule level by coupling to a gold nanoantenna. The resonant antenna produces an excitation enhancement of circa 100 times and a fluorescence lifetime shortening to ~\n20 ps. The radiative rate enhancement results in a 5.5-fold-improved fluorescence quantum efficiency. Exploiting the unique brightness, we have recorded the first photon antibunching of a single light-harvesting complex under ambient conditions, showing that the 27 bacteriochlorophylls coordinated by LH2 act as a non-classical single-photon emitter. The presented bright antenna-enhanced LH2 emission is a highly promising system to study energy transfer and the role of quantum coherence at the level of single complexes.
 Quantum processes may have an important role in photosynthetic light-harvesting complexes, but their low fluorescence efficiency impedes studies. By coupling them to gold nanoantennas, Wientjes et al. show over 500 times enhancement of fluorescence from single molecules of light-harvesting complex 2.
Plants, bacteria and algae collect sunlight and store the energy in chemical bonds. This photosynthetic process starts with the absorption of a photon by a light-harvesting complex, after which the excitation energy is efficiently transferred to the reaction centre where charge separation occurs. In photosynthetic purple bacteria, the light collection takes place in light-harvesting complexes 1 and 2 (LH1 and LH2). LH2 is a helical chromophore–protein complex, it coordinates nine weakly excitonically interacting bacteriochlorophylls-a (bChls) absorbing at ~\n800 nm (B800 ring) and 18 strongly interacting bChls absorbing ~\n850–860 nm (B850 ring)1,2. Light energy absorbed by the B800 ring is transferred within 1 ps to the B850 ring3, the excitation is initially delocalized over almost the whole ring4,5, but quickly contracts to 2–3 bChls from which the fluorescence emission occurs4,6. The intrinsic fluorescence quantum efficiency (QE0) of LH2 in aqueous buffer solution is rather low, only 10% (ref. 6).
LH2 is a complex multi-chromophore system and shows dynamic changes in its conformation. To examine such heterogeneous systems single-molecule fluorescence detection has proven a powerful method that allows to reveal properties otherwise hidden in the ensemble average7. Pioneering cryogenic single-molecule studies8 revealed the excited-state electronic structure of individual LH2 complexes. Later experiments showed effects of polarized absorption in the B800 ring9,10 and spectral jumps in the room temperature emission spectra11. We recently showed long-lived quantum coherence between electronically coupled energy eigenstates of single LH2 complexes at ambient temperature12. Moreover, following a single LH2 complex in time, we found coherent phase jumps indicating adaptations to changes of the (local) electronic structure to find optimal new energy-transfer pathways within a complex12. The potential role of quantum effects in photosynthesis is intriguing13,14,15 and requires critical single-molecule studies. Unfortunately, for LH2 with its low QE0 and rapid irreversible photobleaching at ambient temperatures, the small number of emitted photons limits the amount of information that can be retrieved16. Clearly, an improvement of the photon emission efficiency is required to help uncover the fascinating energy-transfer dynamics and quantum coherences of single LH2 at ambient conditions.
Plasmonic nanoantennas are known to boost the brightness of fluorophores by concentrating the electromagnetic fields into sub-diffraction limited volumes17,18. The fluorescence enhancement of fluorophores placed in localized ‘hot spots’ has two contributions: enhancement of the excitation field and modifications of the radiative rate that increase the effective quantum efficiency (QE)19. Thus a low QE0 fluorophore, such as LH2, could in principle benefit from both effects and can be transformed into a brighter and more efficient emitter. Moreover, owing to the higher radiative rate, the LH2 will spend less time in the excited state that increases the photostability. Consequently, even more photons can be emitted in total before irreversible photobleaching occurs20,21. Hence, coupling of LH2 to nanoantennas is a promising route to improve the detection of single LH2.
Thus far, the enhancement of emission of photosynthetic biomolecules has been explored using chemically synthesized metal nanostructures such as silver island films22,23, gold24,25 and silver26 nanoparticles. The possibility to precisely engineer the dimensions of the nanoparticles as resonant optical antennas has not been exploited yet to achieve optimal enhancement. Most importantly, systems with a single nanoantenna interacting with a single light-harvesting complex have so far not been explored.
Here we demonstrate strong emission and decay rate enhancement of single LH2 complexes by single-resonant nanoantennas. A maximum emission enhancement of over 500 times is obtained, an order of magnitude higher than reported so far on photosynthetic complexes23. Discrete blinking and photon antibunching is observed, indicating excited-state energy transfer over the full complex at ambient conditions. Our experimental findings are supported by simulations, indicating that the LH2 fluorescence QE is enhanced to 55%, and that the excitation enhancement by two orders of magnitude.
Results
Tuning the antenna length in resonance with LH2
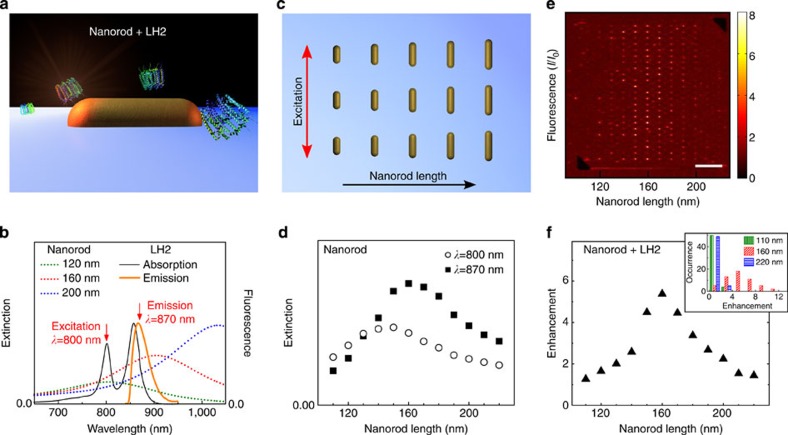
An LH2 complex located in the hot spot of a resonant antenna can show strongly enhanced emission (Fig. 1a). The plasmon resonance of a metal antenna depends on its dimensions. In the case of a nanorod (NR) antenna, the resonance wavelength scales linearly with the antenna length27. For optimal fluorescence enhancement, both enhanced excitation and emission are required (fluorescence enhancement=excitation enhancement × QE enhancement). Therefore, the antenna resonance should overlap with both the excitation wavelength at λ=800 nm and the LH2 emission wavelength (λ=870 nm; Fig. 1b). To find the optimal antenna length, gold NRs of different lengths were fabricated on a glass coverslip with a 50-nm Au layer and 1 nm titanium adhesion layer by negative-tone electron-beam lithography in combination with reactive-ion etching. A schematic picture of the NR antenna array is shown in Fig. 1c. The height and width of the NRs are kept constant at 50 and 60 nm, respectively), whereas the length increases in steps of 10 nm from L=110 nm to L=220 nm. The measured extinction spectra of Au NRs of three selected lengths are plotted in Fig. 1b together with the absorption and emission spectra of LH2 (ref. 28). The Au NR spectra are dominated by the excitation of the dipolar longitudinal resonance27,29. By varying the NR length, we have varied the extinction at the LH2 excitation and emission wavelengths (λ=800 and 870 nm, respectively); Fig. 1d. The maxima found at these wavelengths imply that strong emission and excitation enhancement would be expected for LH2 coupled to L=140–170 nm NRs.
Figure 1. Coupling LH2 to a gold nanoantennas in an ensemble measurement.
(a) Schematic presentation of a gold NR with an LH2 complex located in the antenna hot spot. (b) The absorption and emission spectra of LH2 in solution, and the extinction spectra of L=120, 160 and 200 nm NRs. The extinction spectra were measured with the polarization of the incident light parallel to the long antenna axis. (c) Schematic presentation of the NR array with increasing antenna length. The polarization of the excitation light is parallel to the NRs. (d) Extinction of the antennas at the excitation (λ=800 nm) and emission (λ=870 nm) wavelength as a function of antenna length. (e) Confocal fluorescence image of LH2 in PVA spin-coated over NRs with length increasing from L=110–220 nm. The intensity is normalized to the unenhanced emission coming from ~\n800 LH2s in our diffraction limited focus. Scale bar, 10 μm. (f) Average fluorescence enhancement. The maximal enhancement is reached for L=160 nm Au NRs. Inset: histogram of the enhancement for 54 Au NRs of L=110, 160 and 220 nm.
First, we identify the NR length that induced the strongest LH2 fluorescence enhancement. To this end, LH2 was diluted in an aqueous polyvinyl alcohol (PVA) solution and spin-casted (3,000 r.p.m., 30 s) on the NR arrays. The thickness of the PVA layer was 30±15 nm. The distance between the LH2 emitter (B850 bChls) and the Au NR is distributed over the layer thickness. Confocal fluorescence images were obtained under excitation with λ=800 nm light (Fig. 1e). The average fluorescence enhancement as function of NR lengths is plotted in Fig. 1f and the enhancement distribution of L=110, 160 and 220 nm Au NRs in the inset. The average enhancement was strongest, almost sixfold, for L=160 nm, which is consistent with the strong extinction found for the excitation and emission wavelengths for these antennas (Fig. 1d). This average value allowed us to identify the optimal NR length. About 800 LH2 complexes were excited in the focal volume of the objective, based on the fluorescence intensity compared with that of a single LH2. Only a small fraction of these 800 complexes was located in the antenna hot spots. As such, the signal of these strongly enhanced complexes is effectively ‘diluted’ by the high number of unenhanced complexes.
Strongly enhanced emission from single LH2 complexes
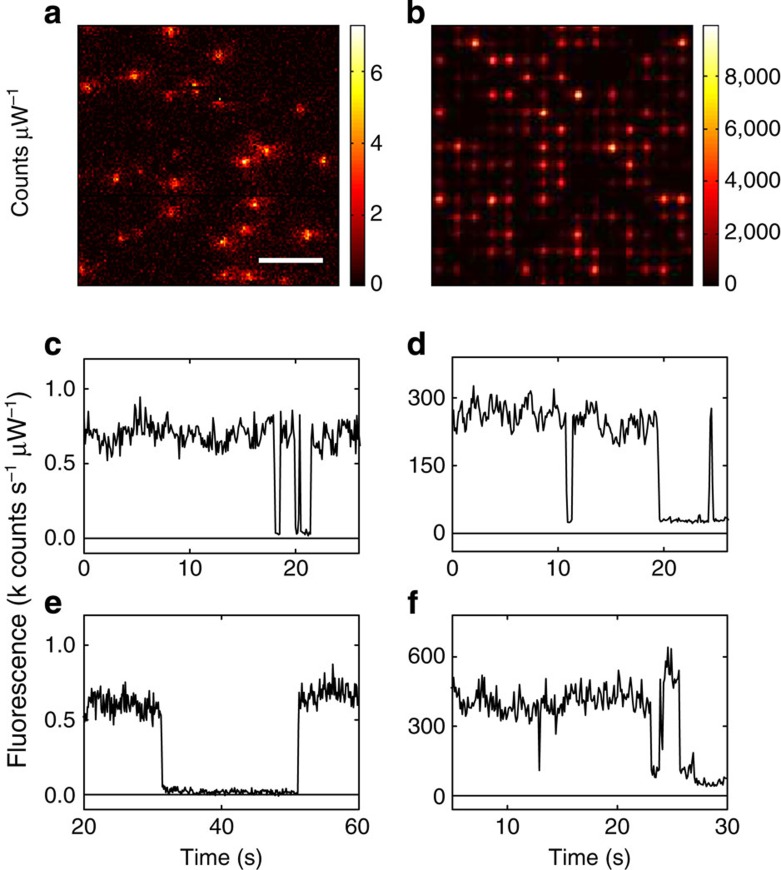
Next, we focused on the enhancement of individual complexes. To this end, the concentration of LH2s in the PVA solution was decreased 80 times (ODλ=860=0.025 cm−1) and spin-casted over arrays of L=160 nm NRs to have~\n10 LH2 per diffraction limited spot and effectively ~\n1 LH2 per antenna ‘hot spot’. For comparison of the enhanced fluorescence to that of unenhanced LH2 complexes, a highly diluted LH2–PVA buffer was spin-casted over a coverslip, resulting in <1 LH2 per diffraction limited volume. Confocal fluorescence images of LH2 in the absence and presence of antennas were recorded (Fig. 2a,b). The photo counts were normalized to the same excitation laser beam power to allow a direct comparison of the emission intensity in both cases. LH2s coupled to single L=160 nm NRs show strongly enhanced fluorescence by 2–3 orders of magnitude. The intensity of a large number of single unenhanced LH2s was recorded (example traces Fig. 2c,e) to obtain the average fluorescence intensity of a single complex for a given excitation power (see Methods section). Time traces of LH2s coupled to single L=160 nm NRs demonstrate strongly enhanced fluorescence. The clear on/off blinking to the background level (Fig. 2d,f) reveals that the emission indeed arises from a single LH2 complex. The fluorescence intensities of the specific single LH2 complexes presented in Fig. 3d,f are enhanced 396±59 and 523±78 times, respectively.
Figure 2. Strong fluorescence enhancement of single LH2 complexes.
(a) Fluorescence image of single LH2 complexes in PVA without Au NRs. The integration time was 4 ms per pixel (100 nm × 100 nm). The laser intensity was 2.6 μW. (b) Fluorescence images of LH2 coated over array of L=160 nm Au NRs. The polarization of the excitation light was along the long axis of the NRs. The laser intensity has been reduced by a factor of 35 compared with (a). Scale bars (a,b) 4 μm. (c,e) Fluorescence time trace of single unenhanced LH2 complex. (d,f) Fluorescence time trace of enhanced LH2 complex. The on/off blinking to a low background level shows that most of the emission arises from a single complex. The excitation intensity was as in a,b. The enhancements were 396±59 (d) and 523±78 (f) fold.
Figure 3. Non-classical light emission from LH2 complexes enhanced by a gold antenna.
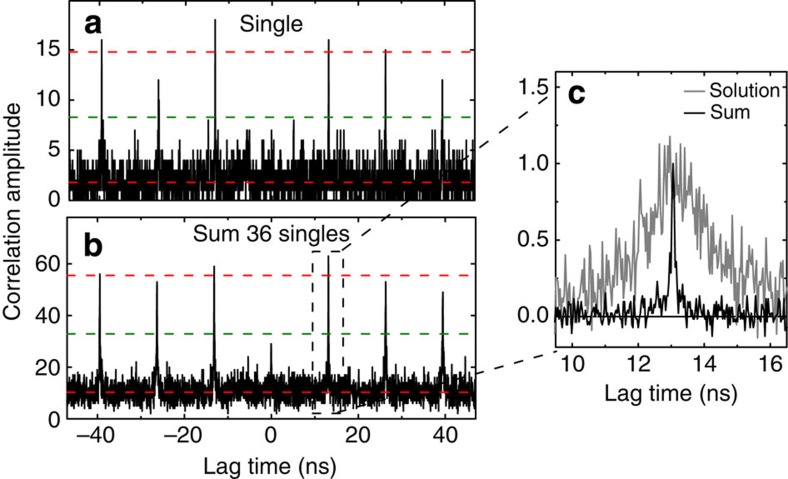
(a) Photon correlation statistics of single LH2 emission enhanced by a single L=160 nm antenna. The absence of the peak at zero time delay proves non-classical light emission. (b) Sum of 36 cases of single LH2–single antenna emission. The guide lines indicate the average background and peak intensity (red) and the 50% level (green). The time binning was 32 ps. Excitation at λ=800 nm with a repetition rate of 76 MHz. (c) The width of a single coincidence peak shows that the fluorescence lifetime of the LH2 complexes close to the antennas (sum) is strongly reduced compared with an ensemble of LH2 complexes in solution (corrected for the background and normalized to the maximum).
Enhanced LH2 emission shows photon antibunching
The observation of blinking, that is, discrete quantum jumps, is an indication of detecting single LH2s. Yet, a definite confirmation requires the analysis of photon statistics, that is, measurement of the time distribution between photon pairs in a second-order correlation function, commonly known as a photon antibunching measurement (see Methods section). The low photon yield and stability of LH2 at room temperature have so far prevented such antibunch experiments, whereas measurements at 2 K indicate that multi-chromophore light-harvesting complexes can show antibunching30. The antenna-enhanced bright LH2 complex now makes it feasible to acquire photon statistics even at room temperature. Figure 3a shows the photon correlation for a bright LH2 emitter. The 76-MHz laser repetition rate is recognized in peaks with 13.2 ns time difference. Importantly, the peak at zero time delay is missing, a clear signature of antibunching, indicating that the LH2 manifests as a single-photon emitter. To improve the photon statistics, 36 individual photon correlation traces were added up in Fig. 3b. The zero delay peak is clearly below 50%, as has been observed before for antenna-enhanced emission from monomeric dye molecules and single quantum dots29,31,32. Based on the area under the peaks33, we calculate that the emission arises on average from 1.47±0.04 LH2s on these 36 individual antennas. The observation of antibunching shows that the coupled LH2–antenna system, with its many coordinated pigments, acts as a single-photon emitter at ambient conditions. Interestingly, the width of the correlation peak gives information about the fluorescence lifetime. The correlation peak of the sum of 36 enhanced complexes is compared with that of an ensemble of LH2 in solution (Fig. 3c). It is clear that the fluorescence lifetime of the enhanced complexes is strongly reduced.
Antenna-enhanced fluorescence decay rates
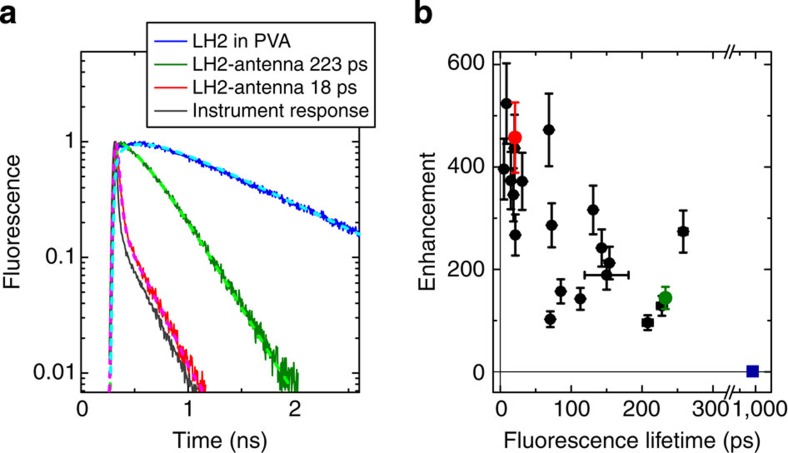
The observed bright emission is caused by both enhanced excitation and radiative rate. For a detailed investigation of rate enhancements, the fluorescence lifetime of antenna-coupled LH2 complexes were measured. To this end, the time traces (Fig. 2d,f) were recorded in Time-Tagged Time-Resolved mode that stores the photon arrival time at the detector relative to the corresponding laser pulse for every detected photon. Fluorescence decay histograms were acquired for 21 fluorescence traces that clearly showed single-molecule on/off blinking behaviour. Figure 4a shows typical fluorescence decay histograms of an ensemble of LH2s in PVA on glass (blue), two cases of antenna-enhanced single LH2 emission (red and green), and the Instrument Response Function (dark grey; 45 ps at full-width half-maximum). The fluorescence lifetime was obtained by fitting the histogram with a single exponential convoluted with the Instrument Response Function. The lifetime of LH2 in PVA on glass was found to be 980 ps, similar to its value in solution6, showing that LH2 is not quenched when present in a PVA layer. For some traces, a minor (<3% weight) second component with a lifetime ~\n1 ns was needed to improve the fit, which can be ascribed to background emission of such unenhanced LH2. The lifetime of the enhanced LH2 was strongly reduced from 980 ps on glass to 223 and 18 ps, for the two cases shown, indicating strong enhancement of the decay rates. We analysed the decay lifetime versus enhancement for an additional number of individual enhanced LH2–antenna systems. A scatter plot for single LH2s (Fig. 4b) demonstrates that stronger enhanced complexes also have shorter lifetimes. This relation can be explained by the fact that the strongest enhancement is reached at short distances from the antenna, where both excitation enhancement and decay rate enhancements are larger.
Figure 4. High enhancement with short lifetime of single LH2 emission.
(a) Time-correlated single-photon counting traces of LH2 in PVA on glass (blue), L=160 nm Au NR-enhanced LH2 emission (green, red) and the Instrument Response Function (dark grey). Lighter dashed lines are fits of the experimental data. The fitted lifetimes are indicated in the legend. The time binning was 4 ps and excitation at λ=800 nm. (b) Scatter plot of the fluorescence lifetime versus the enhancement for 21 LH2 complexes. The blue square indicates the bulk lifetime of unenhanced LH2 in PVA. The traces shown in a are indicated with the same colour in b. The s.d. of the single unenhanced LH2 emission level of 15% (see Methods section) was used for the enhancement error bar. For the lifetimes, 95% confidence intervals are indicated.
Modelling excitation and emission enhancement
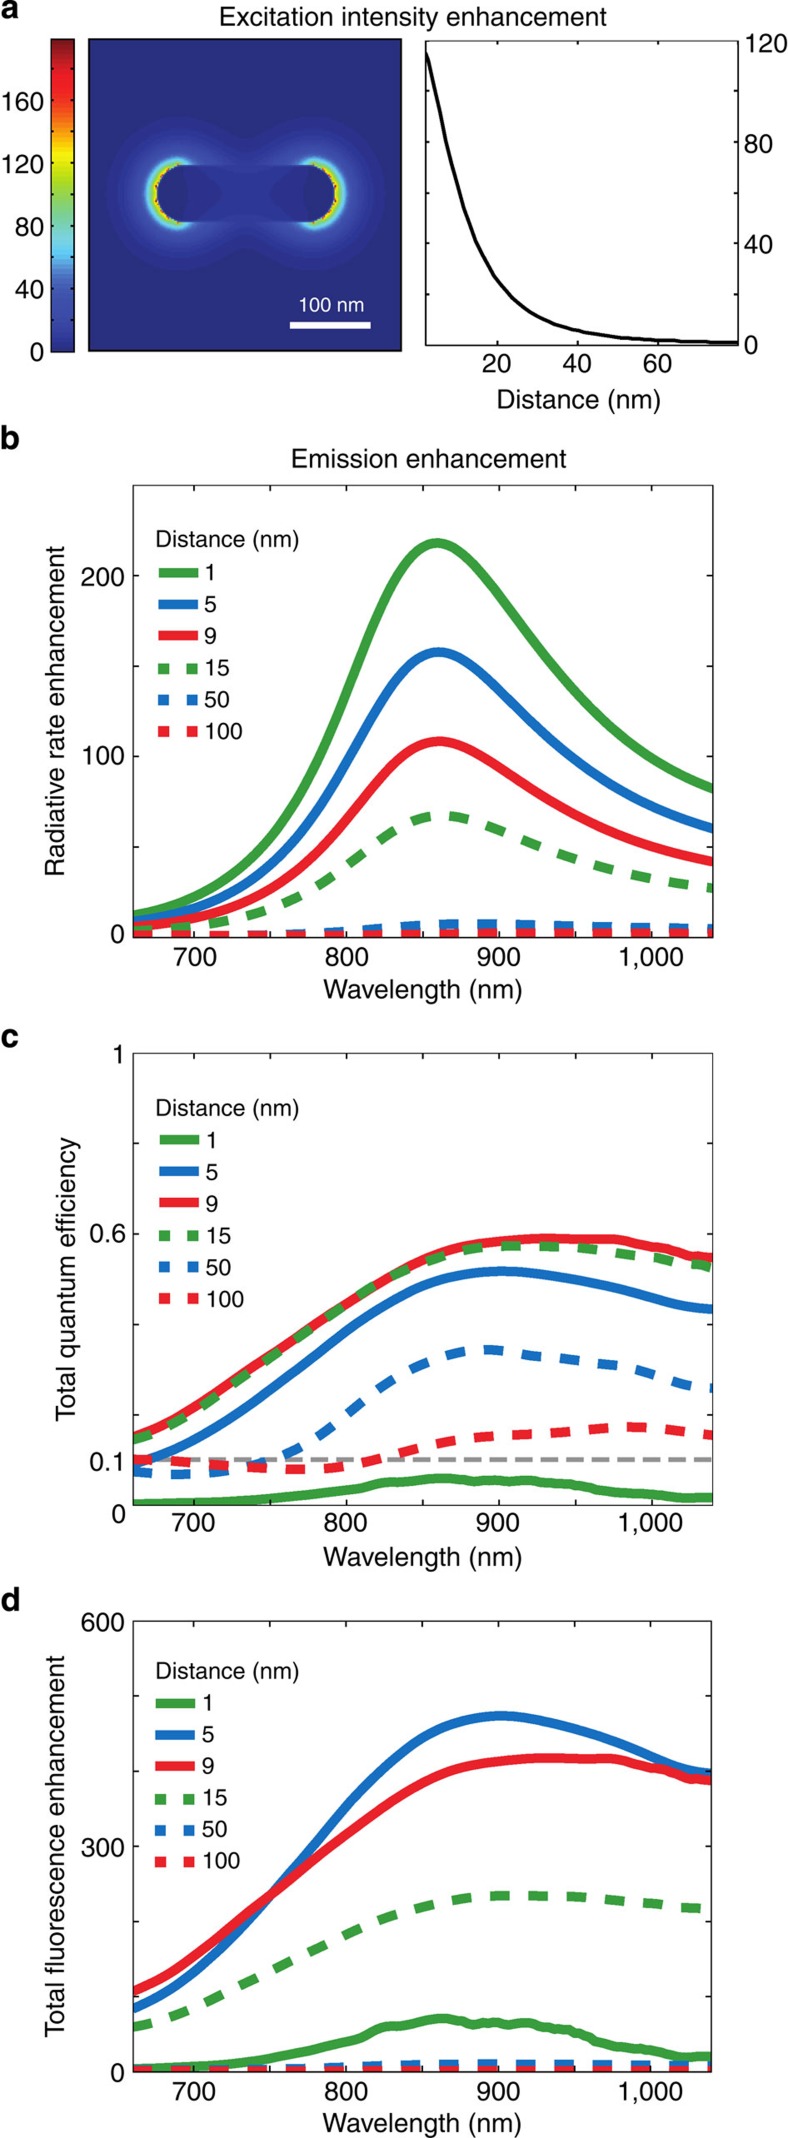
To further disentangle the contribution of excitation and QE enhancements to the total fluorescence enhancement, we performed finite-difference time-domain simulations of the antenna–emitter system34 (FDTD Solutions, Lumerical). The intensity distribution around an L=160 nm Au NR under plane wave illumination at λ=800 nm is shown in Fig. 5a. When compared with the intensity of the incident plane wave, the maximal excitation intensity enhancement is ~\n90 times at the end of the NR (Fig. 5a).
Figure 5. Simulations showing excitation and QE enhancements are responsible for the observed bright fluorescence.
(a) Local intensity enhancement |E|2 under plane wave excitation at λ=800 nm around a L=160 nm antenna. Left: in false colour scale. Right: as a function of distance from the surface. (b) Radiative rate enhancement for different distances of a dipole to the end of the antenna, oriented longitudinally with respect to the antenna. (c) Total QE of LH2–antenna system, taking into account an intrinsic 10% QE of LH2. (d) Total fluorescence enhancement for a dipole located at different distances to the NR.
An improvement in QE can be achieved by an enhancement in radiative rate in competition to non-radiative processes; through a high-radiative rate enhancement, the QE of a poor emitter tends to that of a good antenna. The radiative rate enhancement was calculated as a function of wavelength for a point dipole source positioned at different distances to the end of the L=160 nm NR and oriented longitudinally with respect to the rod (Fig. 5b). Even though modelling LH2 by a single-point dipole is a simplification, it is justified by considering that the bChl dipoles that are in line with the electromagnetic field are mostly responsible for the absorption in both the unenhanced and enhanced case. Also, the dipole in line with the antenna field is most strongly enhanced and will be the dominant emitter for each enhanced LH2 observed. The largest radiative rate enhancement of 220 times is found for the shortest sampled distance of 1 nm. However, at 1 nm separation ohmic losses into the gold are large, leading to an antenna radiation efficiency (QEant, the fraction of energy radiated into the far-field) of only 6%. Fortunately, this lossy process is strongly distance dependent, as a result QEant is already 57% at 5 nm and increases to 100% for larger separations. The total effective QE34 of the emission (Fig. 5c) was calculated from the radiative rate enhancement and QEant, taking into account the intrinsic QE0 of 10% of LH2 in the absence of the antenna. Multiplication of the field intensity enhancement with the QE enhancement gives the total fluorescence enhancement (Fig. 5d). The maximal enhancement for the LH2 emission wavelength (λ~\n870 nm) was found at a distance of 5 nm. At this position, the radiative rate is enhanced 160 times, resulting in a rate of 16 ns−1 (compared with 0.1 ns−1 in the absence of the antenna6). Taking into account the QE of 55%, it follows that the fluorescence lifetime is 34 ps. And the total fluorescence enhancement=5.5 (QE enhancement) × 90 (excitation enhancement)=490 times. The maximal observed experimental enhancement of 523 times is close to this value. The experimental observed lifetimes of complexes with enhancements larger than 400 times were ranging from 10 to 70 ps, which is in good agreement with the value of 34 ps obtained from the simulations.
Discussion
To summarize, our approach allows studying strongly enhanced LH2 emission, arising from a single complex, as shown by antibunching photon statistics. This is in contrast to the work of Kinkhabwala et al.35, where the largely enhanced signal made up less than half of the total intensity. Antibunching has been observed from single antenna-enhanced fluorophores and quantum dots29,31,32, yet it seems surprising that an LH2 complex with 27 bChls, of which 18 form the B850 band from which emission occurs, still shows behaviour of a single-photon emitter. This can only be the case if after excitation of multiple bChls in a single complex rapid singlet–singlet annihilation occurs36, leading to just one remaining excitation in the system. Thus, the observed antibunching confirms chromophore coupling between all 27 bChls inside the LH2 complex. The absence of local energy traps helps to explain efficient energy transfer in all directions in the natural membrane environment. To the best of our knowledge, this is the first report of room temperature photon antibunching for such a large number of coupled chromophores, enhanced by a nanoantenna.
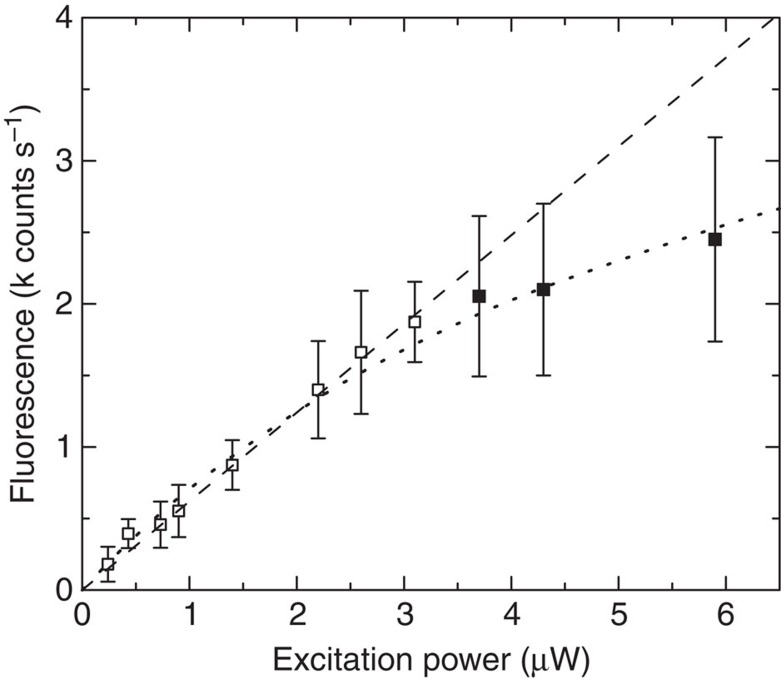
For single-molecule studies, the maximum Count Rate per Molecule (CRM) is an important parameter, which in the low excitation regime scales linearly with the excitation power and the fluorescence QE37. In LH2, the singlet excited B850 state can decay by inter-system crossing to the triplet state38. This triplet is transferred to an adjacent carotenoid that has an excited-state lifetime of several microseconds39. The excited triplet carotenoid is a very efficient quencher for the singlet bChl excitations by singlet–triplet annihilation40. Owing to these processes, saturation in LH2 sets on at relatively low excitation power (Fig. 6) that limits the maximum attainable CRM. Nanoantennas can increase the CRM in three ways as follows: by increasing the fluorescence QE; by shortening the fluorescence lifetime, such that the triplet yield will be lower and saturation occurs at higher excitation powers; and by directing the emission to increase the collection efficiency41. The dipolar nanoantennas used in this work do not affect the collection efficiency. However, they do increase the QE up to six times (Fig. 5c), meaning that six times as many photons are collected for the same number of excitations. In addition, the excitation power in the antenna ‘hot spot’ can be higher without suffering from saturation effects. Indeed, for the >500 times enhanced LH2 complex, the CRM was 15 times increased compared with the unenhanced case. The excitation enhancement was estimated to be ~\n90 times, whereas the laser power was reduced by 35 times, giving a ~\n2.6 times higher local intensity. Together with a 5.5 times increased QE, the CRM is expected to be 14 times higher based on the simulations, which is in good agreement with the experimental result.
Figure 6. Fluorescence intensity of single LH2 complexes.
The s.d. is shown; the number of measured complexes n=12–31 for each excitation power. The linear regression for the open symbol data points is shown (dashed). All data points were fitted with the general three-level model (dotted).
Strong plasmonic enhancement has been observed so far using monomeric dye molecules. In contrast, here we show large fluorescence enhancement of biologically relevant complexes. The maximal enhancement factor for a single LH2 complex was more than 500 times. This is one of the highest enhancement factors published to date35,41,42,43,44, showing that careful tuning of the antenna resonance with respect to the molecular emission spectrum results in very high enhancement with the potential to reveal new properties of bio-relevant complexes at the single-molecule level.
Methods
Sample preparation
LH2 was isolated from Rhodopseudomonas acidophila (strain 10,050), as described previously28. LH2 was diluted in 10 mM Tris, pH 8.0, 0.03% α-dodecyl-n-maltoside, 0.45% polyvinyl alcohol (Mowiol 20–98, Mw 125 kDa, Sigma-Aldrich) to an optical density at λ=860 nm of 2 cm−1 (ensemble measurements) or of 0.025 cm−1 (enhancement of single complexes), and spin-casted at 3,000 r.p.m., 30 s on the NR arrays. The thickness of the PVA layer was found to be 30±15 nm, as measured with a surface profiler (Alpha-Step IQ).
Time-resolved confocal microscopy
Confocal microscopy was performed on a commercial time-resolved confocal microscope (Micro Time 200, PicoQuant). For fluorescence excitation, linear polarized λ=800 nm (Ti:Sapphire laser, Coherent) pulsed laser light was used, with a repetition rate of 76 MHz. A high numerical aperture (NA) (1.46, × 100, Zeiss) oil immersion objective mounted on an inverted microscope (Olympus) was used for both excitation and fluorescence collection. The fluorescence light was separated from the excitation light by a dichroic mirror and long-pass filters (λLP=850 nm) and detected on a single-photon avalanche diode (PerkinElmer Inc.). Images were recorded by raster scanning the objective in 100 or 150 nm steps across the sample.
Fluorescence intensity of single LH2 complexes
LH2 was diluted in PVA and spin-coated over a glass coverslip to have <1 LH2 complex per diffraction limited spot. The experiments were performed under a constant flow of N2 (gas) to reduce photobleaching. The fluorescence intensity of single LH2 complexes was recorded for different excitation powers. For low excitation powers (open symbols), the average intensity scales linearly with the excitation power as shown in Fig. 6. Based on the measurements up to 3.1 μW, the average emission intensity of a single LH2 complex was found to be 605±90 counts s−1 μW−1, with a s.d. ~\n15%. At higher excitation powers (closed symbols) saturation of the fluorescence signal starts to play a role. All data points were fitted following the general three-level model for the fluorescence CRM=AIe/(1+Ie/Is), with A (=0.82) the pre-factor, Is (=6.5 μW) the saturation intensity and Ie the excitation intensity37. Unfortunately, it was impossible to measure the CRM for higher excitation powers, as the emission started to fluctuate strongly between different levels and possibly the complex got damaged.
Photon statistics
To measure the photon antibunching statistics, the emission was divided by a 50/50 beam-splitter and collected by two avalanche photodiodes (Hanbury Brown–Twiss configuration). The resulting photoelectron pulses give the start and stop signals for time-correlated single photon counting (TCSPC) electronics to obtain the intensity correlation as a function of the time delay between pairs of photons. After excitation by the laser pulse, one photon can be emitted and give a start pulse. After this, the molecule is in the ground state. When the duration of the excitation pulse is far shorter than the excited-state lifetime, only one photon can be emitted, because the ground state cannot emit. Therefore, in a pulsed excitation scheme the intensity correlation should be zero at zero delay33,45.
Author contributions
E.W. and N.F.v.H. designed the experiment; R.C. provided the LH2 sample; J.R. performed the nano-fabrication; A.G.C. performed the Finite Difference Time Domain (FDTD) simulations; E.W. performed the measurements and data analysis; and E.W., A.G.C. and N.F.v.H. wrote the manuscript. All authors discussed the results and contributed to the writing of the final manuscript.
Additional information
How to cite this article: Wientjes, E. et al. Strong antenna-enhanced fluorescence of a single light-harvesting complex shows photon antibunching. Nat. Commun. 5:4236 doi: 10.1038/ncomms5236 (2014).
Acknowledgments
This research was funded by the European Commission (ERC Advanced Grant 247330-Nano Antennas), Fundació CELLEX (Barcelona) and MINECO Plan Estatal project FIS2012-35527. R.C. thanks the Biotechnology and Biological Sciences Research Council (BBSRC) for financial support; and E.W. acknowledges financial support from the Marie-Curie International Fellowship COFUND and ICFOnest programme.
References
- Cogdell R. J., Gall A. & Köhler J. The architecture and function of the light-harvesting apparatus of purple bacteria: from single molecules to in vivo membranes. Q. Rev. Biophys. 39, 227–324 (2006). [DOI] [PubMed] [Google Scholar]
- McDermott G. et al. Crystal-structure of an integral membrane light-harvesting complex from photosynthetic bacteria. Nature 374, 517–521 (1995). [Google Scholar]
- Sundstrom V., Pullerits T. & van Grondelle R. Photosynthetic light-harvesting: Reconciling dynamics and structure of purple bacterial LH2 reveals function of photosynthetic unit. J. Phys. Chem. B 103, 2327–2346 (1999). [Google Scholar]
- Leupold D. et al. Size enhancement of transition dipoles to one- and two-exciton bands in a photosynthetic antenna. Phys. Rev. Lett. 77, 4675–4678 (1996). [DOI] [PubMed] [Google Scholar]
- Book L. D., Ostafin A. E., Ponomarenko N., Norris J. R. & Scherer N. F. Exciton delocalization and initial dephasing dynamics of purple bacterial LH2. J. Phys. Chem. B 104, 8295–8307 (2000). [Google Scholar]
- Monshouwer R., Abrahamsson M., vanMourik F. & vanGrondelle R. Superradiance and exciton delocalization in bacterial photosynthetic light-harvesting systems. J. Phys. Chem. B 101, 7241–7248 (1997). [Google Scholar]
- Weiss S. Fluorescence spectroscopy of single biomolecules. Science 283, 1676–1683 (1999). [DOI] [PubMed] [Google Scholar]
- van Oijen A. M., Ketelaars M., Kohler J., Aartsma T. J. & Schmidt J. Unraveling the electronic structure of individual photosynthetic pigment-protein complexes. Science 285, 400–402 (1999). [DOI] [PubMed] [Google Scholar]
- Brotosudarmo T. H. P. et al. Single-molecule spectroscopy reveals that individual low-light LH2 complexes from Rhodopseudomonas palustris 2.1.6. have a heterogeneous polypeptide composition. Biophys. J. 97, 1491–1500 (2009). [DOI] [PMC free article] [PubMed] [Google Scholar]
- Hofmann C., Aartsma T. J., Michel H. & Kohler J. Spectral dynamics in the B800 band of LH2 from Rhodospirillum molischianum: a single-molecule study. New J. Phys. 6, 8 (2004). [Google Scholar]
- Rutkauskas D., Novoderezkhin V., Cogdell R. J. & van Grondelle R. Fluorescence spectral fluctuations of single LH2 complexes from Rhodopseudomonas acidophila strain 10050. Biochemistry 43, 4431–4438 (2004). [DOI] [PubMed] [Google Scholar]
- Hildner R., Brinks D., Nieder J. B., Cogdell R. J. & van Hulst N. F. Quantum coherent energy transfer over varying pathways in single light-harvesting complexes. Science 340, 1448–1451 (2013). [DOI] [PubMed] [Google Scholar]
- Collini E. et al. Coherently wired light-harvesting in photosynthetic marine algae at ambient temperature. Nature 463, 644–669 (2010). [DOI] [PubMed] [Google Scholar]
- Engel G. S. et al. Evidence for wavelike energy transfer through quantum coherence in photosynthetic systems. Nature 446, 782–786 (2007). [DOI] [PubMed] [Google Scholar]
- Lee H., Cheng Y. C. & Fleming G. R. Coherence dynamics in photosynthesis: protein protection of excitonic coherence. Science 316, 1462–1465 (2007). [DOI] [PubMed] [Google Scholar]
- Tietz C., Chekhlov O., Drabenstedt A., Schuster J. & Wrachtrup J. Spectroscopy on single light-harvesting complexes at low temperature. J. Phys. Chem. B 103, 6328–6333 (1999). [Google Scholar]
- Fromm D. P., Sundaramurthy A., Schuck P. J., Kino G. & Moerner W. E. Gap-dependent optical coupling of single ‘Bowtie’ nanoantennas resonant in the visible. Nano Lett. 4, 957–961 (2004). [Google Scholar]
- Mühlschlegel P., Eisler H. J., Martin O. J., Hecht B. & Pohl D. W. Resonant optical antennas. Science 308, 1607–1609 (2005). [DOI] [PubMed] [Google Scholar]
- Farahani J. N., Pohl D. W., Eisler H. J. & Hecht B. Single quantum dot coupled to a scanning optical antenna: a tunable superemitter. Phys. Rev. Lett. 95, 017402 (2005). [DOI] [PubMed] [Google Scholar]
- Geddes C. D. & Lakowicz J. R. Metal-enhanced fluorescence. J. Fluoresc. 12, 121–129 (2002). [Google Scholar]
- Pellegrotti J. V. et al. Controlled reduction of photobleaching in DNA origami-gold nanoparticle hybrids. Nano Lett. 14, 2831–2836 (2014). [DOI] [PubMed] [Google Scholar]
- Chowdhury M. H., Ray K., Aslan K., Lakowicz J. R. & Geddes C. D. Metal-enhanced fluorescence of phycobiliproteins from heterogeneous plasmonic nanostructures. J. Phys. Chem. C 111, 18856–18863 (2007). [DOI] [PMC free article] [PubMed] [Google Scholar]
- Nieder J. B., Bittl R. & Brecht M. Fluorescence studies into the effect of plasmonic interactions on protein function. Angew. Chem. Int. Ed. 49, 10217–10220 (2010). [DOI] [PubMed] [Google Scholar]
- Beyer S. R. et al. Hybrid nanostructures for enhanced light-harvesting: plasmon induced increase in fluorescence from individual photosynthetic pigment-protein complexes. Nano Lett. 11, 4897–4901 (2011). [DOI] [PubMed] [Google Scholar]
- Bujak L. et al. Fluorescence enhancement of light-harvesting complex 2 from purple bacteria coupled to spherical gold nanoparticles. Appl. Phys. Lett. 99, 9015–9022 (2011). [Google Scholar]
- Kim I. et al. Metal nanoparticle plasmon-enhanced light-harvesting in a photosystem I thin film. Nano Lett. 11, 3091–3098 (2011). [DOI] [PubMed] [Google Scholar]
- Bryant G. W., De Abajo F. J. G. & Aizpurua J. Mapping the plasmon resonances of metallic nanoantennas. Nano Lett. 8, 631–636 (2008). [DOI] [PubMed] [Google Scholar]
- Gardiner A. T., Takaichi S. & Cogdell R. J. The effect of changes in light intensity and temperature on the peripheral antenna of Rhodopseudomonas acidophila. Biochem. Soc. Trans. 21, 6S (1993). [DOI] [PubMed] [Google Scholar]
- Curto A. G. et al. Multipolar radiation of quantum emitters with nanowire optical antennas. Nat. Commun. 4, 1750 (2013). [DOI] [PMC free article] [PubMed] [Google Scholar]
- Wrachtrup J. et al. inStructural and Electronic Properties of Molecular Nanostructures ed. Kuzmany H. 470–475American Institute of Physics (2002). [Google Scholar]
- Busson M. P., Rolly B., Stout B., Bonod N. & Bidault S. Accelerated single photon emission from dye molecule-driven nanoantennas assembled on DNA. Nat. Commun. 3, 962 (2012). [DOI] [PubMed] [Google Scholar]
- Akimov A. V. et al. Generation of single optical plasmons in metallic nanowires coupled to quantum dots. Nature 450, 402–406 (2007). [DOI] [PubMed] [Google Scholar]
- Ly S. et al. Stoichiometry of reconstituted high-density lipoproteins in the hydrated state determined by photon antibunching. Biophys. J. 101, 970–975 (2011). [DOI] [PMC free article] [PubMed] [Google Scholar]
- Mohammadi A., Sandoghdar V. & Agio M. Gold nanorods and nanospheroids for enhancing spontaneous emission. New. J. Phys. 10, 105015 (2008). [Google Scholar]
- Kinkhabwala A. et al. Large single-molecule fluorescence enhancements produced by a bowtie nanoantenna. Nat. Photon. 3, 654–657 (2009). [Google Scholar]
- Trinkunas G., Herek J. L., Polivka T., Sundstrom V. & Pullerits T. Exciton delocalization probed by excitation annihilation in the light-harvesting antenna LH2. Phys. Rev. Lett. 86, 4167–4170 (2001). [DOI] [PubMed] [Google Scholar]
- Wenger J. et al. Emission and excitation contributions to enhanced single molecule fluorescence by gold nanometric apertures. Opt. Express 16, 3008–3020 (2008). [DOI] [PubMed] [Google Scholar]
- Cogdell R. J., Hipkins M. F., Macdonald W. & Truscott T. G. Energy-transfer between the carotenoid and the Bacteriochlorophyll within the B-800-850 light-harvesting pigment-protein complex of Rhodopseudomonas-Sphaeroides. Biochim. Biophys. Acta 634, 191–202 (1981). [DOI] [PubMed] [Google Scholar]
- Bittl R., Schlodder E., Geisenheimer I., Lubitz W. & Cogdell R. J. Transient EPR and absorption studies of carotenoid triplet formation in purple bacterial antenna complexes. J. Phys. Chem. B 105, 5525–5535 (2001). [Google Scholar]
- Bradforth S. E., Jimenez R., Vanmourik F., Vangrondelle R. & Fleming G. R. Excitation transfer in the core light-harvesting complex (Lh-1) of Rhodobacter-Sphaeroides—an ultrafast fluorescence depolarization and annihilation study. J. Phys. Chem. 99, 16179–16191 (1995). [Google Scholar]
- Aouani H. et al. Bright unidirectional fluorescence emission of molecules in a nanoaperture with plasmonic corrugations. Nano Lett. 11, 637–644 (2011). [DOI] [PubMed] [Google Scholar]
- Acuna G. P. et al. Fluorescence enhancement at docking sites of DNA-directed self-assembled nanoantennas. Science 338, 506–510 (2012). [DOI] [PubMed] [Google Scholar]
- Yuan H., Khatua S., Zijlstra P., Yorulmaz M. & Orrit M. Thousand-fold enhancement of single-molecule fluorescence near a single gold nanorod. Angew. Chem. Int. Ed. 52, 1217–1221 (2013). [DOI] [PubMed] [Google Scholar]
- Punj D. et al. A plasmonic ‘antenna-in-box’ platform for enhanced single-molecule analysis at micromolar concentrations. Nat. Nanotechnol. 8, 512–516 (2013). [DOI] [PubMed] [Google Scholar]
- Basche T., Moerner W. E., Orrit M. & Talon H. Photon antibunching in the fluorescence of a single dye molecule trapped in a solid. Phys. Rev. Lett. 69, 1516–1519 (1992). [DOI] [PubMed] [Google Scholar]


