

Abstract
Purpose
To describe the spatial distribution of liver fat, using magnetic resonance imaging (MRI)-estimated proton density fat fraction (PDFF), in adults with non-alcoholic fatty liver disease (NAFLD).
Materials and Methods
This IRB-approved, HIPAA-compliant study prospectively enrolled fifty adults (30 women, 20 men) with biopsy-proven NAFLD. Hepatic PDFF was measured by low-flip-angle multiecho spoiled gradient-recalled-echo MRI at 3T. Three non-overlapping regions of interest were placed within each liver segment. Statistical analyses included Pearson’s correlation, multivariable linear regression, and permutation-based paired tests.
Results
The study population’s mean whole-liver PDFF was 16.1% (range: 1.6–39.6%). The mean whole-liver PDFF variability was 1.9% (range: 0.7–4.5%). Higher variability was associated with higher PDFF (r=0.34, p=0.0156). The mean PDFF was significantly higher in the right lobe than the left (16.5% vs. 15.3%, p=0.0028). The mean PDFF variability was higher in the left lobe than the right (1.86% vs. 1.28%, p<0.0001). Segment II had the lowest mean segmental PDFF (14.8%); segment VIII had the highest (16.7%). Segments V (0.71%) and VI (0.70%) had the lowest mean segmental PDFF variability; segment II had the highest (1.32%).
Conclusion
In adult NAFLD there are small but significant differences in fat content and variability between lobes and some of the segments.
Keywords: variability of hepatic steatosis, MR imaging-based fat quantification, liver fat, nonalcoholic fatty liver disease, proton density fat fraction
INTRODUCTION
Nonalcoholic fatty liver disease (NAFLD) is emerging as one of the most common causes of chronic liver disease, paralleling the rise in incidence of obesity and diabetes (1–4). The defining histological abnormality of NAFLD is hepatic steatosis, which refers to excessive triglyceride (fat) accumulation in hepatocytes. Hepatic steatosis is now considered the hepatic component of the metabolic syndrome (5) and has been associated with several cardiometabolic risk factors such as insulin resistance (6–8), visceral adiposity (9), hyperglycemia (10,11), and hypertriglyceridemia (12–14). Thus, the accurate quantification of hepatic fat accumulation is important in treatment and research of NAFLD.
It is known that in NAFLD the accumulation of fat within the liver tends to be diffuse but the distribution may be non-uniform (15,16). The non-uniform spatial distribution may introduce sampling error in fat quantification in clinical care as well as in cross-sectional and longitudinal studies, potentially resulting in misdiagnosis of individuals and inaccurate assessment of disease progression or regression over time. Studies using paired biopsies found some differences in the grade of steatosis. Comparing biopsy samples from the left and right lobe of the liver, Merriman et al. (17) found that 7 of 41 paired biopsy samples (17%) with steatosis differed by 1 grade (kappa = 0.88), while Larson et al. (18) reported a discrepancy of 1 grade in 2 of 43 paired biopsy samples (5%) and difference of 2 steatosis grades in 1 of 43 paired biopsy samples (2%) (kappa = 0.91). Ratziu et al. (19) reported a much lower concordance (kappa = 0.64) with a difference of at least 1 steatosis grade in 20 out of 100 biopsy pairs (20%) (17–19). Studies using paired single-voxel proton Magnetic Resonance Spectroscopy (1H MRS) measurements also found differences in MRS-determined fat fraction (coefficients of variation (CV) between 11.0% and 14.5%) between the left and right lobe as well as within the right lobe (2,20,21). While these studies made important observations, the techniques used in these studies (biopsy or single-voxel spectroscopy) could not assess the entire liver, and hence do not fully describe the spatial distribution of fat in the liver. A more complete description of spatial distribution may provide insight into the mechanisms of fat accumulation, may help inform the design of future clinical trials, and is best addressed by an imaging-based approach. Two recent imaging-based studies used advanced MRI techniques to measure the proton density fat fraction (PDFF) throughout the liver and reported standard deviations of PDFFs estimated in different hepatic regions. Kang et al. (22) reported average per-patient standard deviations that, depending on the exact MRI method, ranged from 0.42% to 0.53% across five 2.25cm2 regions of interest (ROI), three in the right and two in the left lobe. Hines et al. (23) reported per-patient standard deviations of 1.5% to 5.5% across nine variable-sized ROIs, one in each segment. However, as the emphasis of both studies was on the accuracy of the MRI techniques, the studies did not describe in detail the spatial distribution of fat in the liver.
The purpose of this study was to describe the spatial distribution of liver fat, using MRI-estimated PDFF, in adults with biopsy-confirmed NAFLD. Spatial distribution was evaluated by determining the mean PDFF and the variability in PDFF at the whole liver, lobar, and segmental levels.
MATERIALS AND METHODS
Study Design and Subjects
This prospective, cross-sectional, single-site clinical study was approved by an Investigational Review Board and compliant with the Health Insurance Portability and Accountability Act. Subjects were included if they were adults with biopsy-proven NAFLD and willing to undergo a research MRI examination of the liver and had signed informed consent. Subjects were excluded if they had any liver disease other than NAFLD. Recruitment took place in a single geographic region, and subjects were scanned at one imaging center between February 2009 and November 2010. A total of 50 subjects were recruited.
MR Examination
Subjects were scanned supine with an 8-channel torso phased-array receive coil centered over the liver at 3T (Signa Excite HD; GE Medical Systems, Milwaukee, WI, USA). Hepatic PDFF was measured noninvasively using a low-flip-angle multiecho spoiled gradient-recalled-echo (SGRE) MR imaging technique (24–26). Multislice, 2-dimensional, SGRE images of the whole liver were obtained in a single breathhold in the axial plane using all coil elements without parallel imaging. The field of view was adjusted to individual body habitus and breathhold capacity. A low flip angle (10°) with a repetition time ≥125 ms (125–270 ms, default 200 ms) were used to minimize T1 bias. (T1 bias refers to spurious overestimation of fat fraction due to the shorter T1 relaxation time of fat protons relative to water protons; use of low flip angle relative to TR is one method of minimizing T1 bias and thereby permitting more accurate fat fraction estimation (27–29). To assess fat-water signal interference effects and correct for T2* effects (28,30), six fractional echo magnitude images were obtained at serial echo times (TE) at which water and fat methylene peaks were nominally out-of-phase or in-phase at 3T (TEs of 1.15, 2.3, 3.45, 4.6, 5.75, and 6.9 ms) during a single breath-hold. Other imaging parameters were 8–10 mm slice thickness, 0% interslice gap, ±142 kHz receiver bandwidth, one signal average, 192 × 192 base matrix.
Image Analysis
For each subject, source images were reviewed by one reader (--, 6 years of experience analyzing MR images), blinded to all clinical and demographic information, on a diagnostic-quality digital monitor using OsiriX Imaging Software (Osirix, Pixmeo, Geneva, Switzerland). Avoiding organ boundaries, imaging artifacts, major vessels, and bile ducts, three round non-overlapping regions of interest (ROI) with a 10 mm diameter were placed manually in the center of each Couinaud segment of the liver (31), resulting in a total of 27 ROIs per subject, including 12 in the right lobe (segments V, VI, VII, and VIII) and 15 in the left lobe (segments I, II, III, IVa, and IVb). The placement of the ROIs is illustrated in Figure 1. ROI size was selected to provide reliable PDFF estimates while reducing risk of volume averaging with intra-hepatic vessels or liver surface. To reduce potential bias in ROI placement, ROIs were placed on one of the source images (the opposed phase image with the lowest TE) rather than on PDFF parametric maps, thereby blinding the reader to the PDFF values. The number of ROIs was chosen to permit assessment of variability at the segmental level. The ROIs were then automatically propagated to images at each of the remaining 5 TEs. Image registration was not necessary because images at each TE were acquired during the same breath-hold and thus already co-localized. The average signal intensity within each ROI was measured and recorded.
Figure 1.

Illustration of ROI placement in 47-year-old man with NAFLD. Three circular ROIs 1 centimeter in diameter were placed in representative portions of each of the 9 segments on PDFF maps. In this case, five sets of ROIs were placed on a superior slice and four on an inferior slice. ROI locations, PDFF values within each ROI, and segmental boundaries are overlaid. PDFF maps have dynamic range 0 to 50%.
The average segmental ROI value at each TE was entered into a fitting algorithm in MATLAB (MathWorks, Natick, MA), previously described by Bydder et al. (28), from which the PDFF was calculated assuming exponential T2* decay. This multi-interference spectral method models water as a single frequency signal at 4.7 ppm, and the total fat signal as a weighted sum of five individual fat signals at 0.9, 1.3, 2.1, 4.2, and 5.3 ppm with normalized weights, derived from human subjects with fatty liver disease, of 0.09, 0.70, 0.12, 0.04, and 0.05, respectively(32).
Statistical Analyses
The study sample’s demographic information was summarized descriptively.
We calculated the following measures for each subject based on the image analysis by the Reader:
Whole-liver PDFF and whole-liver PDFF variability (based on 27 ROIs in the entire liver). Whole-liver PDFF was defined as the mean of the PDFFs in all 27 ROIs; whole-liver PDFF variability was defined as the standard deviation (SD) of the PDFFs in all 27 ROIs.
Lobar PDFF and lobar PDFF variability for each of the two lobes (based on 12 ROIs in the right lobe and 15 ROIs in the left lobe). Lobar PDFF was defined as the mean of the PDFFs in the ROIs of that lobe; lobar PDFF variability was defined as the SD of the PDFFs in ROIs of that lobe.
Segmental PDFF and segmental PDFF variability for each of the nine segments. Segmental PDFF was defined as the mean of PDFFs in the 3 ROIs of that segment; segmental PDFF variability was defined as the SD of the PDFFs in the ROIs of that segment.
All of the within-subject measures described above then were summarized descriptively across the 50 subjects. Collected measures are illustrated in Figure 2. The relationship between PDFF and PDFF variability was assessed using Pearson’s correlations at whole-liver, lobar and segmental levels. The effect of age and gender on liver, lobar, and segmental PDFF measures was assessed using a series of multivariable linear regressions, where each of the measures separately was modeled as a function of age and gender. Coefficient of variation (CV) for paired data (33) was computed between the PDFFs of the left and right lobes and, to approximate the approach used in (2,20,21), between the PDFFs of every right lobe/left lobe pair of segments (e.g., V/I, V/II, V/III, V/Iva, V/IVb, VI/I, etc).
Figure 2.

Summary of Collected Measures.
Permutation-based paired tests were used to compare lobar PDFF between left and right lobes, and lobar PDFF variability between the left and right lobes, as well as segmental PDFF and segmental PDFF variability between every pair of segments (34). We used permutation tests, since in this setting they require fewer distributional assumptions than paired t-tests and are more powerful than the more commonly used non-parametric paired tests (35) Since comparing every pair of segments required a total of thirty-six comparisons, Hochberg’s procedure (a less stringent alternative to the Bonferroni correction) was used to adjust for multiple testing (36) and ensure the family-wise 0.05 significance level.
RESULTS
Subject Demographics
The study sample consisted of 30 women and 20 men (mean age 47 years, SD; 13.0, range: 19 –70) with biopsy-proven NAFLD who underwent a research MRI (Table 1).
Table 1.
Characteristics of the Study Sample.
| Demographics (n = 50) | mean ± SD (range) |
|---|---|
| Age, years | 47.2 ± 13.0 (19–70) |
| Male, n [%] | 20 [40%] |
| Female, n [%] | 30 [60%] |
| White, n [%] | 21 [42%] |
| Hispanic, n [%] | 18 [36%] |
| Other, n [%] | 11 [22%] |
| Weight, kg | 83.8 ± 19.6 (46.8 – 135.9) |
| Body Mass Index, kg/m2 | 29.8 ± 5.0 (19.5 – 41.2)* |
n-number; SD-Standard Deviation;
n = 46 due to missing height on 4 subjects
Whole-Liver PDFF summaries
The summaries of whole-liver PDFF and variability are presented in Table 2. The mean whole-liver PDFF across the 50 subjects was 16.1% with a range from 1.6 to 39.6%. (One subject had whole-liver PDFF of 1.6%; all other subjects had whole-liver PDFF > 4%). Age and gender did not affect whole-liver PDFF.
Table 2.
Summary of whole liver, lobar, and segmental PDFF.
| PDFF | VARIABILITY | |||||
|---|---|---|---|---|---|---|
|
| ||||||
| MEAN | RANGE | MIN-MAX | MEAN | RANGE | MIN-MAX | |
| Whole liver | 16.08 | 38.02 | (1.59–39.61) | 1.86 | 3.76 | (0.72–4.47) |
|
| ||||||
| Lobe | ||||||
| Left | 15.73 | 38.35 | (1.80–40.15) | 1.86 | 4.20 | (0.68–4.88) |
| Right | 16.52 | 37.59 | (1.34–38.93) | 1.28 | 2.95 | (0.36–3.31) |
|
| ||||||
| Segment | ||||||
| I | 15.16 | 35.0 | (2.64–37.64) | 1.23 | 5.44 | (0.11–5.54) |
| II | 14.79 | 36.81 | (1.91–37.82) | 1.32 | 4.65 | (0.04–4.68) |
| III | 15.77 | 39.74 | (0.62–40.36) | 1.11 | 2.59 | (0.13–2.72) |
| IVa | 16.52 | 39.12 | (1.65–40.76) | 1.11 | 3.44 | (0.11–3.55) |
| IVb | 16.42 | 41.48 | (1.77–43.25) | 1.08 | 4.03 | (0.10–4.12) |
| V | 16.18 | 40.58 | (0.39–40.97) | 0.71 | 1.65 | (0.07–1.65) |
| VI | 16.60 | 36.26 | (1.87–38.13) | 0.70 | 2.49 | (0.05–2.54) |
| VII | 16.61 | 36.02 | (1.79–37.81) | 0.87 | 3.96 | (0.05–4.01) |
| VIII | 16.68 | 38.71 | (1.34–40.05) | 0.86 | 2.06 | (0.17–2.23) |
The mean whole-liver variability across the 50 subjects was 1.9% with a range from 0.7% to 4.5%. 10% of subjects had whole-liver PDFF variability greater than 2.9%. Whole-liver PDFF variability increased as whole-liver PDFF increased (r = 0.34, p = 0.0156). Men had higher whole-liver variability than women (by 0.79%, p < 0.0015).
Lobar PDFF summaries
The summaries of lobar PDFF and variability are presented in Table 2. Figure 3 shows the left and right lobar PDFFs in the 50 subjects. As shown in the figure, the right lobar PDFF of the 50 study subjects was higher, on the average, than the left lobar PDFF (16.5 vs. 15.3%, permutation p = 0.0028). Age and gender did not affect right or left lobar PDFF. In 27 subjects (54%) the left lobar PDFF was lower than the right lobar PDFF. The mean difference between left and right lobes was 2.1%, ranging from 0.1% to 5.7%. In the remaining 23 subjects (46%) the right lobar PDFF was lower than the left lobar PDFF. The mean difference between left and right lobes was 0.8%, ranging from 0.2% to 2.1%. The CV between left and right lobar PDFF was 9%.
Figure 3.

Lobar PDFF. Individual left and right lobar PDFFs are connected by gray lines. The superimposed black line connects the lobar PDFF means. Standard deviations of PDFF across the fifty subjects for each lobe are shown on the graph.
Figure 4 shows the left and right lobar PDFF variability in the 50 subjects. As shown in the Figure, the left lobar PDFF variability of the 50 study subjects was higher, on the average, than the right lobar PDFF variability (1.86% vs 1.28%, permutation p < 0.0001). For both lobes, lobar PDFF variability increased as lobar PDFF increased, although the association was only significant in the left lobe (r = 0.34, p = 0.0156 left lobe; r = 0.13, p = 0.375 right lobe). Men had higher lobar PDFF variability than women (by 0.66%, p = 0.012 left lobe; by 0.44%, p = 0.0072 right lobe). Age did not affect left or right lobar PDFF variability.
Figure 4.

Lobar Variability. Individual left and right lobar variabilities are connected by gray lines. The superimposed black line connects the lobar variability means. Standard deviations of variabilities across the fifty subjects for each lobe are shown on the graph.
Segmental PDFF summaries
The summaries of segmental PDFF and variability are presented in Table 2. Figure 5 shows the segmental PDFF for each of the nine segments in the 50 subjects. Segment II had the lowest mean segmental PDFF; in paired permutation tests, the mean segmental PDFF for segment II was significantly lower than that of all other segments (permutation p<0.002 for all after the Hochberg correction). Segment I had the second lowest segmental PDFF, but only comparisons with segments 4a and 6 were significant (permutation p<0.002 for all comparisons and can be considered < 0.05 after the Hochberg correction). Segment VIII had the highest segmental PDFF, but only comparisons with segments II and V were significant (permutation p < 0.002 and < 0.02, respectively, and can be considered <0.05 after the Hochberg correction). There were no other significant comparisons. Age and gender did not affect segmental PDFF. The CVs between each right lobe/left lobe pair of segments ranged from 8.5% (segments IVa and VIII) to 16.0% (segments I and VIII), with an average of 12.2%.
Figure 5.
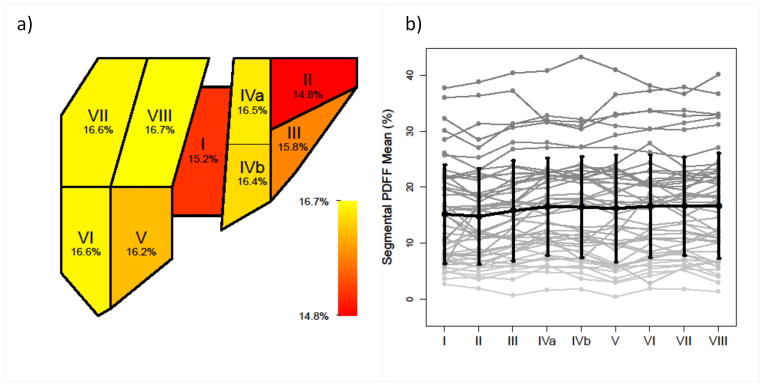
Segmental PDFF. (a) Heatmap representation of segmental PDFF means across 50 subjects, with color map ranging from red (lower values) to yellow (higher values). Mean PDFF for each segment is marked on the color bar. (b) Individual segmental PDFFs are connected by gray lines. The superimposed black line connects segmental PDFF means. Standard deviations of PDFF across the 50 subjects for each segment are shown on the graph.
Figure 6 shows the segmental PDFF variability for each of the nine segments in the 50 subjects. Segment V and VI had the lowest mean segmental PDFF variability; in paired permutation tests, the mean segmental PDFF variability for segments V and VI was lower than that of segments I, II, III, IVa, and IVb (permutation p < 0.002 for all and can be considered < 0.05 after the Hochberg correction). Segment II had the highest mean segmental PDFF variability; segmental PDFF variability for segments VII and VIII was significantly lower than that of segment II (permutation p < 0.002 after the Hochberg correction), and variability for segment VII was lower than the variability for Segment I (permutation p < 0.0021 and can be considered <0.05 after the Hochberg correction). The segmental PDFF variability increased with the segmental PDFF in 3 of the 9 segments (segments IVa, V, and VIII) (r = 0.38, 0.35, and 0.43, respectively, p = 0.006, 0.012, and 0.002, respectively). Men had higher PDFF variability than women in segment I only (by 0.62%, p = 0.04). Gender did not affect PDFF variability in any other segment. Age did not affect segmental PDFF variability.
Figure 6.

Segmental Variability. (a) Heatmap representation of segmental variability across 50 subjects, with color map ranging from red (lower values) to yellow (higher values). Mean variabilities for each segment are marked on the color bar. (b) Individual segmental variabilities are connected by gray lines. The superimposed black line connects segmental variability means. Standard deviations of variability across the 50 subjects for each segment are shown on the graph.
DISCUSSION
The aim of this study was to describe the spatial distribution of liver fat in adults with biopsy-confirmed NAFLD. We used MRI-estimated PDFF as a biomarker of liver fat content, because it can be estimated across the entire liver, and it has been shown to be accurate against spectroscopy (24,25,37) and histology (38), as well as reproducible across both field strength and scanner type (26) and hence provides generalizable, meaningful results. Moreover, PDFF measurements are independent of RF coil sensitivity (“B1” sensitivity) (39) or any other signal-intensity scaling factors, hence the observed spatial distribution of PDFF is not affected by proximity to the RF coil. By comparison alternative methods to assess liver fat would not have been suitable. While histology remains the gold standard for staging NAFLD, it is subject to interobserver variability (4–7), and due to invasiveness, is not appropriate for contemporaneously sampling each segment of the liver separately. Similarly, while single voxel MRS is considered the most accurate non-invasive method to quantify liver PDFF, it has limited spatial coverage, and it would be impractical to sample each segment separately. Multi-voxel MRS may permit sampling of each segment but is likely to be less accurate as it does not feasibly permit collection of the multiple echoes required for correction of T2 effects. Dual–echo MRI methods can evaluate signal fat fraction in the entire liver but the signal fat fraction depends on field strength and scanner, hence the results are not generalizable (22,40,41). Ultrasound provides only semi-quantitative estimates of liver fat content, and due to shadowing from ribs and other structures may not reliably image each segment in the liver. CT produces ionizing radiation, and has only modest correlation with liver fat content.
This is the first study to comprehensively describe the spatial distribution of liver fat in adults with NAFLD at the whole liver, lobar, and segmental levels. Our study population spanned the relevant range of liver PDFF of this condition, with the whole liver PDFFs ranging from 1.6% to 40%. We found small but significant differences in PDFF between different anatomic units. Mean PDFF was lower in the left lobe compared to the right, which is concordant with previous biopsy-based (18) and CT-based (42,43) studies. Among segments, segment II had the lowest PDFF, while segment VIII had the highest; prior studies have not formally addressed differences in fat between individual hepatic segments.
We also found small but significant differences in PDFF spatial variability between anatomic units. Whole liver spatial variability of PDFF in our study subjects ranged from 0.7% to 4.5%. Spatial variability was significantly greater in the left lobe than in the right lobe, and also in some segments compared to others, although the differences were small and of uncertain clinical significance. The variability of the PDFF at the whole-liver and lobar levels correlated with PDFF suggesting a tendency for greater heterogeneity in PDFF distribution with higher PDFF content; this observation differs from that of Hines et al (23), in which no significant relationship was found between average PDFF and PDFF variability. Men were found to have significantly higher variability than women at the whole liver and lobar levels, although the differences in variability between men and women were < 1%.
Our study confirms that in NAFLD the accumulation of fat within the liver tends to be diffuse but the distribution may be non-uniform. The degree of non-uniformity was small on average, with 0.79% mean difference in PDFF between the two lobes, 0.58% mean difference in spatial variability between the two lobes, and 9% CV between two lobes. Previous histology studies that biopsied each lobe of the liver separately reported steatosis grade discrepancies in 7–20% of subjects (17–19). It is difficult to compare the variability in fat distribution between lobes observed in this study with that reported in those histology studies because PDFF, the MRI biomarker of fat content, and steatosis grade, the histology biomarker of fat content, are fundamentally different. PDFF estimates fat content in three-dimensional tissue voxels based on the relative proton densities of fat and water while histology estimates fat content in two-dimensional slides based on percentage of cells containing fat vacuoles, and the translation between PDFF and steatosis grade has not yet been delineated. Additionally, PDFF is a continuous measure while the histology studies graded steatosis on a four-point ordinal scale. Hence it is unclear how the steatosis grade discrepancies in 7–20% of subjects correspond to PDFF spatial variability reported here. Previous MRS studies that placed one MRS voxel in each lobe of the liver reported paired CVs in hepatic FF ranging from 11 to 14.5% (2,20,21). We computed paired CV between every right lobe/left lobe pair of segments, thereby simulating the placement of one MRS voxel per lobe. Our CVs (8.5% to 16%) were in the same range as the CVs found by the MRS studies.
Our study found similar within-liver variability in MRI-PDFF as Hines et al (23) We found higher within-liver variability in MRI-PDFF than the study by Kang et al (22), plausibly due to differences in the study populations (96% of the Kang et al study subjects had PDFF < 8% and all subjects had PDFF < 15%).
A limitation of our study is that it does not explain the observed differences in the content or variability of fat, as measured by PDFF, between lobes and segments. Prior studies have suggested that fat may be deposited preferentially in certain portions of the liver depending on the regional portal venous and anomalous venous perfusion. Thus it is possible that some of the differences in fat content and variability may reflect differences in perfusion. It has also been shown that (44,45) there can be incomplete mixing of mesenteric and splenic blood at the portal confluence, with mesenteric blood preferentially shunted through the right portal vein into the right lobe and splenic blood preferentially shunted through the left portal vein into the left lobe. We speculate that different contributions of mesenteric vs. splenic blood to the different lobes and segments may in part explain our observations but this requires further study.
Another limitation is that we placed the regions of interest only in the center of segments, and thus our study assesses the spatial distribution of fat only at those locations. While this is relevant to MRI-based fat quantification, which consistently is measured in the center or lobes and segments in different studies (22,37,38), it does not provide a complete picture of the distribution of fat throughout the entire liver. For example, fat is known to deposit heterogeneously in certain characteristic locations around the gallbladder fossa, adjacent to fissures and along the subcapsular periphery of the liver. Our study was not designed to capture heterogeneity in these locations and further study will be needed to do that. As these sources of heterogeneity were not considered, our study likely underestimates the true heterogeneity in spatial distribution of fat within the liver.
This study was performed on a 3.0T magnet of one vendor, which is another limitation. We previously showed reproducibility between field strengths and vendors (26). The study population was selected at one academic center in one region of the U.S. and consisted mainly of white, Hispanic, and Asian subjects. This may limit the generalizability of these findings. The number of subjects was appropriate to address the study aims, but insufficient to study in more detail the subcategories of subjects with lower or higher PDFF, also of potential interest. Further studies in larger groups of patients with NAFLD are needed to confirm our results. A final limitation is that while we intended to include only subjects with NAFLD, one subject had liver fat of only 1.6%, possibly reflecting resolution of hepatic fat prior to the enrollment in the study.
In conclusion, this is to our knowledge the most comprehensive description of the distribution of liver fat in human subjects with NAFLD. Our study showed small but significant differences in fat content and variability between lobes and some of the segments. In our cohort, PDFF was higher and variability lower in the right lobe than in the left lobe. Segment II has the lowest fat and segment VIII has the highest fat, while segments VI and II had the lowest and highest variability, respectively. Men had slightly but significantly higher variability than women at the whole liver and lobar levels. Further studies are needed to confirm these results in a larger, geographically more diverse population and to delineate the mechanisms which underlie these lobar and segmental differences in fat distribution.
Acknowledgments
Grant Support:
This work is supported in part by the American Gastroenterological Association (AGA) Foundation – Sucampo – ASP Designated Research Award in Geriatric Gastroenterology and by a T. Franklin Williams Scholarship Award; Funding provided by: Atlantic Philanthropies, Inc, the John A. Hartford Foundation, the Association of Specialty Professors, and the American Gastroenterological Association to Rohit Loomba, MD. This work was also supported in part by the NIDDK (K23 DK090303 to Rohit Loomba, MD).
Funding was also supported by the Fulbright Program (Fulbright Scholarship to An Tang, MD), and the Canadian Institutes of Health Research (Fellowship Award 242199 to An Tang, MD). This research was supported by the National Institute of Health (grants NIDDK DK075128, NIDDK DK088925, NCMHD EXPORT P60 MD00220), and a research grant from General Electric.
References
- 1.Lazo M, Clark JM. The epidemiology of nonalcoholic fatty liver disease: a global perspective. Semin Liver Dis. 2008;28:339–350. doi: 10.1055/s-0028-1091978. [DOI] [PubMed] [Google Scholar]
- 2.Szczepaniak LS, Nurenberg P, Leonard D, et al. Magnetic resonance spectroscopy to measure hepatic triglyceride content: prevalence of hepatic steatosis in the general population. Am J Physiol Endocrinol Metab. 2005;288:E462–8. doi: 10.1152/ajpendo.00064.2004. [DOI] [PubMed] [Google Scholar]
- 3.Williams CD, Stengel J, Asike MI, et al. Prevalence of nonalcoholic fatty liver disease and nonalcoholic steatohepatitis among a largely middle-aged population utilizing ultrasound and liver biopsy: a prospective study. Gastroenterology. 2011;140:124–131. doi: 10.1053/j.gastro.2010.09.038. [DOI] [PubMed] [Google Scholar]
- 4.Loomba R, Abraham M, Unalp A, et al. Association between diabetes, family history of diabetes, and risk of nonalcoholic steatohepatitis and fibrosis. Hepatology. 2012;56:943–951. doi: 10.1002/hep.25772. [DOI] [PMC free article] [PubMed] [Google Scholar]
- 5.Marchesini G, Brizi M, Bianchi G, et al. Nonalcoholic fatty liver disease: a feature of the metabolic syndrome. Diabetes. 2001;50:1844–1850. doi: 10.2337/diabetes.50.8.1844. [DOI] [PubMed] [Google Scholar]
- 6.Bugianesi E, Moscatiello S, Ciaravella MF, Marchesini G. Insulin resistance in nonalcoholic fatty liver disease. Curr Pharm Des. 2010;16:1941–1951. doi: 10.2174/138161210791208875. [DOI] [PubMed] [Google Scholar]
- 7.Neuschwander-Tetri BA, Clark JM, Bass NM, et al. Clinical, laboratory and histological associations in adults with nonalcoholic fatty liver disease. Hepatology. 2010;52:913–924. doi: 10.1002/hep.23784. [DOI] [PMC free article] [PubMed] [Google Scholar]
- 8.Korenblat KM, Fabbrini E, Mohammed BS, Klein S. Liver, muscle, and adipose tissue insulin action is directly related to intrahepatic triglyceride content in obese subjects. Gastroenterology. 2008;134:1369–1375. doi: 10.1053/j.gastro.2008.01.07. [DOI] [PMC free article] [PubMed] [Google Scholar]
- 9.Francque S, Verrijken A, Mertens I, et al. Visceral adiposity and insulin resistance are independent predictors of the presence of non-cirrhotic NAFLD-related portal hypertension. Int J Obes (Lond) 2011;35:270–278. doi: 10.1038/ijo.2010.134. [DOI] [PubMed] [Google Scholar]
- 10.Larter CZ, Chitturi S, Heydet D, Farrell GC. A fresh look at NASH pathogenesis. Part 1: the metabolic movers. J Gastroenterol Hepatol. 2010;25:672–690. doi: 10.1111/j.1440-1746.2010.06253.x. [DOI] [PubMed] [Google Scholar]
- 11.Farrell GC, Larter CZ. Nonalcoholic fatty liver disease: from steatosis to cirrhosis. Hepatology. 2006;43:S99–S112. doi: 10.1002/hep.20973. [DOI] [PubMed] [Google Scholar]
- 12.Fabbrini E, Mohammed BS, Magkos F, Korenblat KM, Patterson BW, Klein S. Alterations in adipose tissue and hepatic lipid kinetics in obese men and women with nonalcoholic fatty liver disease. Gastroenterology. 2008;134:424–431. doi: 10.1053/j.gastro.2007.11.038. [DOI] [PMC free article] [PubMed] [Google Scholar]
- 13.Ulitsky A, Ananthakrishnan AN, Komorowski R, et al. A noninvasive clinical scoring model predicts risk of nonalcoholic steatohepatitis in morbidly obese patients. Obes Surg. 2010;20:685–691. doi: 10.1007/s11695-010-0118-y. [DOI] [PubMed] [Google Scholar]
- 14.Lee JY, Kim KM, Lee SG, et al. Prevalence and risk factors of non-alcoholic fatty liver disease in potential living liver donors in Korea: a review of 589 consecutive liver biopsies in a single center. J Hepatol. 2007;47:239–244. doi: 10.1016/j.jhep.2007.02.007. [DOI] [PubMed] [Google Scholar]
- 15.el-Hassan AY, Ibrahim EM, al-Mulhim FA, Nabhan AA, Chammas MY. Fatty infiltration of the liver: analysis of prevalence, radiological and clinical features and influence on patient management. Br J Radiol. 1992;65:774–778. doi: 10.1259/0007-1285-65-777-774. [DOI] [PubMed] [Google Scholar]
- 16.Grove A, Vyberg B, Vyberg M. Focal fatty change of the liver. A review and a case associated with continuous ambulatory peritoneal dialysis. Virchows Arch A Pathol Anat Histopathol. 1991;419:69–75. doi: 10.1007/BF01600155. [DOI] [PubMed] [Google Scholar]
- 17.Merriman RB, Ferrell LD, Patti MG, et al. Correlation of paired liver biopsies in morbidly obese patients with suspected nonalcoholic fatty liver disease. Hepatology. 2006;44:874–880. doi: 10.1002/hep.21346. [DOI] [PubMed] [Google Scholar]
- 18.Larson SP, Bowers SP, Palekar NA, Ward JA, Pulcini JP, Harrison SA. Histopathologic variability between the right and left lobes of the liver in morbidly obese patients undergoing Roux-en-Y bypass. Clin Gastroenterol Hepatol. 2007;5:1329–1332. doi: 10.1016/j.cgh.2007.06.005. [DOI] [PubMed] [Google Scholar]
- 19.Ratziu V, Charlotte F, Heurtier A, et al. Sampling variability of liver biopsy in nonalcoholic fatty liver disease. Gastroenterology. 2005;128:1898–1906. doi: 10.1053/j.gastro.2005.03.084. [DOI] [PubMed] [Google Scholar]
- 20.Johnson NA, Walton DW, Sachinwalla T, et al. Noninvasive assessment of hepatic lipid composition: Advancing understanding and management of fatty liver disorders. Hepatology. 2008;47:1513–1523. doi: 10.1002/hep.22220. [DOI] [PubMed] [Google Scholar]
- 21.van Werven JR, Hoogduin JM, Nederveen AJ, et al. Reproducibility of 3. 0 Tesla magnetic resonance spectroscopy for measuring hepatic fat content. J Magn Reson Imaging. 2009;30:444–448. doi: 10.1002/jmri.21837. [DOI] [PubMed] [Google Scholar]
- 22.Kang BK, Yu ES, Lee SS, et al. Hepatic fat quantification: a prospective comparison of magnetic resonance spectroscopy and analysis methods for chemical-shift gradient echo magnetic resonance imaging with histologic assessment as the reference standard. Invest Radiol. 2012;47:368–375. doi: 10.1097/RLI.0b013e31824baff3. [DOI] [PubMed] [Google Scholar]
- 23.Hines CD, Frydrychowicz A, Hamilton G, et al. T(1) independent, T(2) (*) corrected chemical shift based fat-water separation with multi-peak fat spectral modeling is an accurate and precise measure of hepatic steatosis. J Magn Reson Imaging. 2011;33:873–881. doi: 10.1002/jmri.22514. [DOI] [PMC free article] [PubMed] [Google Scholar]
- 24.Yokoo T, Bydder M, Hamilton G, et al. Nonalcoholic fatty liver disease: diagnostic and fat-grading accuracy of low-flip-angle multiecho gradient-recalled-echo MR imaging at 1. 5 T. Radiology. 2009;251:67–76. doi: 10.1148/radiol.2511080666. [DOI] [PMC free article] [PubMed] [Google Scholar]
- 25.Yokoo T, Shiehmorteza M, Hamilton G, et al. Estimation of hepatic proton-density fat fraction by using MR imaging at 3. 0 T. Radiology. 2011;258:749–759. doi: 10.1148/radiol.10100659. [DOI] [PMC free article] [PubMed] [Google Scholar]
- 26.Kang GH, Cruite I, Shiehmorteza M, et al. Reproducibility of MRI-determined proton density fat fraction across two different MR scanner platforms. J Magn Reson Imaging. 2011;34:928–34. doi: 10.1002/jmri.22701. [DOI] [PMC free article] [PubMed] [Google Scholar]
- 27.Hussain HK, Chenevert TL, Londy FJ, et al. Hepatic fat fraction: MR imaging for quantitative measurement and display--early experience. Radiology. 2005;237:1048–1055. doi: 10.1148/radiol.2373041639. [DOI] [PubMed] [Google Scholar]
- 28.Bydder M, Yokoo T, Hamilton G, et al. Relaxation effects in the quantification of fat using gradient echo imaging. Magn Reson Imaging. 2008;26:347–359. doi: 10.1016/j.mri.2007.08.012. [DOI] [PMC free article] [PubMed] [Google Scholar]
- 29.Liu CY, McKenzie CA, Yu H, Brittain JH, Reeder SB. Fat quantification with IDEAL gradient echo imaging: correction of bias from T(1) and noise. Magn Reson Med. 2007;58:354–364. doi: 10.1002/mrm.21301. [DOI] [PubMed] [Google Scholar]
- 30.Yu H, McKenzie CA, Shimakawa A, et al. Multiecho reconstruction for simultaneous water-fat decomposition and T2* estimation. J Magn Reson Imaging. 2007;26:1153–1161. doi: 10.1002/jmri.21090. [DOI] [PubMed] [Google Scholar]
- 31.Couinaud C. Surgical anatomy of the liver revisited. Paris, France: Maugein & Cie Press; 1989. [Google Scholar]
- 32.Hamilton G, Yokoo T, Bydder M, et al. In vivo characterization of the liver fat (1) H MR spectrum. NMR Biomed. 2011;24:784–790. doi: 10.1002/nbm.1622. [DOI] [PMC free article] [PubMed] [Google Scholar]
- 33.Jones R, Payne B, editors. Clinical investigation and statistics in laboratory medicine. ACB Venture Publications; London: 1997. [Google Scholar]
- 34.Good PI. Permutation tests: a practical guide to resampling methods for testing hypotheses. 2. Springer; New York: 2000. p. 270. [Google Scholar]
- 35.Romano JP. Bootstrap and Randomization Tests of some Nonparametric Hypotheses. The Annals of Statistics. 1989;17:141–159. [Google Scholar]
- 36.Hochberg Y. A sharper Bonferroni procedure for multiple tests of significance. Biometrika} 1988;75:800–802. [Google Scholar]
- 37.Meisamy S, Hines CD, Hamilton G, et al. Quantification of hepatic steatosis with T1-independent, T2-corrected MR imaging with spectral modeling of fat: blinded comparison with MR spectroscopy. Radiology. 2011;258:767–775. doi: 10.1148/radiol.10100708. [DOI] [PMC free article] [PubMed] [Google Scholar]
- 38.Permutt Z, Le TA, Peterson MR, et al. Correlation between liver histology and novel magnetic resonance imaging in adult patients with non-alcoholic fatty liver disease - MRI accurately quantifies hepatic steatosis in NAFLD. Aliment Pharmacol Ther. 2012;36:22–29. doi: 10.1111/j.1365-2036.2012.05121.x. [DOI] [PMC free article] [PubMed] [Google Scholar]
- 39.Sirlin CB, Reeder SB. Magnetic resonance imaging quantification of liver iron. Magn Reson Imaging Clin N Am. 2010;18:359–81. ix. doi: 10.1016/j.mric.2010.08.014. [DOI] [PMC free article] [PubMed] [Google Scholar]
- 40.Reeder SB, Cruite I, Hamilton G, Sirlin CB. Quantitative assessment of liver fat with magnetic resonance imaging and spectroscopy. J Magn Reson Imaging. 2011;34:729–749. doi: 10.1002/jmri.22580. [DOI] [PMC free article] [PubMed] [Google Scholar]
- 41.Qayyum A, Goh JS, Kakar S, Yeh BM, Merriman RB, Coakley FV. Accuracy of liver fat quantification at MR imaging: comparison of out-of-phase gradient-echo and fat-saturated fast spin-echo techniques--initial experience. Radiology. 2005;237:507–511. doi: 10.1148/radiol.2372040539. [DOI] [PubMed] [Google Scholar]
- 42.Tsang SW, Ng WF, Wu BP, Chow DA, Li ET, Wong TC. Predictors of fibrosis in Asian patients with non-alcoholic steatohepatitis. J Gastroenterol Hepatol. 2006;21:116–121. doi: 10.1111/j.1440-1746.2005.04146.x. [DOI] [PubMed] [Google Scholar]
- 43.Nomura F, Ohnishi K, Ochiai T, Okuda K. Obesity-related nonalcoholic fatty liver: CT features and follow-up studies after low-calorie diet. Radiology. 1987;162:845–847. doi: 10.1148/radiology.162.3.3809503. [DOI] [PubMed] [Google Scholar]
- 44.Copher GH, Dick B. “Stream line” phenomena in the portal vein and the selective distribution of portal blood in the liver. Arch Surg. 1928;17:408–419. [Google Scholar]
- 45.Hahn PF, Donald WD, Grier RCJ. The physiological bilaterality of the portal circulation. Am J Physiol. 1945;143:105–107. [Google Scholar]