

Abstract
Magnetic resonance imaging of hyperpolarized nuclei provides high image contrast with little or no background signal. To date, in-vivo applications of pre-hyperpolarized materials have been limited by relatively short nuclear spin relaxation times. Here, we investigate silicon nanoparticles as a new type of hyperpolarized magnetic resonance imaging agent. Nuclear spin relaxation times for a variety of Si nanoparticles are found to be remarkably long, ranging from many minutes to hours at room temperature, allowing hyperpolarized nanoparticles to be transported, administered, and imaged on practical time scales. Additionally, we demonstrate that Si nanoparticles can be surface functionalized using techniques common to other biologically targeted nanoparticle systems. These results suggest that Si nanoparticles can be used as a targetable, hyperpolarized magnetic resonance imaging agent with a large range of potential applications.
The use of nanoparticles for biomedical applications has benefited from rapid progress in nanoscale synthesis of materials with specific optical1–3 and magnetic properties,4 as well as bio-functionalization of surfaces, allowing targeting,5–7 in-vivo tracking,1,7,8 and therapeutic action.3,9 Porous silicon nanostructured material are of interest for molecular and cell-based biosensing, drug delivery, and tissue engineering applications.10,11 For magnetic resonance imaging (MRI), superparamagnetic nanoparticles have extended susceptibility-based contrast agents toward targeted imaging,4 though achieving high spatial resolution with high contrast remains challenging, especially in regions with natural magnetic susceptibility gradients. An alternative approach is direct MRI of hyperpolarized materials with little or no background signal. Hyperpolarized noble gases12–14 and 13C-enhanced biomolecules15,16 have demonstrated impressive image contrast, but are limited by short in-vivo enhancement times (∼ 10 s for noble gases,12 ∼ 30 s for 13C biomolecules15,16).
Nuclear magnetic resonance (NMR) in silicon has been widely investigated for half a century,17 and with renewed interest recently in the context of quantum computation.19 It is known that bulk silicon can exhibit multi-hour nuclear spin relaxation (T1) times at room temperature17 and can be hyperpolarized via dynamic nuclear polarization (DNP).18 The low natural abundance of spin-1/2 29Si nuclei (4.7%) embedded in a lattice of zero-spin 28Si nuclei isolates the active nuclear spins from one another and from the environment, leading not only to long T1 times, but also decoherence (T2) times of up to tens of seconds.19 Moreover, the weak dipole-dipole coupling of the sparse 29Si atoms, together with the isotropic crystal structure and the absence of nuclear electric quadrupole moment conspire to keep any induced nuclear polarization aligned with even very weak external fields as the nanoparticle tumbles in space, which occurs, for instance, in fluid suspensions.
This paper investigates in detail two critical properties of Si nanoparticles for their use as targetable hyperpolarized MRI imaging agents. First, we demonstrate for the first time that Si nanoparticles retain long T1 times at room temperature into the submicron regime, and investigate how T1 depends on size for a variety of commercial and ball-milled Si nanoparticles. This dependence is compared to a model of nuclear spin diffusion,18 yielding reasonable consistency between theory and experiment. Second, we demonstrate that long-T1 Si nanoparticles can be surface functionalized by methods similar to those used to prepare other targeted nanoparticle systems.20,21
Results
Particle Characterization
Particle size determines regimes of application to biomedicine22 as well as NMR properties.18 We investigated room-temperature NMR properties of Si particles spanning four orders of magnitude in mean diameter, from 40 nm to 1 mm. Particles were made by various methods, including ballmilling of nominally undoped (high-resistivity 30–100 kΩ-cm) and highly doped (low-resisitivity 0.01–0.02 Ω-cm) commercial silicon wafers, followed by segregation by size (see Methods). We also investigated chemically synthesized Si nanoparticles with mean diameters 40 nm (wet synthesis, > 99.99% elemental purity, Meliorum Corp.), 60 nm (wet synthesis, > 99.99% elemental purity, Meliorum Corp.), 140 nm (plasma synthesis, > 99% elemental purity, MTI Corp.) and 600 nm (electrical explosion synthesis, > 98% elemental purity, Nanostructured & Amorphous Materials, Inc.), obtained commercially. Figure 1 shows representative scanning electron microscope (SEM) images of all measured particles, along with volume-weighted size distributions obtained by SEM image analysis.
Figure 1. Sizes and shapes of silicon particles.
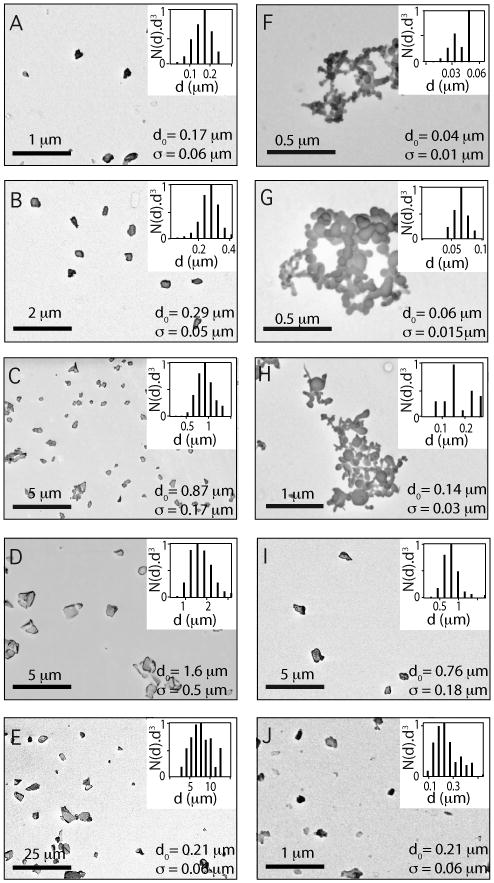
Electron micrographs of Si nanoparticles (A)-(E) ball milling high-resistivity silicon wafer, (F)-(G) wet synthesis (Meliorum) (H) plasma synthesis (MTI), (I) electrical explosion (NanoAmor) and (J) ball milling low-resistivity wafer. Insets: Volume-weighted histograms of diameters following size segregation along with averages d0 and standard deviations σ based on gaussian fits to distributions.
29Si NMR Measurements
Nuclear T1 times of dry Si nanoparticles were measured at room temperature at a magnetic field of 2.9 T using a saturation-recovery NMR pulse sequence with repeated spin-echoes for signal enhancement (see Methods). Values for T1 are extracted from exponential fits, A ∝ 1 − e−τpol/T1, to the Fourier amplitude, A, of the free induction decay (FID) and echoes as a function of polarization time, τpol (see Fig. 2, inset). Figure 2 shows T1 as a function of volume-weighted average particle diameter for the various samples, as well as a shell-core nuclear spin diffusion model,18 which has no free parameters. The model assumes T1 is determined by nuclear spin diffusion to the particle surface, where nuclear spin is quickly relaxed. Undoped ball-milled samples follow a roughly linear dependence on size, T1 ∝ d0, for d0 <∼ 10 μm, saturating at T1 ∼ 5 h for larger particles. The trend of increasing T1 in larger particles is qualitatively consistent with the shell-core model, and suggests that T1 is governed by surface relaxation. Electron spin resonance (ESR) measurements (see Supplementary Material S1) show a single peak corresponding to a g-factor of g=2.006, characteristic of Pb-type defect centers at the Si-SiO2 interface.23 The shift toward lower T1 compared to the core-shell model presumably reflects relaxation within the core, which can be attributed to defects and strain induced either by ball milling24 or noncrystallinity, depending on the method of synthesis. The highly doped ball-milled particles have T1 ∼ 200 s, independent of size. Here T1 is shortened due to relaxation by free carriers. Smaller commercial particles formed by wet synthesis (> 99.99% elemental purity, Meliorum) and plasma synthesis (> 99% elemental purity, MTI) have T1 times as long as 700 s, exceeding the predictions of the core-shell model. Larger commercial particles formed by electrical explosion (> 98% elemental purity, NanoAmor) have shorter T1 than the comparably sized high-resistivity ball-milled particles.
Figure 2. NMR properties of silicon particles.

Nuclear spin relaxation (T1) times at 2.9 T as a function of particle diameter d0 for various Si particles. Vertical error bars are from exponential fits to relaxation data; horizontal error bars are σ of size distributions (see Fig. 1). Inset: Fourier-transform NMR peak amplitude, A, as a function of polarization time τpol (see text) for the ball-milled high-resistivity particles with d0 = 0.17 μm. T1 values were measured using a saturation recovery spin echo pulse sequence described in the text.
We have also measured the inhomogeneous dephasing times, T2*, as a function of mean particle diameter for undoped ball milled samples at 4.7 T (using a Bruker DMX-200 NMR console). T2* ranges from 0.3 ms for d0 ∼ 0.2μm to 1.8 ms for for d0 ∼ 1000μm. We note that while T1 changes by two orders of magnitude over the range of measured particle sizes, T2* changes only by factor of ∼ 6.
MRI of Hyperpolarized Si Nanoparticles
A first demonstration of imaging hyperpolarized Si nanoparticles is shown in Fig. 3. A phantom in the shape of the letter H was filled with undoped ball-milled particles (d0 = 1.6μm) and allowed to equilibrate at low temperature (4.2 K) and high field (5 T) for 60 h,15 which enhanced the nuclear spin polarization a factor of ∼ 16 compared to room-temperature polarization at that field. The sample was then removed and imaged at room temperature at 4.7 T (using a Bruker DMX-200 spectrometer with a micro-imaging gradient set). The transfer from the low temperature environment to the imager required ∼ 60 s, much shorter than the T1 of the nanoparticles. The phantom was imaged using a small-tip-angle gradient-echo sequence25 with the following parameters: tip angle θ = 9°, echo time τ = 1.2 ms, field of view =15 mm, sample thickness = 2.5 cm, single pass (no averaging), acquisition time = 11 s. The resulting image is shown in Fig. 3B. MRI of the same sample equilibrated in the field of the imager at room temperature yielded no detectable image.
Figure 3. 29Si Magnetic resonance imaging of hyperpolarized Si nanoparticles.

(A) An H-shaped phantom filled with high-resistivity Si particles (d0 = 1.6 μm) pre-polarized at low temperature (T = 4.2 K) and high magnetic field (B = 5 T) for 60 h and warmed and transferred to a 4.7 T imager. (B) Single 29Si image of phantom in A. See text for imaging details. No 29Si Si image could be obtained without hyperpolarization using the same sequence.
Surface Functionalization
To examine the applicability of Si nanoparticles to targeted MRI, we prepared the Si nanoparticle surface for attachment to biological-targeting ligands. Nanoparticles were aminated using either (3-Aminopropyl)triethoxysilane (APTES) or a 1:2 mixture by volume of APTES with bis-(triethoxysilyl)ethane (BTEOSE) or (3-trihydroxysilyl)propyl methylphosphonate (THPMP) (see Fig. 4A and Methods).26 Results are shown for ball-milled high resistivity nanoparticles (d0 = 200 nm). Successful amination was assessed using fluorescence spectroscopy (Fig. 4B). The high level of fluorescence observed for aminated particles results from the covalent bonding of surface amino groups with fluorescamine, showing these functional groups were accessible for further reaction.
Figure 4. Biological surface modification of silicon nanoparticles.
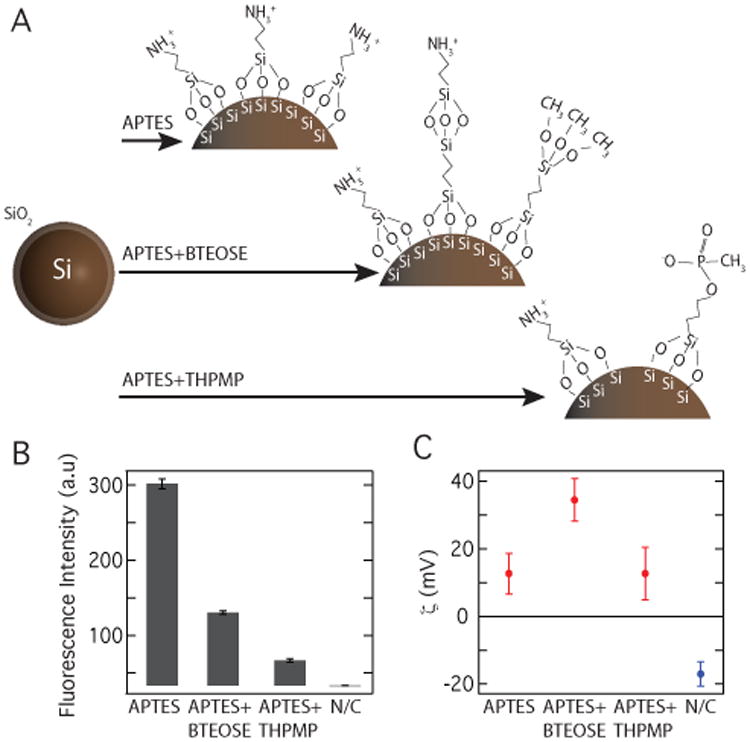
A Silicon particles (d0 = 0.2 μm) were aminated using either (3-Aminopropyl)triethoxysilane (APTES) alone or as a 1:2 mixture by volume of APTES with bis-(triethoxysilyl)ethane (BTEOSE) or (3-trihydroxysilyl)propyl methylphosphonate (THPMP in H2O). B Fluorescence spectroscopy confirmed the success of the amination reaction. No fluorescence was evident with the negative control (N/C). C A change in the sign of the surface charge, or zeta potential of the particles was evident after amination with the three amine groups (red) when compared to the negative control (blue).
In addition to chemical assays, the accumulation of amines was indirectly monitored by measuring the surface charge of the particles in solution, or zeta potential (ζ)27 (Fig. 4C). The surface of the unmodified silicon nanoparticles is composed of hydroxyl groups from the silicon dioxide and thus shows a negative zeta potential. Particles treated with APTES have surfaces coated with propylamines, which become protonated and positively charged in acidic solutions and show a positive zeta potential.27
Aminated particles were coated with poly(ethylene glycol) (PEG) polymers to confer stability and biocompatibility. PEG coating of silica and iron-oxide nanoparticles has been shown to be non-toxic28 and to reduce the rate of clearance by organs such as the liver or kidneys, thus increasing the particle's circulation time in-vivo.28 Pegylation was performed with either α-methyl-PEG-succinimidyl α-methylbutanoate (mPEG-SMB) (Nektar) or maleimide-PEG-N-hydroxysuccinimide (MAL-PEG-NHS) (Nektar)(see Methods section). Both SMB and NHS are reactive with amines on the particle surface. The stability of nanoparticles in solution was assessed using both dynamic light scattering (DLS) (Nano ZS90, Malvern) as a measure of the particles' hydrodynamic radius, and visual determination of flocculation and sedimentation. The particles treated with mPEG-SMB and NHS-PEG-MAL were both stable in phosphate-buffered saline (PBS) for a period of two days with no significant change in the hydrodynamic radius (see Supplementary Material S2). As a control, mPEG-Amine polymer, which does not contain amine-reactive groups, was used. The aminated particles treated with mPEG-Amine aggregated after centrifugation and resuspension in PBS. These results are consistent with other reports of the successful pegylation of SiO2 nanoparticles.29,30
Discussion
We have demonstrated several key features of Si nanoparticles that establish their potential as a hyperpolarized imaging agent for MRI, including long nuclear relaxation times and receptivity to surface modification with biologically compatible ligands. Room temperature nuclear relaxation (T1) times for all measured particles were found to be considerably longer than those of previously reported hyperpolarized MRI imaging agents,12,14-16 in the range of tens of minutes to hours. Moreover, T1 in the Si system can be tuned by size and doping, allowing optimization for specific applications in biomedical imaging. We examined T1 as a function diameter for particles made by ball-milling undoped silicon wafters as well as chemically synthesized nanoparticles. Preliminary measurements on other surface functionalized silicon nanoparticles31 indicate that the functionalization process does not reduce the nuclear T1 of the particles. MRI of Si nanoparticles was demonstrated at modestly enhanced polarization using low-temperature equilibration. While these polarizations are presumably too small for practical use, the results demonstrate that nanoparticles can be successfully transported through large magnetic and temperature gradients without a significant loss of an enhanced polarization. Significantly higher nuclear polarizations (exceeding 104) are expected using DNP, with corresponding improvements in image resolution and contrast. 12–16 Optimizing DNP to achieve high polarization will the subject of future work. The demonstrated coating with APTES and PEG are important steps for further surface functionalization and, ultimately, biological targeting. In conclusion, the data presented here are necessary for establishing the utility of Si nanoparticles as a flexible platform for imaging agents in MRI.
Methods
Nanoparticle Preparation and Size Separation
Nominally undoped float-zone grown Si wafers (Silicon Quest International) were 〈111〉 oriented, with residual p-dopants and nominal resistivity 30-100 kΩ-cm, depending on batch. Highly doped wafers (Virginia Semiconductor) were Czochralski grown, 〈100〉 oriented, boron-doped (p-type), with nominal resistivity 0.01-0.02 Ω-cm.
Ball-milled particle were processed as follows. Whole wafers were shattered using a mortar and pestle. Batches of 8.5 g wafer shards were dry ground for 10 minutes at 400 rpm in a planetary ball mill (Retsch PM100) using ten 1 cm diameter zirconia balls. The resulting powder was mixed with 20 ml of ethanol and milled under similar conditions for another 3.8 h. For a final milling, also at 400 rpm, fifty 3 mm diameter zirconia balls were used. The slurry was milled for times ranging from 1 h to 26 h, to give an approximately uniform size distribution between 100 nm and 1 μm. The ball-milled silicon nanoparticles in ethanol were separated by size using a centrifugational sedimentation process. Parameters were calculated using the Stokes equation.34 From repeated sonication and centrifugal separation a number of discrete particle size groups could be obtained.
Scanning Electron Microscopy and Size Characterization
Scannning electron microscopy and particle-measuring software (Gatan Digital Micrograph) were used to determine the size distributions of the nanoparticles. Dilute suspensions of silicon nanoparticles in ethanol were sonicated for ten minutes before being pipetted onto a vitreous carbon planchett which was mounted on a standard specimen holder with conducting carbon tape. An acceleration voltage of 2 kV was used. For each sample, > 1000 particles were analyzed, sourced from ∼ 50 images. Particle agglomeration seen in dry Meliorum and MTI samples has been reported in similarly sized silica nanoparticles,29 but is not expected to occur after pegylation. In these cases (Meliorum, MTI), individual measurement of the particle diameter from SEM images was used instead of software analysis.
T1 Measurements
Nuclear T1 times of the Si nanoparticles, segregated by size and packed dry in teflon NMR tubes, were measured at room temperature at a magnetic field of 2.9 T using a spin-echo Fourier transform method with a saturation recovery sequence. Following a train of sixteen hard π/2 pulses to null any initial polarization, the sample was left at field to polarize for a time τpol, followed by a Carr-Purcell-Meiboom-Gill (CPMG) sequence (π/2)x − [τ − (π)y − τ− echo]n with τ = 0.5 ms and n = 200. In Si and other nuclear-dipole-coupled materials echo sequences can yield anomalously long decay tails.33 However, the Fourier amplitude of the echo train still provides a signal proportional to initial polarization.33 Values for T1 are extracted from exponential fits, A ∝ 1 − e−τpol/T1, to the amplitude, A, of Fourier transform of the echo train for 200 echoes as a function of polarization time (see Fig. 2a, inset for an example).
Amination
Amination was performed using either (3-Aminopropyl)triethoxysilane (APTES, Sigma, 99%) alone or as a 1:2 mixture by volume of APTES with bis-(triethoxysilyl)ethane (BTEOSE, Aldrich, 96%) or (3-trihydroxysilyl)propyl methylphosphonate (THPMP, Aldrich, 42 wt% in H2O). The surface oxide was first etched with a dilute solution of hydrofluoric acid (8% in ethanol) followed by resuspension of the particles in ethanol. Approximately 100 mg of silicon nanoparticles were added to 45 mL of acidified 70% ethanol (0.04% v/v, adjusted to pH 3.5 with HCl) or methanol buffer (0.1 mM NaHCO3 in methanol) and the solution was placed in an ultrasonic bath for five minutes. Saline (0.10-0.15 M) was then added and the solution was shaken for 18-24 hours. Silanes were removed from the nanoparticle solution by washing and resuspending three times in methanol buffer, with the final resuspension performed with 10 mL of ethanol or methanol buffer.
Fluorescamine Assay
The concentrations of all of the particles were equalized by adjusting their absorption at 420 nm using a spectrophotometer (SpectraMax Plus, Molecular Devices). The fluorescamine reagent was prepared by dissolving 3.5 mg of fluorescamine (Sigma) in 1 mL of dimethyl sulfoxide (DMSO). Within a 96-well standard opaque tray, 10 μL of the fluorescamine solution were added simultaneously to each well containing 40 μL of nanoparticles and mixed thoroughly for one minute. Fluorescence was measured using an excitation at 390 nm and emission at 465 nm (SpectraMax Gemini XPS, Molecular Devices).
Pegylation
10 mg of PEG was mixed in 500 μL of methanol buffer and heated briefly at 50°C to dissolve. Approximately 0.1 mg of aminated particles (100 μL in solution) were added to this solution and it was placed in an ultrasonic bath for 1Ð3 h. To remove the unreacted PEG, samples were centrifuged and resuspended twice in methanol and finally in a phosphate-buffered saline solution (PBS, 0.1 M Na2HPO4, 0.015 M NaCl buffer).
Supplementary Material
Acknowledgments
We thank D. C. Bell, F. Kuemmeth, T. F. Kosar, C. Lara, D. Reeves, S. Rodriques, and J. R. Williams for technical contributions and D. J. Reilly, C. Farrar and B. Rosen for valuable discussions. This work was supported by the NIH under grant R21 EB007486-01A1, U54 CA119335, R01 CA124427 and by the NSF through the Harvard NSEC. Part of this work was performed at the Harvard Center for Nanoscale Systems (CNS), a member of the National Nanotechnology Infrastructure Network (NNIN), which is supported by the National Science Foundation under NSF award no. ECS-0335765.
Footnotes
Supporting Information Available: Electron spin resonance measurements, particle stability following PEGylation. This material is availble free of charge via the Internet at http://pubs.acs.org
References
- 1.Gao X, Cui Y, Levenson RM, Chung LWK, Nie S. In-Vivo Cancer Targeting and Imaging with Semiconductor Quantum Dots. Nat Biotechnol. 2004;22:969–976. doi: 10.1038/nbt994. [DOI] [PubMed] [Google Scholar]
- 2.Liu W, Howarth M, Greytak AB, Zheng Y, Nocera DG, Ting AY, Bawendi MG. Compact Biocompatible Quantum Dots Functionalized for Cellular Imaging. J Am Chem Soc. 2008;130:1274–1284. doi: 10.1021/ja076069p. [DOI] [PMC free article] [PubMed] [Google Scholar]
- 3.Hirsch LR, Stafford RJ, Bankson JA, Sershen SR, Rivera B, Price RE, Hazle JD, Halas NJ, West JL. Nanoshell-mediated Near-Infrared Thermal Therapy of Tumors under Magnetic Resonance Guidance. Proc Nat Acad Sci USA. 2003;100:13549–13554. doi: 10.1073/pnas.2232479100. [DOI] [PMC free article] [PubMed] [Google Scholar]
- 4.Weissleder R, Elizondo G, Wittenberg J, Rabito CA, Bengele HH, Josephson L. Ultrasmall Superparamagnetic Iron Oxide: Characterization of a New Class of Contrast Agents for MR Imaging. Radiology. 1990;175:489–493. doi: 10.1148/radiology.175.2.2326474. [DOI] [PubMed] [Google Scholar]
- 5.Atanasijevic T, Shusteff M, Fam P, Jasanoff A. Calcium-Sensitive MRI Contrast Agents Based on Superparamagnetic Iron Oxide Nanoparticles and Calmodulin. Proc Natl Acad Sci USA. 2006;103:14707–14712. doi: 10.1073/pnas.0606749103. [DOI] [PMC free article] [PubMed] [Google Scholar]
- 6.Akerman ME, Chan WCW, Laakkonen P, Bhatia SN, Ruoslahti E. Nanocrystal Targeting In-Vivo. Proc Nat Acad Sci USA. 2002;99:12617–12621. doi: 10.1073/pnas.152463399. [DOI] [PMC free article] [PubMed] [Google Scholar]
- 7.Weissleder R, Kelly K, Sun EY, Shtatland T, Josephson L. Cell-Specific Targeting of Nanoparticles by Multivalent Attachment of Small Molecules. Nat Biotechnol. 2005;23:1418–1423. doi: 10.1038/nbt1159. [DOI] [PubMed] [Google Scholar]
- 8.Högemann D, Ntziachristos V, Josephson L, Weissleder R. High Throughput Magnetic Resonance Imaging for Evaluating Targeted Nanoparticle Probes. Bioconjugate Chem. 2002;13:116–121. doi: 10.1021/bc015549h. [DOI] [PubMed] [Google Scholar]
- 9.Simberg D, Duza T, Park JH, Essler M, Pilch J, Zhang L, Derfus AM, Yang M, Hoffman RM, Bhatia SN, et al. Biomimetic Amplification of Nanoparticle Homing to Tumors. Proc Nat Acad Sci USA. 2007;104:932–936. doi: 10.1073/pnas.0610298104. [DOI] [PMC free article] [PubMed] [Google Scholar]
- 10.Tasciotti E, et al. Mesoporous Silicon Particles as a Multistage Delivery System for Imaging and Therapeutic Applications. Nature Nanotech. 2008;3:151–157. doi: 10.1038/nnano.2008.34. [DOI] [PubMed] [Google Scholar]
- 11.Park JH, Gu L, von Maltzahn G, Ruoslahti E, Bhatia SN, Sailor MJ. Biodegradable luminescent porous silicon nanoparticles for in-vivo applications. Nature Materials. 2009;8:331–336. doi: 10.1038/nmat2398. [DOI] [PMC free article] [PubMed] [Google Scholar]
- 12.Leawoods JC, Yablonskiy DA, Saam B, Gierada DS, Conradi MS. Hyperpolarized He-3 gas production and MR Imaging of the Lung. Concepts Magn Reson. 2001;13:277–293. [Google Scholar]
- 13.Schröder L, Lowery TJ, Hilty C, Wemmer DE, Pines A. Molecular Imaging Using a Targeted Magnetic Resonance Hyperpolarized Biosensor. Science. 2006;314:446–449. doi: 10.1126/science.1131847. [DOI] [PubMed] [Google Scholar]
- 14.Patz S, Muradian I, Hrovat MI, Ruset IC, Topulos G, Covrig SD, Frederick E, Hatabu H, Hersman FW, Butler JP. Human Pulmonary Imaging and Spectroscopy with Hyperpolarized Xe-129 at 0.2 T. Acad Radiol. 2008;15:713–727. doi: 10.1016/j.acra.2008.01.008. [DOI] [PMC free article] [PubMed] [Google Scholar]
- 15.Golman K, Olsson LE, Axelsson O, Mansson S, Karlsson M, Petersson JS. Molecular Imaging using Hyperpolarized 13C. Br J Radiol. 2003;76:118–127. doi: 10.1259/bjr/26631666. [DOI] [PubMed] [Google Scholar]
- 16.Nelson SJ, Vigneron D, Kurhanewicz J, Chen A, Bok R, Hurd R. DNP-Hyperpolarized C-13 Magnetic Resonance Metabolic Imaging for Cancer Applications. Appl Magn Reson. 2008;34:533–544. doi: 10.1007/s00723-008-0136-2. [DOI] [PMC free article] [PubMed] [Google Scholar]
- 17.Shulman RG, Wyluda BJ. Nuclear Magnetic Resonance of Si29 in n- and p-Type Silicon. Phys Rev. 1956;103:1127–1129. [Google Scholar]
- 18.Dementyev AE, Cory DG, Ramanathan C. Dynamic Nuclear Polarization in Silicon Microparticles. Phys Rev Lett. 2008;100:127601. doi: 10.1103/PhysRevLett.100.127601. [DOI] [PubMed] [Google Scholar]
- 19.Ladd TD, Maryenko D, Yamamoto Y, Abe E, Itoh KM. Coherence Time of Decoupled Nuclear Spins in Silicon. Phys Rev B. 2005;71:014401. [Google Scholar]
- 20.Schwartz MP, Cunin F, Cheung RW, Sailor MJ. Chemical Modification of Silicon Surfaces for Biological Applications. Phys Status Solidi A-Appl Mat. 2005;202:1380–1384. [Google Scholar]
- 21.Gupta AK, Gupta M. Synthesis and Surface Engineering of Iron Oxide Nanoparticles for Biomedical Applications. Biomaterials. 2004;26:3995–4021. doi: 10.1016/j.biomaterials.2004.10.012. [DOI] [PubMed] [Google Scholar]
- 22.Jiang W, Kim BYS, Rutka JT, Chan WCW. Nanoparticle-Mediated Cellular Response is Size-Dependent. Nature Nanotech. 2008;3:145–150. doi: 10.1038/nnano.2008.30. [DOI] [PubMed] [Google Scholar]
- 23.Nishi Y. Study of Silicon-Silicon Dioxide Structure by Electron Spin Resonance I. Jpn J Appl Phys. 1971;10:52–62. [Google Scholar]
- 24.Shen TD, Koch CC, McCormick TL, Nemanich RJ, Huang JY, Huang JG. The Structure and Property Characteristics of Amorphous/Nanocrystalline Silicon Produced by Ball Milling. J Mat Research. 1995;10:139–148. [Google Scholar]
- 25.Zhao L, Mulkern R, Tseng CH, Williamson D, Patz S, Kraft R, Walsworth RL, Jolesza FA, Albert MS. Gradient Echo Imaging Considerations for Hyperpolarized 129Xe MR. J Magn Reson Ser B. 1996;113:179–183. [PubMed] [Google Scholar]
- 26.Howarter JA, Youngblood JP. Optimization of Silica Silanization by 3-Aminopropyltriethoxysilane. Langmuir. 2006;22:11142–11147. doi: 10.1021/la061240g. [DOI] [PubMed] [Google Scholar]
- 27.Jana NR, Earhart C, Ying JY. Synthesis of Water-Soluble and Functionalized Nanoparticles by Silica Coating. Chem Mater. 2007;19:5074–5082. [Google Scholar]
- 28.Ferrari M. Cancer Nanotechnology: Opportunities and Challenges. Nat Rev Cancer. 2005;5:161–171. doi: 10.1038/nrc1566. [DOI] [PubMed] [Google Scholar]
- 29.Xu H, Yan F, Monson E, Kopelman R. Room-Temperature Preparation Characterization of Poly (ethylene glycol)-Coated Silica Nanoparticles for Biomedical Applications. J Biomed Mater Res. 2003;66A:870–879. doi: 10.1002/jbm.a.10057. [DOI] [PubMed] [Google Scholar]
- 30.Zhang Z, Berns AE, Willbold S, Buitenhuis J. Synthesis of Poly(ethylene glycol) (PEG)-Grafted Colloidal Silica Particles with Improved Stability in Aqueous Solvents. J Colloid Interface Sci. 2007;310:446–455. doi: 10.1016/j.jcis.2007.02.024. [DOI] [PubMed] [Google Scholar]
- 31.Cassidy MC, Atkins TM, Lee MY, Kauzlarich SM, Marcus CM. preparation [Google Scholar]
- 32.Jain RK. Delivery of Molecular and Cellular Medicine to Solid Tumors. Adv Drug Deliv Rev. 2001;46:149–168. doi: 10.1016/s0169-409x(00)00131-9. [DOI] [PubMed] [Google Scholar]
- 33.Li D, Dong Y, Ramos RG, Murray JD, MacLean K, Dementyev AE, Barrett SE. Intrinsic Origin of Spin Echoes in Dipolar Solids Generated by Strong π Pulses. Phys Rev B. 2008;77:214306. [Google Scholar]
- 34.Brown C. Particle Size Distribution by Centrifugal Sedimentation. J Phys Chem. 1944;48:246–258. [Google Scholar]
Associated Data
This section collects any data citations, data availability statements, or supplementary materials included in this article.