

Abstract
Purpose
To optimize acquisition parameters for three-dimensional fast spin-echo (3D FSE) imaging of the knee.
Materials and methods
The knees of 8 healthy volunteers were imaged in a 3 T MRI scanner using an 8-channel knee coil. A total of 146 intermediate-weighted isotropic resolution 3D FSE (3D-FSE-Cube) images with varied acquisition parameter settings were acquired with an additional reference scan performed for subjective image quality assessment. Images were graded for overall quality, parallel imaging artifact severity and blurring. Cartilage, muscle and fluid signal-to-noise ratios and fluid-cartilage contrast-to-noise ratios were quantified by acquiring scans without radiofrequency excitation and custom-reconstructing the k-space data. Mixed effects regression modeling was used to determine statistically significant effects of different parameters on image quality.
Results
Changes in receiver bandwidth, repetition time and echo train length significantly affected all measurements of image quality (p < .05). Reducing bandwidth improved all metrics of image quality with the exception of blurring. Reader agreement was slight to fair for subjective metrics, but overall trends in quality ratings were apparent.
Conclusion
We used a systematic approach to optimize 3D-FSE-Cube parameters for knee imaging. Image quality was overall improved using a receiver bandwidth of ±31.25 kHz, and blurring increased with lower bandwidth and longer echo trains.
Keywords: magnetic resonance imaging, three-dimensional fast-spin-echo, musculoskeletal imaging, sequence optimization
INTRODUCTION
Magnetic resonance imaging (MRI) is the leading modality for imaging soft tissue structures around joints, with multiple applications in clinical knee assessment (1,2). Visualization of cartilage and other anatomic structures in the knee requires high spatial resolution (3), with musculoskeletal applications increasingly using 3 T field strength to achieve this (4–6). At 3 T, knee MR is commonly performed using multislice 2D fast spin-echo (FSE) methods with intermediate and T2-weighting to visualize meniscal tears, ligament injury and cartilage damage (7–11). These methods are often additionally accelerated by interleaving multislice acquisitions and reducing the number of signal averages.
Two-dimensional FSE imaging is inherently limited by several factors. Acquisitions must be performed in multiple different planes to fully visualize certain anatomic structures because anisotropic voxel dimensions prevent useful reformations. Anisotropy can also limit the imaging of complex anatomic structures due to partial volume artifacts incurred by thick imaging slices. Slice gaps in multislice 2D imaging can obscure certain regions of anatomy of interest, while magnetization transfer effects can reduce signal from cartilage and other structures with high concentrations of protons bound to macromolecules (12,13).
To overcome the limitations of 2D FSE imaging, 3D FSE methods were developed and initially applied to neuroimaging and abdominal MRI (14–17). A new 3D FSE sequence with an extended echo train, 3D-FSE-Cube (formerly known as 3D FSE XETA), has been used for knee joint assessment and can achieve in-vivo voxel sizes of <0.7 mm isotropic at 1.5 T and 3 T (4). 3D FSE may be acquired with isotropic voxel sizes for optimal reformations, or acquired in an anisotropic manner that results in less optimal reformats but removed slice gaps.
To achieve isotropic resolution and high image quality, there are significant changes in 3D FSE compared with 2D FSE. Blurring from a long echo train (>40) is minimized by varying flip angles to constrain T2 decay (18–20). To reduce scan time, blurring and effective echo time (TEeff), 3D-FSE-Cube uses half-Fourier acquisition, view ordering techniques and the Autocalibrating Reconstruction for Cartesian sampling (ARC) parallel imaging technique (21–23).
Isotropic acquisition with 3D-FSE has important clinical potential, and may allow a single rapid acquisition for an entire knee protocol. An isotropic acquisition would allow for reformats in standard and oblique planes, similar to multi-detector CT. While image contrast would be limited to that of the initial acquisition, proton density or intermediate weighted images of the knee would provide much diagnostic information in a short scan time.
Previous studies have applied and evaluated 3D-FSE-Cube for knee imaging. While image signal-to-noise ratio (SNR) has been shown to be similar or superior to traditional 2D-FSE sequences at 3 T, 3D-FSE-Cube has been shown to produce images of comparable or slightly inferior quality in subjective and diagnostic evaluations of the knee and ankle (24–27). However, systematic determination of the optimal acquisition parameters that may further improve the image quality of 3D-FSE-Cube has not been performed (18,23,24,27–29).
Adjustment of parameters such as repetition time (TR), echo train length (ETL), number of signal averages (NEX) and parallel imaging acceleration factor affect scan time and image quality, while changes in receiver bandwidth (BW) affect spatial blurring and image noise. It is currently not known which parameter adjustments produce the greatest increases in image quality. Thus, this study was performed to optimize acquisition parameters for 3D-FSE imaging of the knee using subjective and objective metrics of image quality.
MATERIALS AND METHODS
Subjects and Imaging
This prospective study was performed in compliance with Health Insurance Portability and Accountability Act regulations, with approval from the Stanford University institutional review board and informed consent from the study participants.
MRI scans with varying parameter setting combinations were acquired on the right knees of eight healthy volunteers (4 women and 4 men, mean age 26 years, range 21–32 years; mean weight 64 kg, range 59–77 kg) with no history of prior knee surgery or injury, using a 3 T GE Signa (GE Healthcare, Waukesha, WI) with an eight channel transmit-receive knee coil (Invivo Inc., Gainesville, FL).
Four subjects received a protocol consisting of 20 sagittal 3D-FSE-Cube scans with varying TR, ETL, NEX and parallel imaging acceleration factor (see Table 1 for parameter ranges). Three additional subjects received a protocol consisting of 22 sagittal 3D-FSE-Cube scans which also varied BW in addition to varying TR, ETL, NEX and parallel imaging acceleration factor. The remaining eighth subject received a single sagittal 3D-FSE-Cube scan acquired with parameters set roughly in the center of the tested parameter ranges (see Table 1). This scan served as a reference for subjective quality assessment of the other seven scans.
Table 1.
Acquisition parameter settings for reference scan and parameter ranges for all other experimental scans.
| Parameter | Reference | Ranges | |
|---|---|---|---|
| minimum | maximum | ||
| TR | 2750 ms | 1000 ms | 5750 ms |
| ETL | 90 | 45 | 120 |
| ACC | 3.75 | 1 | 3.75 |
| NEX | 1 | 0.5 | 2 |
| BW | ±83.33 kHz | ±31.25 kHz | ±125 kHz |
| Scan time | 4 m 58 s | 4 m 42 s | 5 m 11 s |
| TEeff | 35 ms | ||
| Matrix size | 256×256 | ||
| FOV | 16 cm | ||
| Slice thickness | 0.6 mm | ||
| # slices | 180 | ||
| View-ordering | Radial | ||
| Fat saturation | On | ||
TEeff, matrix size, FOV, slice thickness, # slices, view-ordering and fat saturation were held constant for all scans.
Radial view ordering was employed to achieve a sufficiently short TEeff for intermediate weighting, and all scans were prescribed the same TEeff to maintain constant image weighting. Slice thickness and number, matrix size and FOV were not varied to maintain constant voxel size. Scan time was held roughly constant at approximately 5 minutes (range: 4 m 42 s – 5 m 11 s). The protocol was divided into two scanning blocks, allowing the subjects to receive each block of approximately one hour of scanning on separate days. Each block of scans was performed with the subject in the same position, and all scans in each block were identically prescribed from the same localizer.
For each set of scans using the same NEX, BW and parallel imaging acceleration factor, a noise-only acquisition was performed with RF excitation off. The statistical distribution of sampled noise was assumed to remain constant for constant acceleration factor, NEX and BW, given that the subject and his or her position in the scanner does not change either. No prescans were performed between scans with the same acceleration factor, NEX and BW and corresponding noise-only acquisitions to prevent shimming and automatic receiver gain adjustment (30). A total of 146 3D-FSE-Cube scans and 48 noise-only scans were acquired in addition to the single reference scan.
Objective Image Evaluation
SNR of patellar cartilage, synovial fluid and the gastrocnemius muscle and contrast-to-noise ratio (CNR) of synovial fluid and patellar cartilage were used as objective measures of image quality. SNR was measured by first reconstructing both signal and noise-only acquisitions in similar but separate reconstruction pipelines. Parallel-imaging calibration data, low-frequency phase correction data and coil sensitivities derived from signal data were applied to noise-only data reconstruction to most closely replicate the standard signal reconstruction process (31). The reconstruction pipeline is illustrated in Figure 1.
Figure 1.

Image reconstruction pipelines for signal data and noise-only data. Noise is reconstructed identically to signal data while incorporating signal data for parallel imaging, homodyne reconstruction and multichannel image combination operations.
To calculate SNR and CNR, VOIs (volumes of interest) were then placed in regions of patellar cartilage, synovial fluid and either the medial or lateral head of the gastrocnemius muscle on several contiguous slices in the custom-reconstructed signal and noise-only images using MIPAV (National Institutes of Health, Bethesda, MD). VOI locations were placed in anatomically similar locations for each subject. Mean VOI volumes ± standard deviation were 249 ± 84 mm3 for cartilage, 115 ± 56 mm3 for fluid and 1,185 ± 259 mm3 for muscle. Signal strength was calculated as the mean voxel values within VOIs in images acquired with RF on. Noise was calculated as the standard deviation of the voxel values within corresponding VOIs in images acquired with RF off. SNR was calculated as signal/noise, and CNR as
where noisefluid, cartilage is the standard deviation of the voxel intensities in the combined VOIs of fluid and cartilage.
Subjective Image Evaluation
In addition to objective SNR and CNR measurements, the 146 3D-FSE-Cube scans were evaluated subjectively for image quality by one fellowship-trained musculoskeletal radiologist and one medical student trained by the expert to evaluate images for subjective quality metrics. The radiologist had 10 years of post-fellowship clinical experience at the time of subjective scoring, and the medical student had 2 months of training in knee MRI quality assessment. Readers were blinded to image acquisition parameters and identifying subject information. Images were displayed using Osirix (http://www.osirix-viewer.com) and Sante DICOM Viewer FREE (www.santesoft.com). The scans were displayed in a randomized order side-by-side to the single quality reference scan. The readers evaluated each scan relative to the reference scan on an integer scale for several image quality metrics, which were overall parallel imaging artifact severity (specifically aliasing and structured noise), overall blurring and overall image quality. The scores, which ranged from −3 to 3, correspond to significantly, noticeably and slightly worse, no difference (score of zero), and slightly, noticeably and significantly better than the reference for each quality metric.
Statistical Analysis
Objective SNR and CNR measurements and subjective reader scores were analyzed using Stata Release 9.2 (StataCorp LP, College Station, TX) and R version 2.9.2 (www.r-project.org) with version 1.7–5 of the mgcv package for generalized additive mixed models to determine the effects of acquisition parameter changes on image quality. Between-reader agreement on qualitative measures was assessed with linearly weighted kappa to weight minor reader disagreements more than larger ones, with a 95% confidence interval estimated by 1,000-replication bootstrap. Effects of bandwidth, TR, and ETL on both objective and subjective measures were tested by a generalized additive mixed-effects regression of the measures on fixed effects of bandwidth (parametrically), TR (spline fit), and ETL (spline fit), with subject as the random effect. This analysis treated each parameter as an independent variable affecting image quality. A log link was used due to skewness.
RESULTS
The reference scan acquired with parameter settings in the approximate center of the experimental parameter range produced an image visually similar to current clinical 3D-FSE-Cube acquisitions (see Figure 2). Subjective reader evaluations and objective quantitative noise measurements of experimental scans with parameter modulation show that, overall, changes in acquisition parameters significantly affect quality metrics.
Figure 2.
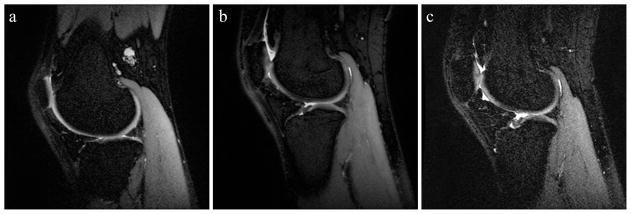
Sample sagittal slices from (a) the reference scan, (b) an experimental scan with an improved overall quality score compared to the reference, and (c) an experimental scan with a reduced overall quality score. Acquisition parameters for (b) and (c) were BW ±31.25 kHz, TR 3250 ms, ETL 105 and BW ±125 kHz, TR 4250 ms, ETL 75, respectively.
Objective Image Evaluation
All objective metrics were significantly affected by changing bandwidth, TR and ETL (p < .001). All SNRs and CNR were maximized at low bandwidth and long ETL. Cartilage and muscle SNR were overall reduced with longer TR, with local SNR maxima at TRs of approximately 2500 ms and 3000 ms for cartilage and muscle, respectively. These results are not independent of NEX and ACC, as they were adjusted in combination with TR and ETL to maintain a constant scan time. Conversely, fluid SNR and fluid-cartilage CNR both overall increased with longer TR. Example three-dimensional renderings of spline fits of cartilage SNR and fluid-cartilage CNR are shown in Figures 3 and 4 to better illustrate these relationships.
Figure 3.
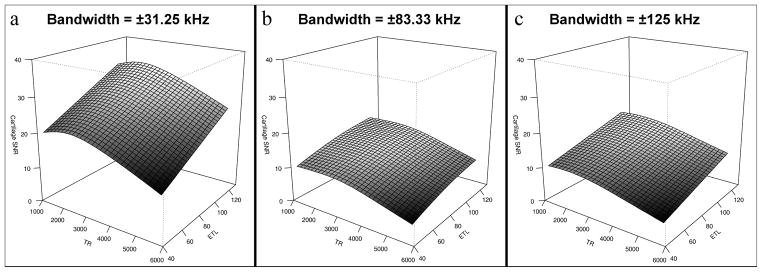
Surface renderings of three-dimensional spline fitting of cartilage SNR as a function of TR and ETL. Maximal SNR was achieved using low receiver bandwidth (±31.25 kHz), short TR and high ETL, with a local maximum at approximately TR = 2500 ms.
Figure 4.
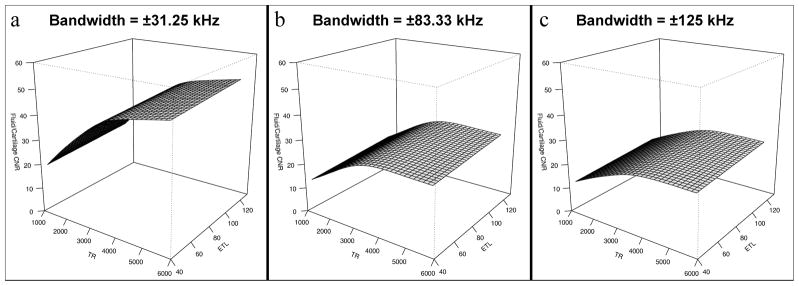
Surface renderings of three-dimensional spline fitting of fluid-cartilage CNR as a function of TR and ETL. Maximal CNR was achieved using low receiver bandwidth (±31.25 kHz), long TR and high ETL.
Subjective Image Evaluation
Agreement was slight to fair between the two readers, with the most agreement on overall image quality (linearly weighted kappa = 0.32, 95% CI = 0.21–0.43, p < 0.001) and the least on artifact severity (linearly weighted kappa = 0.11, 95% CI = 0.00–0.21, p = 0.014). Figure 5 shows the distribution of subjective quality scores for both readers. However, combined data from both readers show significant effects of bandwidth, TR and ETL on all subjective quality metrics (p < .05).
Figure 5.
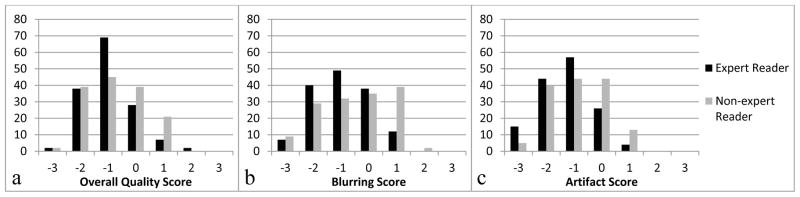
Histogram plots of subjective quality scores of overall quality (a), blurring (b) and parallel imaging artifact severity (c) for all images for both readers. The best inter-reader agreement (linearly weighted kappa = 0.32, 95% CI = 0.21–0.43, p < 0.001) was seen in overall quality (a), and the worst (linearly weighted kappa = 0.11, 95% CI = 0.00–0.21, p = 0.014) in artifact severity (c).
The relationships between acquisition parameter settings and subjective image quality metrics were more complex than those of objective quality. For our expert reader, overall image quality was maximized at low bandwidth with an approximate local maximum with regard to TR at 3000 ms (see Figure 6). Our expert reader graded blurring (Figure 7) as least severe with short TR, low ETL and high receiver bandwidth. Our non-expert reader showed similar trends. Artifact severity was also shown to be worst at high bandwidth for both readers and additionally at long TR and short ETL for the non-expert reader.
Figure 6.
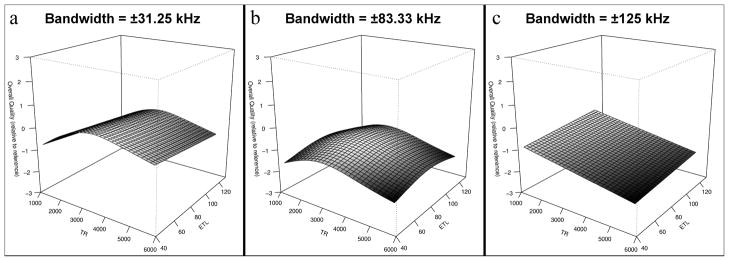
Surface renderings of three-dimensional spline fitting of overall image quality, as rated by the expert reader, as a function of TR and ETL. Maximal overall image quality was achieved using low receiver bandwidth (±31.25 kHz) and mid-range TR of approximately 3000 ms.
Figure 7.
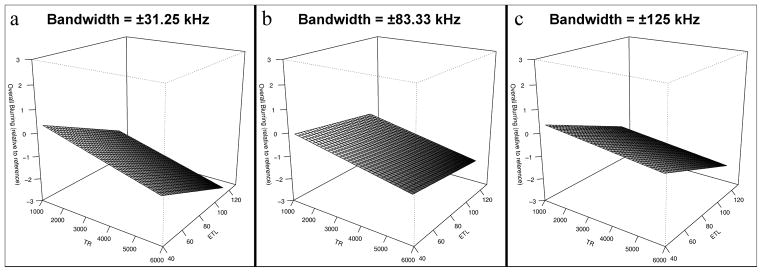
Surface renderings of three-dimensional spline fitting of blurring, as rated by the expert reader, as a function of TR and ETL. Blurring was minimized using high receiver bandwidth (±125 kHz), short TR and low ETL.
Example slices of the reference scan compared to representative scans illustrating both improved and worsened subjective quality scores for “overall blurring” and “overall parallel imaging artifact severity” are displayed in Figures 8 and 9. Notably, the example image with worsened blurring was acquired with an ETL of 120, compared to an ETL of 45 in the image with improved blurring. Parameter setting differences between examples of improved and worsened artifact severity include TR of 2000 ms and ETL of 120, and TR of 5000 and ETL of 90, respectively.
Figure 8.
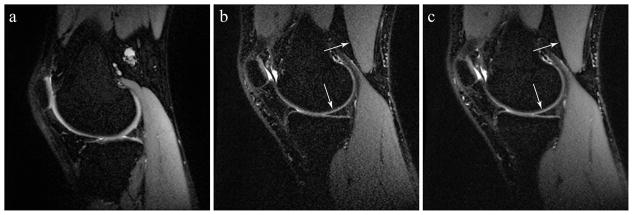
Sample sagittal slices from (a) the reference scan, (b) an experimental scan with improved overall blurring score (i.e. less blurring) compared to the reference, and (c) an experimental scan with worsened overall blurring score (i.e. more blurring). Arrows indicate tissue interfaces which reveal blurring effects. Acquisition parameters were BW ±125 kHz, TR 2500 ms, ETL 45 and BW ±125 kHz, TR 3500 ms, ETL 120, respectively.
Figure 9.
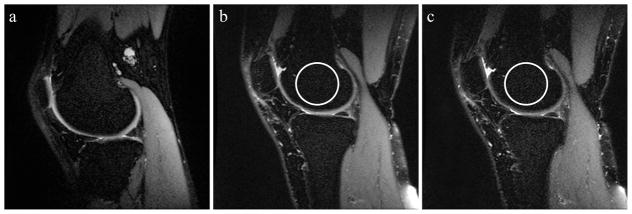
Sample sagittal slices from (a) the reference scan, (b) an experimental scan with improved parallel imaging artifact severity compared to the reference, and (c) an experimental scan with worsened artifact severity. Increased structured noise is subtly visibly apparent in areas with low signal, such as fat-suppressed regions of bone marrow circled in the figure. Acquisition parameters were BW ± 83.33 kHz, TR 2000 ms, ETL 120 and BW ±83.33 kHz, TR 5000 ms, ETL 90, respectively.
DISCUSSION
Three-dimensional FSE methods for clinical imaging are being developed to overcome several limitations of traditional two-dimensional sequences. 3D-FSE may be acquired with anisotropic voxels, however isotropic voxel sizes allows for image reformations into arbitrary planes and reduces partial volume artifacts. Flip angle modulation minimizes blurring and signal loss from T2 decay in the extended echo train of 3D-FSE-Cube, while parallel imaging and partial-Fourier acquisitions further reduce scan time.
Previous studies have investigated the clinical utility of 3D-FSE-Cube for knee imaging at 1.5 T and 3 T using various acquisition parameters on different hardware configurations without formal evaluation of parameter effects on image quality. Parameter ranges have included TR of 2200–2500 ms, ETL of 44–78, and BW of ±31.25 to ±44 kHz, while NEX and parallel imaging acceleration factor have remained constant in the literature (24,26,27,29,32). Other preliminary clinical studies have also evaluated 3D FSE protocols with variable flip angle implemented by Siemens (SPACE) and Philips (VISTA) for knee imaging at 3 T. These groups used acquisition parameters ranging from TR of 1200–1600 ms, ETL of 46–63, BW of ±111 to ±172.5 kHz, NEX of 1–1.7 and ACC of 2–2.5 (33–35). Overall scan times were longer, ranging from 6 m 48 s to 10 m 51 s, compared to 5–6 m for 3D-FSE-Cube scans. Our systematic evaluation of image quality in 3D-FSE-Cube acquisitions as affected by various acquisition parameters has revealed several statistically significant relationships between parameter settings and our metrics of image quality.
To accurately quantify objective image quality using SNR and CNR, advanced image noise measurement techniques were needed. As discussed in greater detail elsewhere, classic VOI in tissue and VOI in background methods of SNR estimations are invalid in ARC-accelerated, multi-channel root sum-of-square-reconstructed images, as is the case with 3D-FSE-Cube data (36–38). While other advanced SNR measurement techniques exist (30,39–42), a custom offline reconstruction pipeline was constructed to most accurately measure image SNR using signal data and noise-only data acquired without RF excitation (31).
As measured by both objective and subjective metrics, the lowest tested receiver bandwidth setting of ±31.25 kHz produced the highest image quality. Because image noise increases with receiver bandwidth, improved SNR and CNR at low bandwidth were expected. The higher subjective image quality scores may be explained by the increased image SNR at low bandwidth as well. As expected, worsened subjective scores of image blurring were incurred at low bandwidth. Future studies including pathology affected by blurring, such as meniscal tears, may include assessment of bandwidth lower than ±31.25 kHz.
The parameters TR and ETL were shown to affect the objective measures of SNR and CNR in a predictable manner. Although the observed overall negative correlation between TR and cartilage and muscle SNR is initially counterintuitive, this relationship can be explained by the confounding effect of changes in parallel imaging and NEX needed to keep the scan time constant. While prolonged TR increases the amount of recoverable longitudinal magnetization and thereby increasing SNR in spin-echo sequences such as 3D-FSE-Cube, either the acceleration factor must be increased or NEX decreased to offset the prolonged total scan time. As the TR values used in the experimental protocol are all approximately one to four times the T1 relaxation times of muscle and cartilage (4), TR longer than 3000 ms does not appreciably increase SNR, but higher acceleration and lower NEX decrease SNR.
For synovial fluid, the T1 relaxation time is long enough that increasing TR causes a substantial enough increase in fluid signal that SNR and CNR are increased despite higher parallel imaging acceleration factor and lower NEX. Therefore fluid SNR and fluid-cartilage CNR can be maximized with long TR in addition to low receiver bandwidth. The relationship between SNR and CNR to ETL is similar inasmuch that, while reducing ETL causes a small rise in cartilage SNR and cartilage-fluid CNR, it also requires higher acceleration and lower NEX for total scan time preservation.
The effects of TR and ETL on the subjective measures of blurring and artifact severity are less obvious. There was a clear overall trend of consistent improvement in blurring seen with low TR, short ETL, and increased bandwidth. However, overall suboptimal reader agreement and inconsistent trends in subjective quality scores between the two readers suggest several possible phenomena. One is that subjective changes in quality over the tested range of parameter settings are too subtle to be reproducibly detected by our readers at the desired subjective quality intervals. Reexamining the data using larger bins for subjective scores (e.g. worse, unchanged, improved) could improve reader agreement with the potential caveat of limiting the accuracy of the cumulative multivariate analysis. Additionally, the scan time constraint in our study introduced an interdependent relationship between acquisition parameters. None of the parameters could vary independently, with the exception of receiver bandwidth, to maintain constant scan time. This complex interaction of changes in numerous acquisition parameters, each with their own effects on image quality, may have further obscured the influences of each parameter setting individually. Finally, our readers may have different internal criteria for image quality that were not adequately controlled for in their subjective evaluations. As one of the readers was a medical student at the time of subjective scoring, the difference in clinical experience between the two readers may also account for part of the inter-reader variability.
Other limitations of this study include the small number of subjects scanned using our experimental parameter settings. This was due to the difficulty of obtaining volunteers for studies requiring over two hours of time in the scanner for at least twenty 5-minute 3D-FSE-Cube scans with additional prescans and noise-only acquisitions. The long protocol duration also necessitated different protocols for different subjects, so that not all the subjects received the same scans. Another limitation is the lack of subjects with knee joint pathology. It is unknown to what extent the optimization of acquisition parameters and subsequent improvement in image quality influences the detection of joint abnormalities such as meniscal tears, which may be impacted by blurring. It was not feasible to perform this study on subjects with internal derangements because of scan time considerations. Because each experimentally varied parameter factorially increases the required number of scans per subject, this approach was logistically impossible. Finally, as this study was performed using a 3 T system, it is unknown to what extent the findings apply to 3D-FSE-Cube imaging on a 1.5 T scanner.
In conclusion, this work describes the first systematic optimization of acquisition parameters for 3D-FSE-Cube. Image quality was found to be optimal using a low receiver bandwidth, despite the unwanted effect of increased blurring, while effects of TR, ETL and bandwidth on blurring and noise were consistent with theoretical expectations. We also employed a custom image reconstruction pipeline for accurate quantification of image noise for SNR evaluation in parallel imaging-accelerated, multi-channel root sum-of-square-reconstructed images. Validation of optimally applied parameter settings for 3D-FSE-Cube further supports its diagnostic utility for clinical knee evaluations, and our approach to subjective and objective parameter optimization can be applied to further refine this and other high-resolution isotropic sequences for other clinical applications as well.
Acknowledgments
Funding provided by:
RSNA Research Medical Student Grant
NIH Grant Nos. R01 EB002524, R01 EB005790 and K24 AR062068
GE Healthcare
The authors acknowledge Anja C. Brau, PhD for her assistance with recreating the 3D-FSE-Cube image reconstruction pipeline.
References
- 1.Resnick DL, Kang HS, Pretterklieber ML. Internal Derangements of Joints. 2. Philadelphia, PA: Saunders/Elsevier; 2006. Knee. [Google Scholar]
- 2.Trattnig S, Domayer S, Welsch GW, Mosher T, Eckstein F. MR imaging of cartilage and its repair in the knee--a review. Eur Radiol. 2009;19:1582–1594. doi: 10.1007/s00330-009-1352-3. [DOI] [PubMed] [Google Scholar]
- 3.Rubenstein JD, Li JG, Majumdar S, Henkelman RM. Image resolution and signal-to-noise ratio requirements for MR imaging of degenerative cartilage. AJR Am J Roentgenol. 1997;169:1089–1096. doi: 10.2214/ajr.169.4.9308470. [DOI] [PubMed] [Google Scholar]
- 4.Gold GE, Han E, Stainsby J, Wright G, Brittain J, Beaulieu C. Musculoskeletal MRI at 3. 0 T: relaxation times and image contrast. AJR Am J Roentgenol. 2004;183:343–351. doi: 10.2214/ajr.183.2.1830343. [DOI] [PubMed] [Google Scholar]
- 5.Mosher TJ. MRI of osteochondral injuries of the knee and ankle in the athlete. Clin Sports Med. 2006;25:843–866. doi: 10.1016/j.csm.2006.06.005. [DOI] [PubMed] [Google Scholar]
- 6.Ramnath RR. 3T MR imaging of the musculoskeletal system (Part II): clinical applications. Magn Reson Imaging Clin N Am. 2006;14:41–62. doi: 10.1016/j.mric.2006.01.003. [DOI] [PubMed] [Google Scholar]
- 7.Escobedo EM, Hunter JC, Zink-Brody GC, Wilson AJ, Harrison SD, Fisher DJ. Usefulness of turbo spin-echo MR imaging in the evaluation of meniscal tears: comparison with a conventional spin-echo sequence. AJR Am J Roentgenol. 1996;167:1223–1227. doi: 10.2214/ajr.167.5.8911185. [DOI] [PubMed] [Google Scholar]
- 8.Bredella MA, Tirman PF, Peterfy CG, et al. Accuracy of T2-weighted fast spin-echo MR imaging with fat saturation in detecting cartilage defects in the knee: comparison with arthroscopy in 130 patients. AJR Am J Roentgenol. 1999;172:1073–1080. doi: 10.2214/ajr.172.4.10587150. [DOI] [PubMed] [Google Scholar]
- 9.Sonin AH, Pensy RA, Mulligan ME, Hatem S. Grading articular cartilage of the knee using fast spin-echo proton density-weighted MR imaging without fat suppression. AJR Am J Roentgenol. 2002;179:1159–1166. doi: 10.2214/ajr.179.5.1791159. [DOI] [PubMed] [Google Scholar]
- 10.Jee WH, McCauley TR, Kim JM, et al. Meniscal tear configurations: categorization with MR imaging. AJR Am J Roentgenol. 2003;180:93–97. doi: 10.2214/ajr.180.1.1800093. [DOI] [PubMed] [Google Scholar]
- 11.Schaefer FK, Schaefer PJ, Brossmann J, et al. Value of fat-suppressed PD-weighted TSE-sequences for detection of anterior and posterior cruciate ligament lesions--comparison to arthroscopy. Eur J Radiol. 2006;58:411–415. doi: 10.1016/j.ejrad.2005.12.034. [DOI] [PubMed] [Google Scholar]
- 12.Wolff SD, Chesnick S, Frank JA, Lim KO, Balaban RS. Magnetization transfer contrast: MR imaging of the knee. Radiology. 1991;179:623–628. doi: 10.1148/radiology.179.3.2027963. [DOI] [PubMed] [Google Scholar]
- 13.Yao L, Gentili A, Thomas A. Incidental magnetization transfer contrast in fast spin-echo imaging of cartilage. J Magn Reson Imaging. 1996;6:180–184. doi: 10.1002/jmri.1880060132. [DOI] [PubMed] [Google Scholar]
- 14.Murakami JW, Weinberger E, Tsuruda JS, Mitchell JD, Yuan C. Multislab three-dimensional T2-weighted fast spin-echo imaging of the hippocampus: sequence optimization. J Magn Reson Imaging. 1995;5:309–315. doi: 10.1002/jmri.1880050315. [DOI] [PubMed] [Google Scholar]
- 15.Naganawa S, Yamakawa K, Fukatsu H, et al. High-resolution T2-weighted MR imaging of the inner ear using a long echo-train-length 3D fast spin-echo sequence. Eur Radiol. 1996;6:369–374. doi: 10.1007/BF00180615. [DOI] [PubMed] [Google Scholar]
- 16.Mugler JP, 3rd, Bao S, Mulkern RV, et al. Optimized single-slab three-dimensional spin-echo MR imaging of the brain. Radiology. 2000;216:891–899. doi: 10.1148/radiology.216.3.r00au46891. [DOI] [PubMed] [Google Scholar]
- 17.Lichy MP, Wietek BM, Mugler JP, 3rd, et al. Magnetic resonance imaging of the body trunk using a single-slab, 3-dimensional, T2-weighted turbo-spin-echo sequence with high sampling efficiency (SPACE) for high spatial resolution imaging: initial clinical experiences. Invest Radiol. 2005;40:754–760. doi: 10.1097/01.rli.0000185880.92346.9e. [DOI] [PubMed] [Google Scholar]
- 18.Busse RF, Brau AC, Beatty PJ, et al. Design of Refocusing Flip Angle Modulation for Volumetric 3D-FSE Imaging of Brain, Spine, Knee, Kidney and Uterus. 15th Meeting of the ISMRM. Berlin, Germany: International Society for Magnetic Resonance in Medicine; 2007. p. 1702. [Google Scholar]
- 19.Busse RF, Hariharan H, Vu A, Brittain JH. Fast spin echo sequences with very long echo trains: design of variable refocusing flip angle schedules and generation of clinical T2 contrast. Magn Reson Med. 2006;55:1030–1037. doi: 10.1002/mrm.20863. [DOI] [PubMed] [Google Scholar]
- 20.Park J, Mugler JP, 3rd, Horger W, Kiefer B. Optimized T1-weighted contrast for single-slab 3D turbo spin-echo imaging with long echo trains: application to whole-brain imaging. Magn Reson Med. 2007;58:982–992. doi: 10.1002/mrm.21386. [DOI] [PubMed] [Google Scholar]
- 21.Noll DC, Nishimura DG, Macovski A. Homodyne detection in magnetic resonance imaging. IEEE Trans Med Imaging. 1991;10:154–163. doi: 10.1109/42.79473. [DOI] [PubMed] [Google Scholar]
- 22.Beatty PJ, Brau AC, Chang S, et al. A method for autocalibrating 2D-accelerated volumetric parallel imaging with clinically practical reconstruction times. 15th Meeting of the ISMRM; Berlin, Germany: International Society for Magnetic Resonance in Medicine; 2007. p. 1749. [Google Scholar]
- 23.Busse RF, Brau AC, Vu A, et al. Effects of refocusing flip angle modulation and view ordering in 3D fast spin echo. Magn Reson Med. 2008;60:640–649. doi: 10.1002/mrm.21680. [DOI] [PMC free article] [PubMed] [Google Scholar]
- 24.Gold GE, Busse RF, Beehler C, et al. Isotropic MRI of the knee with 3D fast spin-echo extended echo-train acquisition (XETA): initial experience. AJR Am J Roentgenol. 2007;188:1287–1293. doi: 10.2214/AJR.06.1208. [DOI] [PubMed] [Google Scholar]
- 25.Stevens KJ, Busse RF, Han E, et al. Ankle: isotropic MR imaging with 3D-FSE-cube--initial experience in healthy volunteers. Radiology. 2008;249:1026–1033. doi: 10.1148/radiol.2493080227. [DOI] [PMC free article] [PubMed] [Google Scholar]
- 26.Ristow O, Steinbach L, Sabo G, et al. Isotropic 3D fast spin-echo imaging versus standard 2D imaging at 3. 0 T of the knee--image quality and diagnostic performance. Eur Radiol. 2009;19:1263–1272. doi: 10.1007/s00330-008-1260-y. [DOI] [PubMed] [Google Scholar]
- 27.Kijowski R, Davis KW, Blankenbaker DG, Woods MA, Del Rio AM, De Smet AA. Evaluation of the menisci of the knee joint using three-dimensional isotropic resolution fast spin-echo imaging: diagnostic performance in 250 patients with surgical correlation. Skeletal radiology. 2012;41:169–178. doi: 10.1007/s00256-011-1140-4. [DOI] [PubMed] [Google Scholar]
- 28.Chen CA, Kijowski R, Hargreaves BA, et al. 3D-FSE-Cube for Rapid Assessment of Cartilage Morphology in the Knee. 16th Meeting of the ISMRM; Toronto, Canada: International Society for Magnetic Resonance in Medicine; 2008. p. 2563. [Google Scholar]
- 29.Kijowski R, Davis KW, Woods MA, et al. Knee joint: comprehensive assessment with 3D isotropic resolution fast spin-echo MR imaging--diagnostic performance compared with that of conventional MR imaging at 3. 0 T. Radiology. 2009;252:486–495. doi: 10.1148/radiol.2523090028. [DOI] [PMC free article] [PubMed] [Google Scholar]
- 30.National Electrical Manufacturers Association (NEMA), editor NEMA Standards Publication MS 1-2008. Rosslyn, VA: National Electrical Manufacturers Association; 2008. Determination of Signal-to-Noise Ratio (SNR) in Diagnostic Magnetic Resonance Imaging; p. 19. [Google Scholar]
- 31.Li CQ, Chen W, Beatty PJ, et al. SNR Quantification with Phased-Array Coils and Parallel Imaging for 3D-FSE. 18th Meeting of the ISMRM; Stockholm, Sweden: International Society for Magnetic Resonance in Medicine; 2010. p. 552. [Google Scholar]
- 32.Chen CA, Kijowski R, Shapiro LM, et al. Cartilage morphology at 3. 0T: assessment of three-dimensional magnetic resonance imaging techniques Journal of magnetic resonance imaging. JMRI. 2010;32:173–183. doi: 10.1002/jmri.22213. [DOI] [PMC free article] [PubMed] [Google Scholar]
- 33.Notohamiprodjo M, Horng A, Pietschmann MF, et al. MRI of the knee at 3T: first clinical results with an isotropic PDfs-weighted 3D-TSE-sequence. Invest Radiol. 2009;44:585–597. doi: 10.1097/RLI.0b013e3181b4c1a1. [DOI] [PubMed] [Google Scholar]
- 34.Seo JM, Yoon YC, Kwon JW. 3D isotropic turbo spin-echo intermediate-weighted sequence with refocusing control in knee imaging: comparison study with 3D isotropic fast-field echo sequence. Acta Radiol. 2011;52:1119–1124. doi: 10.1258/ar.2011.110328. [DOI] [PubMed] [Google Scholar]
- 35.Van Dyck P, Gielen JL, Vanhoenacker FM, et al. Diagnostic performance of 3D SPACE for comprehensive knee joint assessment at 3 T. Insights into imaging. 2012;3:603–610. doi: 10.1007/s13244-012-0197-5. [DOI] [PMC free article] [PubMed] [Google Scholar]
- 36.Constantinides CD, Atalar E, McVeigh ER. Signal-to-noise measurements in magnitude images from NMR phased arrays. Magn Reson Med. 1997;38:852–857. doi: 10.1002/mrm.1910380524. [DOI] [PMC free article] [PubMed] [Google Scholar]
- 37.Dietrich O, Raya JG, Reeder SB, Ingrisch M, Reiser MF, Schoenberg SO. Influence of multichannel combination, parallel imaging and other reconstruction techniques on MRI noise characteristics. Magnetic Resonance Imaging. 2008;26:754–762. doi: 10.1016/j.mri.2008.02.001. [DOI] [PubMed] [Google Scholar]
- 38.Breuer FA, Blaimer M, Seiberlich N, Jakob PM, Griswold MA. A general formulation for quantitative g-factor calculation in GRAPPA reconstructions. 16th Meeting of the ISMRM; Toronto, Canada: International Society for Magnetic Resonance in Medicine; 2008. p. 10. [DOI] [PubMed] [Google Scholar]
- 39.Murphy BW, Carson PL, Ellis JH, Zhang YT, Hyde RJ, Chenevert TL. Signal-to-noise measures for magnetic resonance imagers. Magn Reson Imaging. 1993;11:425–428. doi: 10.1016/0730-725x(93)90076-p. [DOI] [PubMed] [Google Scholar]
- 40.Sijbers J, den Dekker AJ, Van Audekerke J, Verhoye M, Van Dyck D. Estimation of the noise in magnitude MR images. Magn Reson Imaging. 1998;16:87–90. doi: 10.1016/s0730-725x(97)00199-9. [DOI] [PubMed] [Google Scholar]
- 41.Kellman P, McVeigh ER. Image reconstruction in SNR units: a general method for SNR measurement. Magn Reson Med. 2005;54:1439–1447. doi: 10.1002/mrm.20713. [DOI] [PMC free article] [PubMed] [Google Scholar]
- 42.Robson PM, Grant AK, Madhuranthakam AJ, Lattanzi R, Sodickson DK, McKenzie CA. Comprehensive quantification of signal-to-noise ratio and g-factor for image-based and k-space-based parallel imaging reconstructions. Magnetic Resonance in Medicine. 2008;60:895–907. doi: 10.1002/mrm.21728. [DOI] [PMC free article] [PubMed] [Google Scholar]