

Abstract
Background
Chronic kidney disease is associated with an increased risk for cardiovascular disease and mortality. Both traditional and non-traditional cardiovascular disease risk factors may contribute.
Study Design
Cohort
Settings & Participants
Community-based adult population of the Atherosclerosis Risk in Communities and Cardiovascular Health Studies with estimated glomerular filtration rate (eGFR) <60 mL/min/1.73m2
Predictors
Non-traditional cardiovascular disease risk factors including body mass index, diastolic blood pressure, triglycerides, albumin, uric acid, fibrinogen, c-reactive protein, and hemoglobin
Outcomes
Composite of myocardial infarction, stroke and all-cause mortality. Secondary outcomes included individual components of the composite.
Results
Among 1,678 individuals with reduced eGFR (mean 51.1±8.5 mL/min/1.73m2), 891 (53%) reached the composite endpoint during median follow-up of 108 months; 23% had a cardiac event, 45% died and 14% experienced a stroke. Serum albumin levels below 3.9 g/dL [Hazard Ratio (HR)=0.68 (95% confidence interval 0.60,0.77) for every 0.3 g/dL decrease], elevated serum triglycerides [HR=1.07 (1.02,1.12) for every 50 mg/dL increase], C-reactive protein [HR=1.15 (1.07,1.24) per log-unit increase], and fibrinogen [HR=1.12 (1.07,1.18) per 50 mg/dL increase] independently predicted composite events. Both reduced (<14.5 g/dL) and elevated (>14.5 g/dL) hemoglobin level predicted composite events. Serum albumin levels below 3.9 g/dL and elevated serum fibrinogen independently predicted cardiac events. For serum albumin and hemoglobin, the relationship with composite and mortality outcomes was non-linear (p<0.001).
Limitations
Single assessment of eGFR. No albuminuria data.
Conclusions
Several non-traditional cardiovascular disease risk factors predict adverse outcomes in individuals with stage 3-4 chronic kidney disease. The relationship between risk factors and outcomes is often non-linear.
Index Words: Chronic kidney disease, cardiovascular disease, risk factors, inflammation, cholesterol
Introduction
Recent studies have shown that the presence of impaired kidney function is an independent risk state for both incident and recurrent cardiovascular disease (CVD) and mortality events.1-4 Most of these studies have adjusted for traditional CVD risk factors identified in the Framingham Heart Study, including age, sex, diabetes mellitus, hypertension and blood pressure values, smoking and lipids. Many non-traditional risk factors increase in prevalence as kidney function declines and are hypothesized to be stronger cardiovascular disease risk factors in individuals with chronic kidney disease (CKD).5 At this time, it is unknown whether CKD itself predisposes to adverse outcomes, whether CKD identifies individuals with more severe, long-standing or poorly controlled traditional risk factors such as hypertension and diabetes, or whether the association between CKD and non-traditional risk factors promotes an increased risk of adverse outcomes.6
In individuals with CKD, there are few studies that evaluate the nature of the relationships between non-traditional risk factors, including reduced hemoglobin level, hypoalbuminemia and elevated fibrinogen levels, with cardiac, stroke, and mortality outcomes.7,8 Using data from a pooled dataset of community-based longitudinal studies, we evaluated the relative import of non-traditional risk factors on CVD, stroke and mortality outcomes after adjustment for traditional risk factors. Furthermore, we specifically focused on modeling the shape of the relationship between these potential non-traditional risk factors and outcomes.
Methods
Study Design
This study is a secondary evaluation of two community-based, longitudinal, public-use datasets designed to evaluate CVD: the Atherosclerosis Risk in Communities Study (ARIC) and the Cardiovascular Health Study (CHS).
Study population
Between 1987 and 1989, ARIC enrolled 15,792 participants aged 45-64 years from four communities: Jackson, Mississippi; Forsyth County, North Carolina; the northwestern suburbs of Minneapolis, Minnesota; and Washington County, Maryland. The Mississippi cohort is entirely African-American and comprises over 80% of the African-Americans in ARIC. CHS is a population-based study of 5,201 subjects 65 years and older randomly selected from Medicare eligibility files during 1989 and 1990 also from four communities: Sacramento County, California; Washington County, Maryland; Forsyth County, North Carolina; and Pittsburgh, Pennsylvania. An additional 687 African-Americans were recruited in 1992 and 1993.9,10
Ascertainment of Level of Kidney Function
In the ARIC study, baseline serum creatinine levels were assessed in 15,582 (99%) subjects; serum creatinine in CHS was measured in 5,716 (97%) subjects. Kidney function was quantified using estimated glomerular filtration rate (eGFR) derived from the 4-variable Modification of Diet in Renal Disease (MDRD) Study equation.11,12 Serum creatinine assays in the MDRD Study were performed at the Cleveland Clinic Foundation. Because serum creatinine assays vary across laboratories, use of the MDRD Study equation in these analyses requires calibration of the serum creatinine assays to this lab; therefore, we calibrated the ARIC and CHS laboratories indirectly using NHANES III data.3,13,14 We defined CKD as eGFR below 60 ml/min/1.73m2 (1 ml/sec/1.73m2) based on Kidney Disease Outcomes and Quality Initiative guidelines.15 Subjects with stage 5 CKD (kidney failure, eGFR below 15 ml/min/1.73m2 (0.25 ml/sec/1.73m2)) were excluded from this study.
Baseline Variables
Baseline variables included demographics (age, sex, race); medical history (baseline CVD, diabetes mellitus, smoking); physical findings (systolic blood pressure, left ventricular hypertrophy); and laboratory variables (total cholesterol, high density lipoprotein (HDL) cholesterol, eGFR). Because CKD has previously been demonstrated to be an independent risk state for cardiac and mortality outcomes and we are focusing specifically on a population with CKD, eGFR was included in models.16 Non-traditional risk factors studied include other physical examination findings (body mass index (BMI), diastolic blood pressure); and laboratory variables (serum triglycerides, albumin, uric acid, hemoglobin, C-reactive protein, fibrinogen). C-reactive protein (CRP) was available only in CHS. The methods employed for collection of baseline data by each of these studies have been previously described.9,10
Race was defined as white or African American. Education level was dichotomized according to whether the subject graduated from high school. Cigarette smoking and alcohol use were dichotomized as current users and non-users. Diabetes was defined as either the use of insulin, oral hypoglycemic medications, or a fasting glucose level ≥126 mg/dL (7 mmol/L). Hypertension was defined as systolic blood pressure ≥140 mm Hg, diastolic ≥90 mm Hg or use of an antihypertensive medication. BMI was calculated using the formula: weight [kg]/height2 [m]. Although both ARIC and CHS used the bromocresol green method to assess serum albumin, there appeared to be a discrepancy in serum albumin results by study. These may relate to different processing times, non-specific interference from binding to non-albumin proteins, and laboratory calibration differences.17,18 Therefore, in the same manner as for serum creatinine, we indirectly calibrated both ARIC and CHS serum albumin levels to NHANES values using a regression equation that also accounted for age and sex. This resulted in 0.23 g/dL (2.3 g/L) being added to ARIC values, 0.03 g/dL (0.3 g/L) added to values in the CHS original cohort, and no change to values in the CHS African American cohort.4 Left ventricular hypertrophy was defined using resting 12-lead electrocardiogram in all studies. To be classified as having LVH, subjects needed to meet voltage criteria and have characteristic S-T segment or T wave changes. Baseline CVD included a history of both recognized and silent myocardial infarction (MI), angina, angioplasty and coronary bypass procedures, stroke, transient ischemic attack and intermittent claudication as defined by consensus committees for the respective studies. In addition, baseline CVD included a history of congestive heart failure in CHS (not coded in ARIC). The methods employed for definitions of CVD outcomes by each of these studies have been extensively described elsewhere.9,10
Study Sample
From an initial sample of 21,680, we excluded 402 subjects who had data missing on age, race, sex, creatinine or were of non-white/non-African American race; 32 subjects with eGFR <15 ml/min/1.73m2; and 17 subjects without follow-up data. Among the remaining 21,229 individuals, 1,678 subjects had CKD.
Study Outcomes
The primary study outcome was a composite of MI, stroke and all-cause mortality. MI was defined by both clinically recognized and silent infarctions, with ascertainment of silent MI by screening electrocardiogram. Secondary outcomes were cardiac events (fatal coronary heart disease and MI), stroke, and all-cause mortality.
Analysis and Statistical Methods
The goal of our analysis was to determine the relationship between non-traditional risk factors and adverse outcomes in individuals with CKD. Risk factors were described using plots, means and percentages. Univariate associations between non-traditional risk factors and time to study outcomes were tested using the Kaplan Meier method. These risk factors included BMI, diastolic blood pressure, triglycerides, albumin, uric acid, fibrinogen, CRP (CHS only), and hemoglobin. Where appropriate, continuous variables were log transformed and multi-slope models were built.
Non-traditional risk factors were then individually added to a baseline multivariable model. The baseline model a priori included known traditional cardiovascular risk factors from the Framingham equations (age, sex, diabetes, smoking, LVH, systolic blood pressure, and total and HDL cholesterol) as well as history of prior CVD, race, baseline GFR, and a term for study of origin (ARIC versus CHS). Each non-traditional risk factor listed above was added to this baseline model without inclusion of other non-traditional risk factors. Because of variable findings in the past on the relationship of diastolic blood pressure with outcomes, it was not included as a traditional risk factors but rather was studied among the non-traditional risk factors.19,20 The shape of the relationship between each non-traditional risk factor and outcomes was analyzed in separate multivariable models using restricted cubic splines with 4 knots generated using S-Plus. Accordingly, risk factors remained linear, were transformed or were analyzed in multiple-slope models as dictated by graphical results. For all risk factors, the Wald chi-square test was used to test overall significance (3 degrees of freedom). Linearity was tested in S-Plus with the Wald chi-square test (2 degrees of freedom), where a p-value <0.05 is consistent with non-linearity. For non-linear models, cut-points that yielded the model with the lowest -2 log likelihood were used; candidate cut-points were based upon visual inspection of graphical results.
All other analyses were conducted with SAS Version 9.1.
Results
Clinical characteristics of the 1,678 individuals with CKD are presented in Table 1. Mean eGFR was 51.1 ± 8.5 ml/min/1.73m2 (0.85 mL/sec/1.73m2). ARIC was the source of 26% of the study population while the other 74% were derived from CHS. Median follow-up was 108 (interquartile range: 53) months. There were 891 individuals (53.1%) who reached the composite endpoint; 378 (22.5%) had a cardiac event, 748 (44.6%) died and 233 (13.9%) experienced a stroke.
Table 1.
Baseline descriptive data of the pooled cohort with eGFR between 15 and 60 mL/min/1.73m2.
| Characteristic | % (n), or Mean ± SD (n) | Median (Range) |
|---|---|---|
| Demographics | ||
| Age | 70 ± 10 (1678) | 72 (45-91) |
| Female | 56% (1678) | - |
| African American | 14% (1678) | - |
| Study origin: ARIC | 26% (1678) | - |
| HS Graduate | 69% (1673) | - |
| Current Smoking | 13% (1678) | - |
| Current Alcohol | 47% (1669) | - |
| Medical History | ||
| CVD | 34% (1665) | - |
| Diabetes | 15% (1678) | - |
| Hypertension | 74% (1677) | - |
| Medication Usage | ||
| Antihypertensive | 62% (1042/1678) | - |
| Antihyperglycemic | 11% (185/1678) | - |
| Lipid-Lowering | 6% (100/1678) | - |
| Exam Findings | ||
| BMI (kg/m2) | 27 ± 5 (1675) | 27 (17-53) |
| SBP (mm Hg) | 135 ± 24 (1675) | 132 (74-228) |
| DBP (mm Hg) | 72 ± 12 (1674) | 72 (24-136) |
| LVH | 6% (1616) | - |
| Laboratory Results | ||
| Total Cholesterol | 215 ± 44 (1675) | 212 (86-465) |
| HDL Cholesterol | 51 ± 16 (1672) | 48 (15-132) |
| LDL Cholesterol | 133 ± 40 (1635) | 130 (14-387) |
| Triglycerides | 153 ± 88 (1675) | 130 (24-954) |
| Hemoglobin | 13.8 ± 1.6 (1668) | 13.8 (7.0-25.4) |
| Uric Acid | 6.8 ± 1.8 (1678) | 6.7 (1.7-15.9) |
| Albumin | 4.0 ± 0.3 (1678) | 4.0 (2.0-5.2) |
| Fibrinogen | 334 ± 72 (1672) | 328 (132-854) |
| Creatinine | 1.3 ± 0.4 (1678) | 1.3 (1.0-4.8) |
| eGFR | 51 ± 9 (1678) | 53 (16-60) |
HS, High school; CVD, cardiovascular disease; BMI, body mass index; SBP, systolic blood pressure; DBP, diastolic blood pressure; LVH, left ventricular hypertrophy by electrocardiogram criteria; eGFR, estimated glomerular filtration rate (mL/min/1.73m2); cholesterol values, uric acid, fibrinogen and serum creatinine are in mg/dL. Serum albumin and hemoglobin are in g/dL.
To convert cholesterol values in mg/dL to mmol/L, multiply by 0.02586; triglycerides in mg/dL to mmol/L, multiply by 0.01129; hemoglobin in g/dL to g/L, multiply by 10; uric acid in mg/dL to μmol/L, multiply by 59.48; albumin in g/dL to g/L, multiply by 10; fibrinogen in mg/dL to μmol/L, multiply by 0.0294; creatinine in mg/dL to mol/L, multiply by 88.4; and eGFR in mL/min to mL/s, multiply by 0.01667.
Traditional Risk Factors
In multivariable models, traditional risk factors generally predicted adverse outcomes in individuals with CKD. Increasing age, male sex, African American race, prior CVD, diabetes, LVH, smoking, elevated systolic blood pressure and reduced GFR were all independently associated with composite events. Increased total cholesterol and decreased HDL cholesterol were not independent risk factors for any of the study outcomes (Table 2).
Table 2.
Multivariable analysis of the hazard associated with traditional risk factors and kidney function for study outcomes. Data are displayed as hazard ratio (95% confidence interval).
| Cardiac | Stroke | Mortality | Composite | |
|---|---|---|---|---|
| Demographics | ||||
| Age | 1.68 (1.39, 2.02) | 1.49 (1.18, 1.89) | 2.20 (1.93, 2.51) | 1.84 (1.63, 2.08) |
| Female | 0.49 (0.38, 0.63) | 0.67 (0.49, 0.92) | 0.57 (0.48, 0.67) | 0.57 (0.49, 0.67) |
| African American Race | 1.26 (0.93, 1.72) | 0.95 (0.62, 1.43) | 1.20 (0.96, 1.51) | 1.25 (1.02, 1.53) |
| Study: ARIC | 1.62 (1.07, 2.47) | 0.98 (0.56, 1.73) | 1.83 (1.33, 2.52) | 1.41 (1.07, 1.87) |
| Medical History | ||||
| Cardiovascular Disease | 2.32 (1.86, 2.89) | 1.85 (1.40, 2.45) | 1.60 (1.37, 1.87) | 1.74 (1.51, 2.01) |
| Diabetes | 1.86 (1.44, 2.40) | 1.89 (1.34, 2.66) | 2.02 (1.67, 2.44) | 1.73 (1.45, 2.07) |
| Current Smoking | 1.30 (0.94, 1.79) | 1.30 (0.85, 1.97) | 1.67 (1.34, 2.09) | 1.63 (1.33, 1.99) |
| Exam and Laboratory | ||||
| Systolic Blood Pressure | 1.13 (1.03, 1.23) | 1.30 (1.16, 1.45) | 1.09 (1.02, 1.16) | 1.11 (1.05, 1.18) |
| LVH | 1.57 (1.11, 2.23) | 1.72 (1.13, 2.63) | 1.70 (1.32, 2.18) | 1.45 (1.15, 1.85) |
| Total Cholesterol | 1.03 (0.98, 1.08) | 1.03 (0.97, 1.10) | 0.99 (0.95, 1.03) | 1.02 (0.98, 1.05) |
| HDL Cholesterol | 0.98 (0.90, 1.07) | 1.04 (0.94, 1.15) | 1.05 (0.99, 1.11) | 1.03 (0.97, 1.08) |
| GFR | 0.91 (0.86, 0.97) | 0.90 (0.84, 0.97) | 0.86 (0.83, 0.90) | 0.87 (0.84, 0.91) |
Age is assessed per 10-year increase; systolic blood pressure per 20 mm Hg increase; total cholesterol per 20 mg/dL (0.52 mmol/L) increase; high density lipoprotein (HDL) cholesterol per 10 mg/dL (0.26 mmol/L) increase; and glomerular filtration rate (GFR) per 5 mL/min/1.732 (0.08 mL/sec/1.73m2) increase. LVH, left ventricular hypertrophy diagnosed by electrocardiogram characteristics.
Non-Traditional Risk Factors
Table 3 presents results of univariate models examining non-traditional risk factors. Table 4 presents hazards associated with non-traditional risk factors from multivariable models that adjust for accepted traditional risk factors. Increased serum albumin was highly protective versus all outcomes in univariate and multivariable analyses. When examined graphically, it was notable that the risk attributable to albumin was only present at levels below 3.9 g/dL (39 g/L) (Figure 1). In a 2-slope model, there was no effect as albumin increased above 3.9g/dL (39 g/L); however for every 0.3 g/dL (3 g/L) decrease below 3.9 g/dL (39 g/L) in multivariable models, there was a 31% decreased risk of cardiac outcomes, 28% decreased risk of stroke, 35% decreased risk of death and a 32% decreased risk of the composite outcome (p<0.001 for all outcomes except stroke where p<0.01). In a linear model, hazard ratios are between 0.83 and 0.88 (12-17% decreased risk) for every 0.3 g/dL (3 g/L) increase in serum albumin for the four study outcomes, illustrating the importance of correctly modeling the risk factor.
Table 3.
Univariate analyses of non-traditional risk factors.
| Model Details | Study Outcomes | |||||||
|---|---|---|---|---|---|---|---|---|
|
| ||||||||
| Cardiac | Stroke | Mortality | Composite | |||||
| Physical Exam | ||||||||
| Body mass index | ||||||||
| 5-kg/m2 increase | 0.95 (0.85, 1.06) | 0.4 | 0.83 (0.71, 0.96) | 0.01 | 0.84 (0.78, 0.92) | <0.001 | 0.88 (0.82, 0.95) | 0.001 |
| Diastolic blood pressure | ||||||||
| 10-mm Hg rise | 1.02 (0.94, 1.12) | 0.6 | 1.24 (1.12, 1.38) | <0.001 | 0.97 (0.91, 1.03) | 0.4 | 1.01 (0.95, 1.07) | 0.8 |
| Laboratory Tests | ||||||||
| Triglycerides | ||||||||
| 50-mg/dL increase | 1.05 (1.00, 1.11) | 0.05 | 1.05 (0.99, 1.13) | 0.1 | 1.03 (0.99, 1.07) | 0.2 | 1.05 (1.01, 1.08) | 0.01 |
| Hemoglobin | ||||||||
| 1.5-g/dL increase | 1.03 (0.92, 1.14) | 0.6 | 0.91 (0.80, 1.04) | 0.1 | 0.88 (0.82, 0.95) | 0.001 | 0.91 (0.85, 0.98) | 0.009 |
| Hemoglobin (2-slope model) | ||||||||
| 1.5 g/dL increase <14.5 g/dL | 0.89 (0.77, 1.03) | 0.1 | 0.81 (0.68, 0.97) | 0.02 | 0.70 (0.64, 0.77) | <0.001 | 0.74 (0.68, 0.82) | <0.001 |
| 1.5 g/dL increase >14.5 g/dL | 1.34 (1.08, 1.66) | 0.009 | 1.20 (0.88, 1.64) | 0.2 | 1.51 (1.30, 1.76) | <0.001 | 1.44 (1.24, 1.66) | <0.001 |
| Albumin | ||||||||
| 0.3-g/dL increase <3.9 g/dL | 0.71 (0.59, 0.84) | <0.001 | 0.73 (0.58, 0.91) | <0.01 | 0.64 (0.57, 0.72) | <0.001 | 0.67 (0.60, 0.75) | <0.001 |
| Uric Acid | ||||||||
| 2-mg/dL increase | 1.30 (1.17, 1.44) | <0.001 | 1.12 (0.97, 1.29) | 0.1 | 1.26 (1.17, 1.36) | <0.001 | 1.24 (1.16, 1.33) | <0.001 |
| Fibrinogen | ||||||||
| 50-mg/dL increase | 1.20 (1.12, 1.28) | <0.001 | 1.16 (1.07, 1.27) | <0.001 | 1.20 (1.14, 1.25) | <0.001 | 1.21 (1.15, 1.26) | <0.001 |
| C-Reactive protein | ||||||||
| Log-transformed; per 1-log-unit increase | 1.13 (1.01, 1.26) | 0.03 | 1.15 (1.01, 1.32) | 0.04 | 1.20 (1.11, 1.29) | <0.001 | 1.19 (1.11, 1.28) | <0.001 |
Data are displayed as hazard ratio (95% confidence interval), p-value.
BMI, body mass index; BP, blood pressure; CRP, c-reactive protein (only analyzed in CHS). The hazard ratio for albumin represents the effect of rising serum albumin at levels below 3.9 g/dL only as there was no relationship between albumin above 3.9 g/dL and outcomes.
To convert triglyceride values in mg/dL to mmol/L, multiply by 0.01129; hemoglobin in g/dL to g/L, multiply by 10; albumin in g/dL to g/L, multiply by 10; uric acid in mg/dL to μmol/L, multiply by 59.48; and fibrinogen in mg/dL to μmol/L, multiply by 0.0294.
Table 4.
Results of multivariable analyses of non-traditional risk factors.
| Study Outcomes | |||||
|---|---|---|---|---|---|
|
| |||||
| Cardiac | Stroke | Mortality | Composite | ||
| Physical Exam | |||||
| BMI | 5 kg/m2 increase | 1.05 [0.92, 1.20], 0.5 | 0.92 [0.77, 1.10], 0.4 | 0.98 [0.89, 1.08], 0.6 | 1.00 [0.92, 1.09], 1.0 |
| Diastolic BP | 10mm Hg rise | 0.95 [0.85, 1.06], 0.3 | 1.18 [1.02, 1.36], 0.03 | 0.97 [0.90, 1.05], 0.4 | 0.99 [0.92, 1.06], 0.8 |
| Laboratory Tests | |||||
| Triglycerides | 50mg/dL increase | 1.04 [0.97, 1.11], 0.3 | 1.08 [0.99, 1.17], 0.1 | 1.05 [1.00, 1.11], 0.1 | 1.07 [1.02, 1.12], 0.005 |
| Hemoglobin | 1.5 g/dL increase | 0.98 [0.87, 1.10], 0.7 | 0.85 [0.73, 1.00], 0.05 | 0.86 [0.79, 0.94], 0.001 | 0.89 [0.82, 0.96], 0.003 |
| Hemoglobin (2-slope model) | 1.5 g/dL increase below 14.5 g/dL | 0.94 [0.79, 1.11], 0.5 | 0.79 [0.64, 0.97], 0.03 | 0.70 [0.63, 0.79], <0.001 | 0.75 [0.67, 0.84], <0.001 |
| 1.5 g/dL increase above 14.5 g/dL | 1.05 [0.81, 1.35], 0.7 | 1.02 [0.71, 1.46], 0.9 | 1.31 [1.09, 1.56], 0.003 | 1.22 [1.03, 1.45], 0.02 | |
| Albumin | 0.3 g/dL increase below 3.9 g/dL | 0.69 [0.56, 0.85], <0.001 | 0.72 [0.56, 0.92], 0.009 | 0.65 [0.57, 0.75], <0.001 | 0.68 [0.60, 0.77], <0.001 |
| Uric Acid | 2 mg/dL increase | 1.06 [0.93, 1.20], 0.4 | 0.96 [0.81, 1.14], 0.6 | 1.08 [0.99, 1.19], 0.1 | 1.07 [0.99, 1.17], 0.1 |
| Fibrinogen | 50mg/dL increase | 1.10 [1.03, 1.19], 0.008 | 1.08 [0.97, 1.19], 0.2 | 1.09 [1.03, 1.15], 0.002 | 1.12 [1.07, 1.18], <0.001 |
| CRP | Log-transformed; per 1 log-unit rise | 1.03 [0.91, 1.15], 0.7 | 1.11 [0.96, 1.29], 0.2 | 1.13 [1.04, 1.22], 0.003 | 1.15 [1.07, 1.24], <0.001 |
All models were adjusted for age, sex, race, history of CVD, history of diabetes, LVH, smoking, total cholesterol, HDL cholesterol, systolic blood pressure, GFR and study of origin. Variables that were statistically significant are in bold type.
Each non-traditional risk factor is evaluated in models that only contain traditional risk factors and do not include other potential non-traditional risk factors, such that the results of 36 different models are presented in this table.
Data is displayed as hazard ratio (95% confidence interval), p-value.
BMI, body mass index; BP, blood pressure; CRP, c-reactive protein (only analyzed in CHS). The hazard ratio for albumin represents the effect of rising serum albumin at levels below 3.9 g/dL only as there was no relationship between albumin above 3.9 g/dL and outcomes.
To convert triglyceride values in mg/dL to mmol/L, multiply by 0.01129; hemoglobin in g/dL to g/L, multiply by 10; albumin in g/dL to g/L, multiply by 10; uric acid in mg/dL to μmol/L, multiply by 59.48; and fibrinogen in mg/dL to μmol/L, multiply by 0.0294.
Figure 1.

The relationship between serum albumin and study outcomes in fully adjusted models. All models are adjusted for age, sex, race, study, prior cardiovascular disease, diabetes, smoking, systolic blood pressure, LVH and eGFR. Plots are generated using restricted cubic splines with 4 knots generated in S-Plus. Hatch marks represent the relative proportion of individuals at a given albumin level. Overall effect indicates whether albumin is a statistically significant risk factor for the outcome, while the linearity test indicates if the relationship between albumin and the outcome is linear; for composite and mortality outcomes (p<0.001), the relationship is non-linear, while there is a trend toward non-linearity for the cardiac outcome.
In univariate analysis, higher BMI was protective against development of stroke, mortality and composite outcomes; however in multivariable analyses, there was no significant association between BMI and adverse outcomes and no evidence of a non-linear relationship in graphical review. Diastolic blood pressure had a non-linear relationship with all outcomes in univariate analysis (testing for linearity, p=0.02, 0.06, 0.01, and <0.01 for cardiac, stroke, mortality and composite outcomes, respectively). Graphically, this appeared to be a “U”-shaped relationship with outcomes, although, in multivariable models using both multi-slope and quadratic terms, the relationship between diastolic blood pressure and outcomes was no longer significant. Hypertriglyceridemia was associated with increased risk of composite and cardiac outcomes in univariate analysis and remained a statistically significant independent risk factor for only the composite outcome in multivariable analysis (HR=1.07 [95% CI: 1.02,1.12] for every 50 mg/dL (0.56 mmol/L) rise). Graphical analysis was consistent with a linear relationship.
In univariate analysis, higher hemoglobin level was protective for composite and mortality events and remained protective in multivariable analyses. These relationships were non-linear, as risk of composite and mortality events also increased linearly above hemoglobin of >14.5 g/dL (145 g/L) (Figure 2). Serum fibrinogen was a significant risk factor in univariate and multivariable analyses and was linear for all outcomes. Log-transformed CRP (in CHS only) was a statistically significant risk factor for composite and mortality outcomes only and also was linear. In multivariable analyses, there was a trend toward increased composite and mortality outcomes with increased uric acid. This relationship also was linear.
Figure 2.
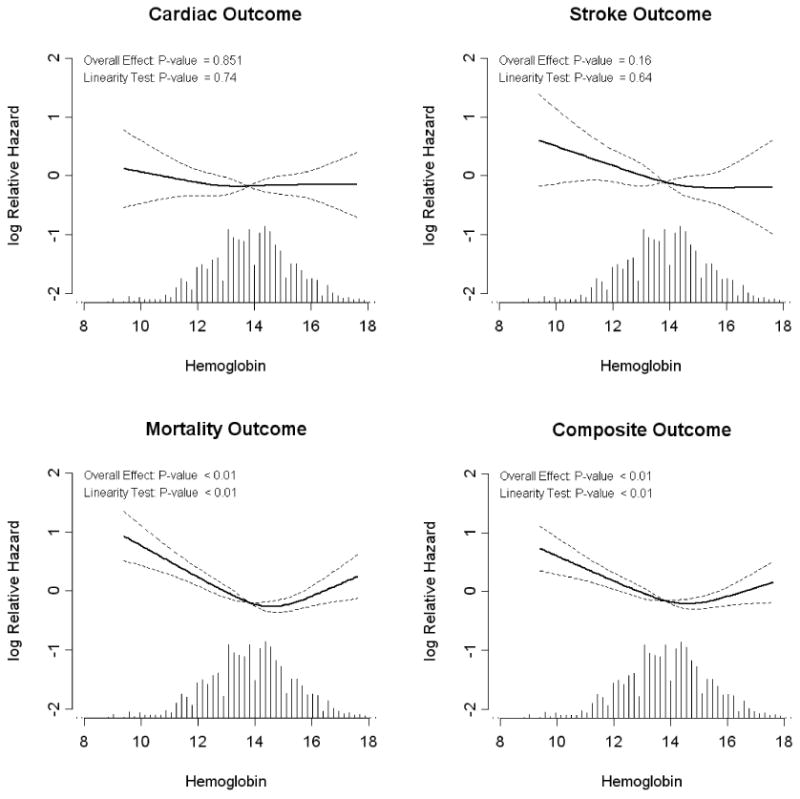
The relationship between hemoglobin and study outcomes in fully adjusted models. All models are adjusted for age, sex, race, study, prior cardiovascular disease, diabetes, smoking, systolic blood pressure, LVH and eGFR. Plots are generated using restricted cubic splines with 4 knots generated in S-Plus. Hgb, hemoglobin in g/dL. Hatch marks represent the relative proportion of individuals at a given hemoglobin level. Overall effect indicates whether hemoglobin is a statistically significant risk factor for the outcome, while the linearity test indicates if the relationship between hemoglobin and the outcome is linear; for composite and mortality outcomes (p<0.001), the relationship is non-linear.
Discussion
Chronic kidney disease is an important risk state for adverse cardiovascular, stroke and mortality outcomes. Many of the same risk factors that predispose individuals to adverse outcomes in the general population also affect individuals with CKD. These traditional risk factors include older age, hypertension, male sex, smoking, diabetes and dyslipidemia. In the current manuscript, we explored the relationship between non-traditional risk factors and adverse outcomes after accounting for these traditional risk factors. Non-traditional risk factors, generally defined as factors that increase in prevalence as kidney function declines and may cause cardiovascular disease, included serum albumin, diastolic blood pressure, uric acid, body mass index, hypertriglyceridemia, fibrinogen, hemoglobin, and, in CHS only, C-reactive protein. We found that reduced serum albumin and elevated fibrinogen were significant risk factors for cardiac, mortality and composite outcomes in individuals with stage 3-4 CKD and that reduced albumin was also a risk factor for stroke in individuals with CKD. Importantly, several risk factors including albumin and hemoglobin had non-linear relationships with outcomes, such that the relationship was better appreciated after modeling for non-linearity.
Prior studies, including a manuscript by Shipak et al, have examined non-traditional risk factors and cardiovascular risk.8 That study used the CHS database with a similar definition of CKD and focused on CRP, IL-6, fibrinogen, factor VIIIc, Lp(a) and hemoglobin. The authors found that none of these non-traditional risk factors predicted adverse outcomes in individuals with CKD. Importantly, these authors compared the upper quartile with the lower 3 quartiles for each of these analytes and therefore may have underestimated or even obscured complex “U”- or “J”-shaped relationships. When they tested relationships using continuous data, they did find significance for increasing CRP and IL-6 (both log-transformed). Additionally, this study examined only CVD death as an outcome; however, individuals with CKD are at high risk of all-cause mortality and this competing risk my obscure statistically significant risk factors.21,22
An examination of the ARIC cohort by Muntner et al evaluated 391 individuals with CKD at baseline, and, in order to increase power, analyzed an additional 416 individuals who had developed CKD at the time of their second evaluation.7 In multivariable analyses, increased waist circumference, apolipoprotein B, fibrinogen, anemia, and reduced albumin were all associated with cardiac events. However, there is potential bias and loss of generalizability in this study due to the mixing of incident and prevalent CKD patients within the ARIC study. Additionally, this study only examined coronary disease and did not evaluate stroke or overall mortality.
In the current study, we pooled the CHS and ARIC populations as has been done previously and used baseline eGFR, laboratory results and clinical characteristics to evaluate risk factors in individuals with CKD.4,23,24 Beyond providing the ability to confirm several of the findings of the studies by Shlipak et al and Muntner et al, pooling CHS and ARIC provided a large and diverse population with increased generalizability and analytical power. Additionally, in order to account for competing risk (such that individuals with CKD are more likely to die of any cause and therefore may not reach a cardiac outcome before censoring), we performed analyses on multiple outcomes including a composite of cardiac events, stroke and mortality. Finally, we performed detailed investigations to explore the shape of the relationships between potential non-traditional risk factors and outcomes, specifically examining each potential risk factor for linearity and modeling those that were non-linear.
In multivariable analysis of non-traditional risk factors, we found that reduced albumin and increased fibrinogen, serum triglycerides, serum uric acid and CRP all independently predicted the composite outcome, while only reduced serum albumin and increased fibrinogen predicted cardiac outcomes in individuals with CKD. Additionally, hemoglobin below 14.5 g/dL (145 g/L) independently predicted stroke, mortality and the composite outcome while levels above 14.5 g/dL (145 g/L) also predicted mortality and composite events. Finally, elevated diastolic blood pressure only predicted stroke outcomes in CKD.
Our study adds to current knowledge by allowing better interpretation of common laboratory results and physical findings that may influence outcomes in individuals with stage 3-4 CKD. We have shown that the relationships between certain risk factors and outcomes in CKD are not linear. Serum albumin has no significant impact on outcomes at levels above 3.9 g/dL (39 g/L), but with every drop in serum albumin below 3.9 g/dL (39 g/L), the risk of cardiac, stroke and mortality outcomes increases. Similarly, hemoglobin follows a 2-slope model with increasing risk at progressively higher and lower levels than normal. Interestingly, serum triglyceride level was independently associated with composite events in what is likely a non-nephrotic population. This may reflect the nature of dyslipidemia in non-nephrotic CKD, characterized by an accumulation of triglyceride-rich lipoproteins and highly atherogenic small dense LDL, despite normal or even reduced LDL cholesterol levels.25
Curiously, many factors that increase the risk of developing CVD in the general population are protective in individuals with kidney failure. This phenomenon, sometimes dubbed “reverse epidemiology”, remains poorly understood and the time of onset unknown.26 In the current study, general population risk factors including higher BMI and elevated diastolic blood pressure did not independently predict adverse outcomes in individuals with CKD.27,28 Rather than reflecting different pathophysiology, it may be that these altered relationships are due to confounding from malnutrition and cardiomyopathy, respectively, such that BMI and blood pressure decrease as patients become progressively more infirm.29
Our study has several weaknesses. This study has few stage 4 participants and therefore is most applicable to individuals with stage 3 CKD. However, as the prevalence of stage 3 CKD is far greater than stage 4 CKD, this reflects the population-wide epidemiology of chronic kidney disease. Additionally, we estimate GFR using only one measurement of serum creatinine. However, as subjects were clinically well at enrollment, we suspect baseline serum creatinine levels were relatively stable and reflect chronically reduced kidney function. We lack data on proteinuria, an important and potentially modifiable component of CKD that may be related to serum triglyceride and albumin levels as well as future risk of cardiovascular disease. Additionally, we lack data on elements of the bone and mineral disorder of CKD, namely calcium, phosphate and parathyroid hormone; derangements in bone and mineral metabolism often seen in later stages of CKD are increasingly recognized as non-traditional risk factors. We also adjust only for risk factors at baseline. While this does not account for changes over time, it does allow prognostication based on current medical status. Additionally, it is possible that the importance of risk factors is influenced by study differences. However, we included a term for study of origin to account for this. We are unable to account for the development of kidney failure as an outcome; however, as the vast majority of individuals with stage 3 CKD never reach kidney failure, we feel that this study remains representative of the most common outcomes in stage 3-4 CKD patients. Further, we lack data on Hispanic ethnicity. We also lack information on cause of death when it was not due to cardiac disease. Finally, as an observational study, we cannot make inferences about therapies directed at these specific risk factors based on our results.
Our study also has several strengths. We evaluated a community-based population with a wide age range and racial diversity, supporting generalizability to the white and African American US population. Additionally, both CHS and ARIC had thorough event ascertainment with emphasis on cardiac and stroke outcomes.
In conclusion, we have demonstrated that several non-traditional CVD risk factors predict adverse outcomes in individuals with stage 3-4 CKD; in particular, these include elevated fibrinogen and low serum albumin. However, it is important to note that the relationship between risk factors and outcomes in CKD are often not linear and analyses should account for these non-linear relationships.
Acknowledgments
Conflict of Interest/Research Support: Grant Support: R21 DK068310, K23 DK71636, T32 DK007777 and Amgen Inc., Thousand Oaks, CA. Study sponsors were not involved in data analysis or interpretation of findings.
The ARIC Study and CHS are conducted and supported by the National Heart, Lung and Blood Institute (NHLBI) in collaboration with the individual study investigators. This manuscript was not prepared in collaboration with the study investigators and does not necessarily reflect the opinions or views of the study investigators or the NHLBI.
Footnotes
An abstract based on this manuscript was accepted as a poster presentation at the 2007 meeting of the American Society of Nephrology in San Francisco, CA.
References
- 1.Anavekar NS, McMurray JJ, Velazquez EJ, et al. Relation between renal dysfunction and cardiovascular outcomes after myocardial infarction. N Engl J Med. 2004;351:1285–1295. doi: 10.1056/NEJMoa041365. [DOI] [PubMed] [Google Scholar]
- 2.Go AS, Chertow GM, Fan D, McCulloch CE, Hsu CY. Chronic kidney disease and the risks of death, cardiovascular events, and hospitalization. N Engl J Med. 2004;351:1296–1305. doi: 10.1056/NEJMoa041031. [DOI] [PubMed] [Google Scholar]
- 3.Weiner DE, Tighiouart H, Amin MG, et al. Chronic kidney disease as a risk factor for cardiovascular disease and all-cause mortality: a pooled analysis of community-based studies. J Am Soc Nephrol. 2004;15:1307–1315. doi: 10.1097/01.asn.0000123691.46138.e2. [DOI] [PubMed] [Google Scholar]
- 4.Weiner DE, Tighiouart H, Stark PC, et al. Kidney disease as a risk factor for recurrent cardiovascular disease and mortality. Am J Kidney Dis. 2004;44:198–206. doi: 10.1053/j.ajkd.2004.04.024. [DOI] [PubMed] [Google Scholar]
- 5.Appel LJ. Beyond (or back to) traditional risk factors: preventing cardiovascular disease in patients with chronic kidney disease. Ann Intern Med. 2004;140:60–61. doi: 10.7326/0003-4819-140-1-200401060-00013. [DOI] [PubMed] [Google Scholar]
- 6.Sarnak MJ, Levey AS, Schoolwerth AC, et al. Kidney disease as a risk factor for development of cardiovascular disease: a statement from the American Heart Association Councils on Kidney in Cardiovascular Disease, High Blood Pressure Research, Clinical Cardiology, and Epidemiology and Prevention. Circulation. 2003;108:2154–2169. doi: 10.1161/01.CIR.0000095676.90936.80. [DOI] [PubMed] [Google Scholar]
- 7.Muntner P, He J, Astor BC, Folsom AR, Coresh J. Traditional and nontraditional risk factors predict coronary heart disease in chronic kidney disease: results from the atherosclerosis risk in communities study. J Am Soc Nephrol. 2005;16:529–538. doi: 10.1681/ASN.2004080656. [DOI] [PubMed] [Google Scholar]
- 8.Shlipak MG, Fried LF, Cushman M, et al. Cardiovascular mortality risk in chronic kidney disease: comparison of traditional and novel risk factors. JAMA. 2005;293:1737–1745. doi: 10.1001/jama.293.14.1737. [DOI] [PubMed] [Google Scholar]
- 9.The ARIC investigators. The Atherosclerosis Risk in Communities (ARIC) Study: design and objectives. Am J Epidemiol. 1989;129:687–702. [PubMed] [Google Scholar]
- 10.Fried LP, Borhani NO, Enright P, et al. The Cardiovascular Health Study: design and rationale. Ann Epidemiol. 1991;1:263–276. doi: 10.1016/1047-2797(91)90005-w. [DOI] [PubMed] [Google Scholar]
- 11.Levey ASGT, Kusek JW, Beck GJ. A simplified equation to predict glomerular filtration rate from serum creatinine. J Am Soc Nephrol. 2000;11:155A. abstract. [Google Scholar]
- 12.Levey AS, Bosch JP, Lewis JB, Greene T, Rogers N, Roth D. A more accurate method to estimate glomerular filtration rate from serum creatinine: a new prediction equation. Modification of Diet in Renal Disease Study Group. Ann Intern Med. 1999;130:461–470. doi: 10.7326/0003-4819-130-6-199903160-00002. [DOI] [PubMed] [Google Scholar]
- 13.Coresh J, Astor BC, McQuillan G, et al. Calibration and random variation of the serum creatinine assay as critical elements of using equations to estimate glomerular filtration rate. Am J Kidney Dis. 2002;39:920–929. doi: 10.1053/ajkd.2002.32765. [DOI] [PubMed] [Google Scholar]
- 14.Stevens LA, Coresh J, Greene T, Levey AS. Assessing kidney function--measured and estimated glomerular filtration rate. N Engl J Med. 2006;354:2473–2483. doi: 10.1056/NEJMra054415. [DOI] [PubMed] [Google Scholar]
- 15.Levey AS, Coresh J, Balk E, et al. National Kidney Foundation practice guidelines for chronic kidney disease: evaluation, classification, and stratification. Ann Intern Med. 2003;139:137–147. doi: 10.7326/0003-4819-139-2-200307150-00013. [DOI] [PubMed] [Google Scholar]
- 16.Weiner DE, Tabatabai S, Tighiouart H, et al. Cardiovascular outcomes and all-cause mortality: exploring the interaction between CKD and cardiovascular disease. Am J Kidney Dis. 2006;48:392–401. doi: 10.1053/j.ajkd.2006.05.021. [DOI] [PubMed] [Google Scholar]
- 17.Duly EB, Grimason S, Grimason P, Barnes G, Trinick TR. Measurement of serum albumin by capillary zone electrophoresis, bromocresol green, bromocresol purple, and immunoassay methods. J Clin Pathol. 2003;56:780–781. doi: 10.1136/jcp.56.10.780. [DOI] [PMC free article] [PubMed] [Google Scholar]
- 18.Brackeen GL, Dover JS, Long CL. Serum albumin. Differences in assay specificity. Nutr Clin Pract. 1989;4:203–205. doi: 10.1177/0115426589004006203. [DOI] [PubMed] [Google Scholar]
- 19.Sutton-Tyrrell K, Najjar SS, Boudreau RM, et al. Elevated aortic pulse wave velocity, a marker of arterial stiffness, predicts cardiovascular events in well-functioning older adults. Circulation. 2005;111:3384–3390. doi: 10.1161/CIRCULATIONAHA.104.483628. [DOI] [PubMed] [Google Scholar]
- 20.Franklin SS, Khan SA, Wong ND, Larson MG, Levy D. Is pulse pressure useful in predicting risk for coronary heart disease? The Framingham Heart Study. Circulation. 1999;100:354–360. doi: 10.1161/01.cir.100.4.354. [DOI] [PubMed] [Google Scholar]
- 21.Ravani P, Tripepi G, Malberti F, Testa S, Mallamaci F, Zoccali C. Asymmetrical dimethylarginine predicts progression to dialysis and death in patients with chronic kidney disease: a competing risks modeling approach. J Am Soc Nephrol. 2005;16:2449–2455. doi: 10.1681/ASN.2005010076. [DOI] [PubMed] [Google Scholar]
- 22.Fried LF, Katz R, Sarnak MJ, et al. Kidney function as a predictor of noncardiovascular mortality. J Am Soc Nephrol. 2005;16:3728–3735. doi: 10.1681/ASN.2005040384. [DOI] [PubMed] [Google Scholar]
- 23.Howard G, Manolio TA, Burke GL, Wolfson SK, O'Leary DH. Does the association of risk factors and atherosclerosis change with age? An analysis of the combined ARIC and CHS cohorts. The Atherosclerosis Risk in Communities (ARIC) and Cardiovascular Health Study (CHS) investigators. Stroke. 1997;28:1693–1701. doi: 10.1161/01.str.28.9.1693. [DOI] [PubMed] [Google Scholar]
- 24.Wong TY, Larsen EK, Klein R, et al. Cardiovascular risk factors for retinal vein occlusion and arteriolar emboli: the Atherosclerosis Risk in Communities & Cardiovascular Health studies. Ophthalmology. 2005;112:540–547. doi: 10.1016/j.ophtha.2004.10.039. [DOI] [PubMed] [Google Scholar]
- 25.Wanner C, Quaschning T. Dyslipidemia and renal disease: pathogenesis and clinical consequences. Curr Opin Nephrol Hypertens. 2001;10:195–201. doi: 10.1097/00041552-200103000-00007. [DOI] [PubMed] [Google Scholar]
- 26.Kalantar-Zadeh K, Block G, Humphreys MH, Kopple JD. Reverse epidemiology of cardiovascular risk factors in maintenance dialysis patients. Kidney Int. 2003;63:793–808. doi: 10.1046/j.1523-1755.2003.00803.x. [DOI] [PubMed] [Google Scholar]
- 27.Yan LL, Daviglus ML, Liu K, et al. Midlife body mass index and hospitalization and mortality in older age. JAMA. 2006;295:190–198. doi: 10.1001/jama.295.2.190. [DOI] [PubMed] [Google Scholar]
- 28.Kannel WB, Wilson PW, Nam BH, D'Agostino RB. Risk stratification of obesity as a coronary risk factor. Am J Cardiol. 2002;90:697–701. doi: 10.1016/s0002-9149(02)02592-4. [DOI] [PubMed] [Google Scholar]
- 29.Liu Y, Coresh J, Eustace JA, et al. Association between cholesterol level and mortality in dialysis patients: role of inflammation and malnutrition. JAMA. 2004;291:451–459. doi: 10.1001/jama.291.4.451. [DOI] [PubMed] [Google Scholar]