

Abstract
Imaging and delineation of the optic radiations (OpRs) remains challenging, despite repeated attempts to achieve reliable validated tractography of this complex structure. Previous studies have used varying methods to generate representations of the OpR which differ markedly from one another and, frequently, from the OpR's known structure. We systematically examined the influence of a key variable that has differed across previous studies, the tractography seed region, in 13 adult participants (nine male; mean age 31 years; SD 8.7 years; range 16–47). First, we compared six seed regions at the lateral geniculate nucleus (LGN) and sagittal stratum based on the literature and known OpR anatomy. Three of the LGN regions seeded streamlines consistent with the OpR's three “bundles,” whereas a fourth seeded streamlines consistent with each of the three bundles. The remaining two generated OpR streamlines unreliably and inconsistently. Two stratum regions seeded the radiations. This analysis identified a set of optimal regions of interest (ROI) for seeding OpR tractography and important inclusion and exclusion ROI. An optimized approach was then used to seed LGN regions to the stratum. The radiations, including streamlines consistent with Meyer's Loop, were streamlined in all cases. Streamlines extended 0.2 ± 2.4 mm anterior to the tip of the anterior horn of the lateral ventricle. These data suggest some existing approaches likely seed representations of the OpR that are visually plausible but do not capture all OpR components, and that using an optimized combination of regions seeded previously allows optimal mapping of this complex structure. Hum Brain Mapp 35:683–697, 2014. © 2012 Wiley Periodicals, Inc.
Keywords: diffusion‐weighted magnetic resonance imaging, DWI, tractography, optic radiations, Meyer's Loop
INTRODUCTION
The optic radiations (OpRs) form a critical component of the visual pathway. Neurosurgery in the lateral temporal, inferior parietal, and occipital lobes places these structures at risk. This risk is very real; the potential for vision loss after temporal lobe surgery has long been apparent [Falconer and Serafetinides, 1963; Falconer and Wilson, 1958] and is estimated to occur to some degree in approximately 50–100% of such patients [e.g., Barton et al., 2005; Nilsson et al., 2004]. The risk of insult is high as the OpR follow a “plunging” [Meyer, 1907] and highly variable course into the anterior and lateral temporal lobe [e.g., Ebeling and Reulen, 1988; Meyer, 1907]. In this context the ability to noninvasively map this structure's course presurgically is particularly important, and was recognized before the advent of diffusion‐weighted magnetic resonance imaging (DWI) [Ebeling and Reulen, 1988]. Since its development DWI tractography of the OpR has become a widely studied element of presurgical planning [Duncan, 2010].
Published Methods of OpR Mapping Vary Markedly
Over the last decade a number of studies have reported varied levels of success in mapping the OpR [Bassi et al., 2008; Behrens et al., 2003; Catani et al., 2003; Chen et al., 2009; Ciccarelli et al., 2003; Hofer et al., 2010; Kamada et al., 2005; Sherbondy et al., 2005; Stieglitz et al., 2011; Taoka et al., 2008; White and Zhang, 2010; Winston et al., 2011; Wu et al., 2012; Yamamoto et al., 2012, 2005; Yogarajah et al., 2009; Yoshida et al., 2006]. The enduring interest in comprehensively mapping this structure reflects both its clinical significance and the tracts' standing as one of the most difficult for DWI‐based methods to image [Wu et al., 2012].
A variety of approaches have been used to map the OpRs. For instance, maximum tract angle, expected to be a critical determinant of the ability to track the OpR's rapidly curving anterior fibers (Meyer's Loop), has been alternately constrained [e.g., at 70° Yamamoto et al., 2007 or 130° Sherbondy et al., 2008a or left unconstrained [180° Winston et al., 2011; Yogarajah et al., 2009]. This angular constraint has been applied to the radiations as a whole [e.g., Sherbondy et al., 2008b; Winston et al., 2011; Yamamoto et al., 2007; Yogarajah et al., 2009] or to different parts of the OpR differently [e.g., 30–70°; Hofer et al., 2010]. Other factors [e.g., minimum fractional anisotropy (FA), restriction of tract length] have been similarly varied [Catani et al., 2003; Chen et al., 2009; Hofer et al., 2010; Taoka et al., 2008; Yamamoto et al., 2007].
A key point of variation, which forms the focus of this article, is the lack of consistency in the regions used to seed, select or exclude streamlines representing the OpR (Fig. 1). This variation has been discussed in the literature [Stieglitz et al., 2011] and is of singular importance. Although variation in other parameters will modify the extent and trajectory of radiations, accurate seeding ensures all components of the structure are identified and none are overlooked in their entirety. Tractography has typically involved seeding from one or more regions of interest (ROIs) and selecting streamlines that make contact with a waypoint or target. Regions used have usually centered on areas in which the tracts are known to originate [the lateral geniculate nucleus (LGN)] and terminate (occipital lobe). Specifically, methods reported to date include seeding the LGN as identified visually [Yamamoto et al., 2005] or via streamlines from the optic chiasm [Catani et al., 2003; Sherbondy et al., 2008b]; seeding white matter adjacent to the LGN presumed to constitute Meyer's Loop [Kamada et al., 2005], and seeding both of these regions [Winston et al., 2011]. When white matter proximal to the LGN has been seeded the criteria used to define this region have varied markedly [Figure 1; see Bassi et al., 2008; Ciccarelli et al., 2003; Taoka et al., 2008; White and Zhang, 2010]. Occipital ROI selection has been similarly varied, and has included the use of one [e.g., Catani et al., 2003; Kamada et al., 2005], two [Chen et al., 2009; Winston et al., 2011], or three [Hofer et al., 2010; Yamamoto et al., 2005] ROI. These regions have included the site of the radiations' termination, the calcarine sulcus [e.g., Chen et al., 2009; Hofer et al., 2010], the occipital white matter more broadly [Catani et al., 2003; Yoshida et al., 2006], and the sagittal stratum [Yogarajah et al., 2009]. Results may simply be seeded without further editing [Yoshida et al., 2006] or, more typically, constrained with specific targets and sometimes waypoint ROI [Winston et al., 2011]. They may be further limited by the placement of midline and frontal ROI [Yogarajah et al., 2009] or manual editing [e.g., Sherbondy et al., 2005]. ROI size may be unconstrained or may be held constant, for example at 1, 9, 15, or 18 voxels of various sizes across individuals [Bassi et al., 2008; Ciccarelli et al., 2003; Winston et al., 2011; Yogarajah et al., 2009].
Figure 1.
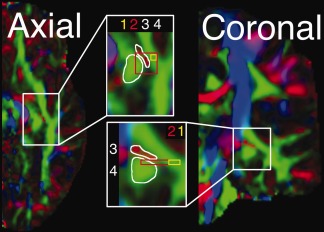
Illustrative seed regions used in OpR tractography. Shown on a single hemisphere (FA‐modulated diffusion map) in axial and coronal orientations. (1) A voxel on an axial slice of anterolaterally oriented diffusion “at the apex of the arc around the lateral ventricle” [Ciccarelli et al., 2003, p. 350]; i.e. in Meyer's Loop (2D volume). (2) Nine voxels on a single axial slice at the same location as Region 1 [Bassi et al., 2008; 2D volume]. (3) Mediolaterally oriented white matter adjacent (and extending anterior and posterior to) the LGN [White et al., 2009; 3D volume; red voxels]. (4) White matter anterior to the LGN [Taoka et al., 2008; green voxels]. Regions are approximate based on written and visual descriptions in cited articles.
Evaluating OpR Tractography
The effect of this variation on results is unclear due to the lack of a clear method for evaluating tractography. Historically results have been visually inspected to determine the “presence or absence of tracts at expected anatomic locations” [p. 782, Yamamoto et al., 2005], such as the presence of anterior fibers over the inferior horn of the lateral ventricle [Yogarajah et al., 2009]. With the field's development there has been a move to codify such evaluation [e.g., Hofer et al., 2010; Nilsson et al., 2007; Stieglitz et al., 2011; Wu et al., 2012]. Data provided from these methods suggest that tractography generated by existing methods both varies markedly and matches the OpR's known anatomy less than adequately (Fig. 2).
Figure 2.
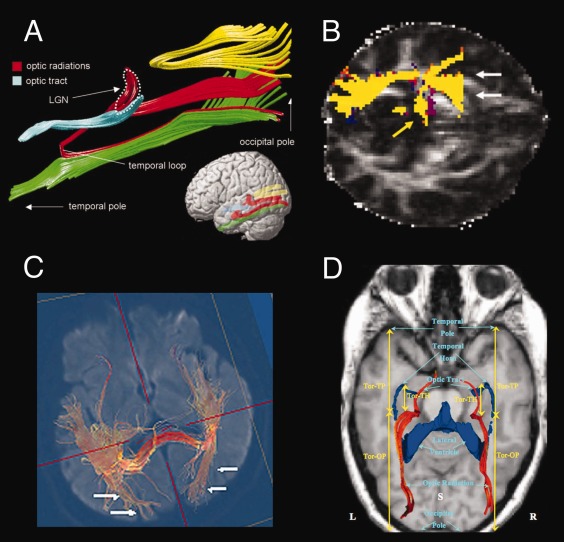
Tractography of the optic radiation(s) (OpR) mapped using various methods. (A) Catani et al. [1999]. OpR seeded from LGN to occipital white matter. Shown with key landmarks and the inferior longitudinal fasciculus (green), splenium (yellow), and optic tract (blue). (B) Ciccarelli et al. [2010]. OpR seeded from a voxel in white matter anterolateral to the LGN where the main eigenvector was anteromedial to posterolateral using probabilistic tractography. White arrows indicate false positive streamlines; yellow arrows, medial LGN connections. (C) Yoshida et al. [2009]. OpR seeded from the stratum sagittal. (D) Wu et al. [2012; red streamlines]. The OpR were “seeded along the optic tracts, near the LGN or next to the OR” [Wu et al., 2012, p. 146]; TP, temporal pole; Tor, anterior tip of the optic radiations; OP, occipital pole; S, superior view. ((A) From Catani et al., “Occipitotemporal connections in the human brain.” Brain, 2003, 126, 2093 by permission of Oxford University Press. (B) Reprinted from Neuroimage Ciccarelli, Parker, Toosy, Wheller‐Kingshott, Barker, Boulby, Miller, and Thompson, “From diffusion tractography to quantitative white matter tract measures: a reproducibility study”, 2003, 348–359, copyright, with permission from Elsevier. C. From Yoshida, Ida, Nguyen, Iba‐Zizen, Bellinger et al. (2006) Resolution of Homonymous Visual Field Loss Documented with Functional Magnetic Resonance and Diffusion Tensor Imaging. Journal of Neuro‐Ophthalmology 26 (1), p13, with permission Wolters Kluwer Health. D. From Wu, Rigolo, O'Donnell, Norton, Shriver, Golby (2012) Visual Pathway Study Using In Vivo Diffusion Tensor Imaging Tractography to Complement Classic Anatomy. Operative Neurosurgery 1, p149, with permission Wolters Kluwer Health.)
Qualitative scoring schemes have centered on the ability to identify the three central “bundles” of the radiations, usually with reference to Meyer's [2012] seminal ex vivo examination of the OpR. Here points are awarded if three discrete components are identified [Hofer et al., 2010], with additional points given for a fuller reconstruction of tracts. Stieglitz and colleagues [2011] awarded further points if the tracked fascicles passed key anatomical landmarks (the trigonum) and terminated in the calcarine sulcus. These metrics suggest existing methods map the radiations well, but less than completely [Hofer et al., 2010; Stieglitz et al., 2011]. They are also somewhat subjective and frequently cannot easily be compared across studies due to the extent of documentation and lack of inter‐rater reliability estimates.
In quantitative assessment [e.g., Stieglitz et al. 2004; Wu et al., 2012] the location of the radiations' most anterior extent (the most difficult component to track) has been related to key anatomical landmarks. The anterior horn of the lateral ventricle is a key proximal structure, more distal structures (temporal, occipital poles) have also been used. These measures allow comparison with ex vivo data, which typically suggest the anterior fibers extend anterior to the lateral ventricle's inferior horn [Chowdhury and Khan, 2010; Ebeling and Reulen, 1988; Peuskens et al., 2004; Rubino et al., 2005]. Against these metrics results have also varied markedly, consistently under‐estimating the reach of the anterior radiations [e.g., Nilsson et al., 2007; Wu et al., 2012]. This method of evaluation is limited by the quality of ex vivo measurements given the complexity of dissection which involves fixing and freezing the brain, and painstakingly removing only overlying fibers using wooden or steel implements [Agrawal et al., 2011]. Technical differences between ex vivo dissection and MR‐based imaging methods also make comparison of these forms of data difficult [Burgel et al., 1999; Ciccarelli et al., 2003]. Importantly the OpR's exceptional interindividual variation [Ebeling and Reulen, 1988] also means it is not possible to take any one individual's results and compare them with population metrics.
Finally, visual representations of tractography allow description of overall tractography quality and plausibility [e.g., Wu et al., 2012]. This is one of the most effective means of reporting results in that it allows direct evaluation of quality by others. A review of such data (e.g., Fig. 2) again suggests the quality of existing OpR tractography varies markedly. A limitation of this approach is that the mode of presentation also restricts the ability to appreciate a method's strengths and weaknesses (e.g., presence of aberrant tracts). Adopting a standard angle for presentation and presenting results for all cases can mitigate this weakness [e.g., Wu et al., 2012].
The gold standard for evaluation of OpR tractography (in the absence of ex vivo data) thus appears to be joint (i) qualitative and (ii) quantitative assessment with (iii) visual presentation of data. In spite of recent and impressive efforts to move toward rigorous evaluation of output [Hofer et al., 2010; Stieglitz et al., 2011; Wu et al., 2012] at this point the results of studies using different tractography methods remain difficult to compare.
What Should Accurate OpR Tractography Look Like?
Ex vivo studies of the radiations [Choi et al., 2006; Chowdhury and Khan, 2010; Ebeling and Reulen, 1988; Peltier et al., 2006; Peuskens et al., 2004; Pujari et al., 2008; Rubino et al., 2005; Sincoff et al., 2004] provide a picture of how accurate OpR tractography will appear. This deviates somewhat from assumptions in existing scoring schemes and is thus reviewed briefly.
Importantly, accurate OpR tractography will produce a single sheet of streamlines. The fibers of the OpR emerge from the LGN as the most posterior component of the internal capsule, forming “a continuous sheet of fibers with no separation of fibers” [Levin, 2006, p. 244; Fig. 3]. Conceptually, these fibers form discrete (i) anterior, (ii) central, and (iii) posterior “bundles” [Ebeling and Reulen, 1988], “segments” [Peltier et al., 2006] or “tracts” [Jones and Tranel, 2011] according to their trajectory and course. (i) The first bundle exits the LGN anteriorly then curves laterally over the roof of the lateral ventricle's inferior horn. After this rapid turn in the anterior temporal lobe these fibers course posteriorly, joining the other two bundles as the inferior sagittal stratum. Folding under the lateral ventricle's occipital horn they terminate in the calcarine cortex's lower lip [Ebeling and Reulen, 1988]. The largest group leaves the LGN laterally as (ii) the central fibers, running over the roof of the inferior horn of the lateral ventricle to pass along its wall. Moving under the ventricle's occipital horn they terminate in the occipital pole. The final (iii) posterior (upper/dorsal) bundle courses immediately posteriorly to join the other bundles and runs alongside the ventricle before turning to terminate in the calcarine fissure's upper lip [Ebeling and Reulen, 1988; Peltier et al., 2006].
Figure 3.
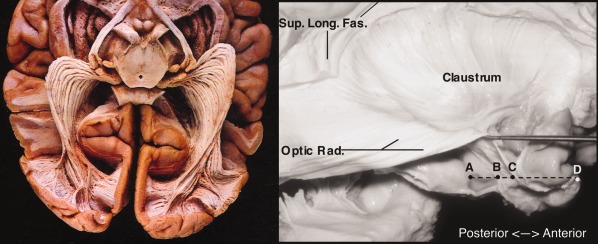
The optic radiations (ex vivo samples). Left: inferior view. Basal structures, cortex, and white matter removed. From: Gluhbegovic & Williams, The Human Brain (1980). With permission of Lippincott Williams & Wilkins, 1980. Right: lateral view of optic radiation (Optic Rad.) with overlying structures removed. Note continuous, sheet‐like structure rather than three spatially discrete bundles. Also labeled: superior longitudinal fasciculus; A, hippocampal head; B, tip of temporal horn of lateral ventricle; C, anterior tip of optic radiation; D, temporal pole. From Rubino, Rhoton, Tong, De Oliviera (2005) Three‐dimensional Relationships of The Optic Radiation. Neurosurgery 57 (Sup. 4), p227, with permission Wolters Kluwer Health.
This arbitrary division of the sheet of the OpR into three bundles also corresponds with the OpR's functional organization. More anterior and posterior fibers (bundles) carry information from the upper and lower (contralateral) visual field quadrants, respectively, whereas central visual information (macular region) is carried in central fibers [Ebeling and Reulen, 1988; Jones and Tranel, 2011].
Current methods do not appear to reconstruct a sheet following the course of each of these bundles (Fig. 2). Variable descriptions of the OpR's “three bundles” have also led to scoring systems centering on three spatially discrete fiber bundles [Hofer et al., 2010; Stieglitz et al., 2011]. In this context Hofer et al. [2004] describe the radiations as “three large fiber bundles” (p. 1), and (schematically) depict spatially discrete bundles, and Wu et al. [2012] imply anatomical separation between “three bundles… found in the classic cadaveric study by Meyer” (p. 145). Meyer's [2012] work is frequently cited in discussions of these bundles. Meyer discussed a number of pathological cases whose pathology made the anterior fibers' course through the temporal lobe clear. One case was particularly significant (see also Fig. 4).
Figure 4.
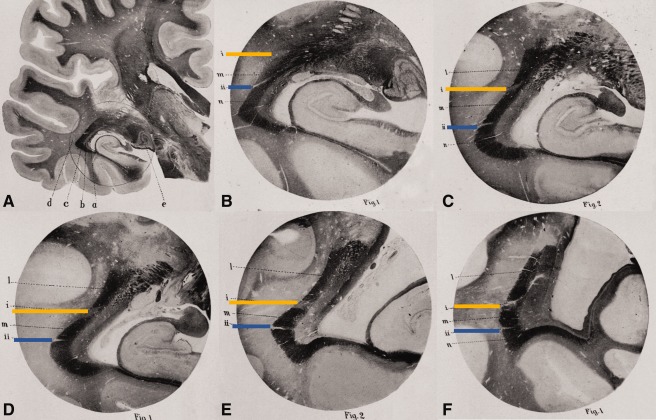
Meyer's [2012] “The subdivision of bundles.” The following is a series of coronal slices along the length of the optic radiation from the level of the LGN (A and B) to the occipital region (F). Images are photomicrographs (carmine‐stained Weigert preparations). A: left hemisphere section; e, external geniculate body (LGN); a, tapetum; b, internal sagittal marrow; c, external sagittal marrow; d, subcortical marrow. Circle indicates area enlarged in (B). (B)–(F) constitute the same approximate location in consecutive posterior sections. In each image the optic radiation is apparent as a dark band. This dark band is divided by two points of degeneration (indicated in yellow, blue) to create three “bundles.” Bundle 1: the dark region below the blue strip (anterior fibers; Meyer's Loop). Bundle 2: dark region between blue and yellow strips (“medial” fibers). Bundle 3: dark region above yellow strip [(C)–(F); posterior fibers]. Adapted from Meyer, “The connections of the occipital lobes and the present status of the cerebral visual affections.” Trans Assoc Am Physicians, 1907, 22, 7–16, with permission John Wiley & Sons.
“The third case… illustrates a[n]… even more far‐reaching help, the subdivision of bundles. There is a symmetric lesion… cutting into the dorsolateral part of the sagittal marrows as far as the ventricle… The remaining external sagittal marrow is divided by two small foci or slits… The secondary degeneration makes the relative position and course of these isolated bundles perfectly plain… It is… possible with this case to determine the course of the dorsal, the lateral, and the ventral segments of the external sagittal marrow to the calcarine cortex.” [Meyer, 1907, pp. 8–9. Reproduced with permission of John Wiley & Sons. Italics in original].
Here, then, one patient's pathology artificially divided the continuous band of the OpR [Levin, 2006] into three discrete “bundles,” allowing Meyer to ingeniously trace the relative course of fibers within the OpR along the structure's length. Separately, the concept of “bundles” (or “tracts” or “segments”) has been used to describe the radiations' functional organization [Ebeling and Reulen, 1988; Jones and Tranel, 2011; Peltier et al., 2006].
The aim of this study was to develop an optimal approach for delineation of seed ROI for tractography of the OpRs. To this end tractography was generated from different white matter seed ROI around the LGN and within the sagittal stratum. ROI were selected on the basis of the existing literature and anatomy. Based on the radiations' known anatomy, we hypothesized that seeding from the region of anterioposteriorly oriented diffusion anterolateral to the LGN would seed streamlines consistent with the OpR's anterior and posterior components, whereas the overlying mediolaterally oriented diffusion would seed the radiations' middle/central components. We also hypothesized consistent identification of all components of the OpR would be enabled by seeding from a number of these ROI.
MATERIALS AND METHODS
Participants
Thirteen healthy adults (nine male; mean age 31.3 years; SD 8.7; range 16.5–47.4) completed MR imaging at Children's Hospital Boston. The study was approved by the Institutional Review Board and all participants provided informed consent.
Procedure
Imaging protocol. An MPRAGE was acquired with a matrix size of 256 × 256 and a FOV of 200–256 mm depending on the size of the subject's head. Diffusion images were acquired at 24 cm FOV, 128 × 128 matrix, 2 mm thick contiguous slices (whole brain), TE = 78 ms; IPAT = 2 using a 32‐channel head coil. Forty‐five diffusion‐weighted images were collected (five b = 0 images, 26 b = 1000 images, six b = 2000, and eight b = 3000 images). In seven cases, a T2 image was available and used as an additional reference in registration. Images were acquired on a 3T Siemens Trio.
Tractography
Tractography and further analysis were completed using our optimized processing stream in CRKit (http://crl.med.harvard.edu/) described previously [Peters et al., 2012]. Non‐DWI data were resampled to 1 mm3, and the intracranial cavity was segmented using a previously validated segmentation algorithm [Grau et al., 2004; Weisenfeld and Warfield, 2009]. Each participant's diffusion‐weighted images underwent affine registration and upsampling to their T1 image, correcting for patient motion and (in part) eddy current distortion. Maps of FA, mean diffusivity, axial diffusivity and radial diffusivity were generated with a single tensor diffusion model.
We utilized a previously described and validated stochastic tractography algorithm to estimate streamlines representing the OpRs. Our stochastic algorithm for tractography [see Lewis et al., 2012; Peters et al., 2012] combines the speed and accuracy of deterministic decision making at each step inside a voxel with probabilistic sampling of streamlines to better explore the space of all possible streamlines. Potential streamlines were stochastically initialized and evaluated starting from the seed regions. Streamlines were constructed with sequential steps through the tensor field at subvoxel resolution, utilizing subvoxel log‐Euclidean tensor interpolation. While evaluating each streamline, we checked conventional stopping criteria, including streamline curvature and FA, but incorporated the previous path of the streamline to compensate for local inhomogeneities. Streamline stepping direction was determined by a linear combination of tensor deflection and primary eigenvector orientation. The range of potential streamlines examined is broad compared to conventional deterministic tractography. Stochastic sampling was continued until a predetermined number of streamlines had been created for each seed voxel. This strategy has been validated previously [Lewis et al., 2012; Suarez et al., 2012]. Specific parameters used included a minimum FA of 0.1; FA momentum of 0.5; maximum angle (by step) of 30° with six steps per voxel and angular (and directional) momentum set to 0.5, tensor deflection fraction of 0.95 and 10 seeds per voxel. These choices are based on those used successfully previously [Suarez et al., 2012] and include stepping at subvoxel resolution to improve tracking accuracy, a large number of seeds to effectively sample the population of potential streamline trajectories and a low angular threshold (six steps/voxel; 30°/step) to accommodate the course of Meyer's Loop.
ROI identification strategy. ROI were drawn manually using itk‐SNAP (http://www.itksnap.org) on a color‐coded FA image (blue: inferior–superior; green: anterior–posterior; red: medial–lateral). In the first analysis, candidate ROI based on the radiations' known anatomy and previous published approaches were systematically contrasted. An optimized approach was then identified and systematically evaluated.
Part 1: ROI Selection and Comparison
Candidate LGN and occipital (sagittal stratum) ROI were seeded and streamlines conforming to the known course of the radiations were evaluated in 12 hemispheres (six participants).
LGN: The OpR is best seeded from the high FA white matter lateral to the LGN [Behrens et al., 2003]. This tissue exits the LGN in anterior, medial, and posterior bundles. These bundles' appearance can be appreciated by comparing a section of the known radiations with DWI and structural data (Fig. 5, top row). Six candidate LGN ROI were identified and traced axially (Fig. 5, bottom row) from where the internal capsule's posterior limb transitions to the cerebral peduncle [Winston et al., 2011]. These included
LGN1: the anterior–posterior oriented diffusion representing the optic tract,
LGN2: the area of anteroposteriorly oriented diffusion (green) anterolateral to the LGN [Bassi et al., 2008; Ciccarelli et al., 2003; Taoka et al., 2008]. This was drawn inferiorly to where it was separated from LGN3 by extremely low FA voxels.
LGN3: a region of low FA voxels of intermediate direction (green/orange/red) between LGN2 and 4;
LGN4: the area of high FA mediolaterally oriented diffusion (red) overlying and lateral to this [White and Zhang, 2010]. Relative to LGN2 this extends posteriorly/superiorly as well as anteriorly/inferiorly to the region representing the anterior commissure. Red/pink/purple voxels are included at the anterior‐most extent.
LGN5: the area of high FA mediolaterally oriented diffusion (red) anteromedial to LGN3 (i.e., within the ascending fibers that will form the internal capsule) which becomes continuous with LGN4.
LGN6: the region of low FA anterior–posterior to inferosuperiorly oriented diffusion (light blue‐purple‐green) posterior to LGN2, traced on two consecutive coronal images.
Figure 5.
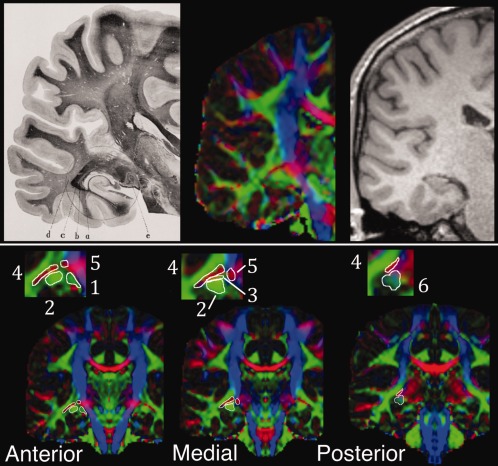
Illustration of lateral geniculate nucleus (LGN) candidate seed regions with reference to the region's known anatomy. Top row: coronal LGN and radiations in section from Meyer [2012; left] at level of LGN. e, external geniculate body (LGN); a, tapetum; b, internal sagittal marrow; c, external sagittal marrow; d, subcortical marrow. Approximately equivalent image on diffusion‐weighted (center) and T1 (right) images. Bottom row: coronal DWI images with LGN regions of interest illustrated on a mirrored hemisphere at relatively anterior, medial and posterior regions (inset: enlargement of LGN region). Numbers refer to the six regions of interest described in text.
These regions were chosen to reflect published approaches to tracking the radiations (LGN1, LGN2, and LGN4) as well as the fact that the bundles of the OpR should leave the LGN anteroposteriorly to mediolaterally (LGN2, LGN3, and LGN5). The optic tract was seeded in place of the chiasm [e.g., Stieglitz et al., 2011] as the chiasm is frequently only partially imaged in standard DWI imaging due to magnetic susceptibility changes associated with air in neighboring structures and the nearby interface of brain with bone, fat and CSF [see discussion in Hofer et al., 2010]. LGN6 was chosen to determine whether this region at the posterior extent of LGN2 includes only fibers of the fornix or can also reliably seed the OpR.
All fibers of the radiations form part of the sagittal stratum, which courses posterolaterally to the lateral ventricle in a single band [Ebeling and Reulen, 1988]. This is flanked by medial and lateral bands (colossal fibers/tapetum and inferior longitudinal fasciculus). We examined three discrete regions on directionally coded FA images on the slice immediately posterior to the splenium of the corpus callosum (approx. level of the trigone), including (Fig. 6):
SS1: medial;
SS2: central; and
SS3: lateral bands.
Figure 6.
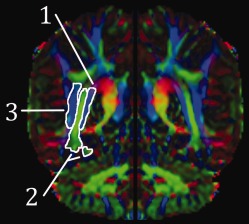
(1) Medial, (2) central, and (3) lateral sagittal stratum regions of interest illustrated on a single (mirrored) hemisphere (color‐coded FA image).
All contiguous voxels of a single color were included and, in the case of the central band, inferior and medial extensions were included when apparent. For the LGN ROI, the subset of streamlines that made contact with any of the stratum ROI were then selected and truncated at the LGN. Similarly, stratum streamlines that made contact with any LGN ROI were selected. In all instances, exclusion ROI included midline (sagittal) and frontal (coronal) planes, the latter drawn three slices (3 mm) posterior to the most anterior temporal white matter.
The purpose of this analysis was to identify regions of white matter surrounding the LGN that consistently seeded a significant proportion of streamlines representing the OpR across participants. As such, rather than a purely qualitative assessment the number of streamlines consistent with the OpR were counted and expressed as a percentage of total streamlines seeded from each ROI (10 streamlines were seeded per voxel).
Part 2: ROI Validation
Based on the initial analysis an optimized strategy was then validated in 14 hemispheres (remaining seven participants). A single optimized LGN ROI was drawn incorporating LGN2–5 as a continuous structure. This was initially located on the axial slice where the internal capsule transitions to the cerebral peduncle. For clarity, this region is described in terms of the LGN regions from the above analysis. At its most inferior bound, LGN2 was drawn until it was definitively separated from LGN4 by extremely low FA voxels. The more anterior region of mediolaterally oriented diffusion (likely to represent the anterior commissure) was also traced when it became essentially continuous with the main component of LGN4. LGN4 ended in an area of very low FA purple/blue/red. ROI were reviewed on sagittal images. Streamlines from the LGN that touched the sagittal stratum ROI (SS1 with SS2 combined) were cut at the LGN and evaluated. The above exclusion ROI were used, any extraneous streamlines, namely arising from the most anterior region of the ROI and representing the fornix/anterior commissure, were excluded [Sherbondy et al., 2008b].
Accurate delineation of each LGN ROI was essential to ensure the identification of Meyer's Loop's anterior extent. An experienced rater delineated this region within approximately 15 min, and average ROI volume was 1147.6 mm3 (SD 325.9 mm3; range 736–1647 mm3) reflecting marked between‐subject variation (within‐subject variation average 7.2% [SD 4.6%]). Inter‐rater‐reliability was directly assessed using a Dice similarity coefficient (DSC) to evaluate 3D ROI overlap and reproducibility (raters: CB and JS) in 10 hemispheres not presented here. The value of the DSC ranges from 0 (no overlap) to 1 (complete overlap). The average DICE value was 0.76 ± 0.02 (range 0.75–0.79). The precise placement of inclusion (stratum) and exclusion ROI was completed in approximately 5 min, and (where slice thickness was 1 mm) inter‐rater variance in selection of the sagittal stratum planar ROI was 0.2 ± 0.8 mm (range −1 to 1 mm); for the anterior temporal plane, 1 ± 0.7 mm (range −2–0 mm); for the midline plane, 0.6 ± 1.14 mm (−1–2 mm).
Qualitative and quantitative metrics were used for evaluation. Results are also presented visually.
Quantitative analysis. The distance between the OpR's key landmark, the most anterior tip of Meyer's Loop, and the most proximal anatomical landmark, the anterior tip of the temporal horn of the lateral ventricle, was measured. This was evaluated on a 3D model of the OpRs overlaid on the patient's axial T1 image. The anterior tip of Meyer's was identified as the most anterior point of the most anterior OpR streamline. The most anterior portion of the lateral ventricle was identified on the most anterior slice where CSF gave way to gray or white matter. Inter‐rater reliability of this estimate (JS, CB) was evaluated in 10 hemispheres not included here. Measurement variation was 0.3 mm (SD 0.55 mm; range −0.67 to 1.33 mm).
Qualitative scoring. The correspondence between tractography output and the course of the radiations was evaluated with a modified version of the methods used by Hofer et al. [2004] and Winston et al. [2010]. The medial and posterior bundles of the OpR appeared as a sheet of fibers, mirroring the radiations' known anatomy [Ebeling and Reulen, 1988; Levin, 2006; Rubino et al., 2005], and were thus scored jointly. Inter‐rater reliability with this metric (JS and CB) was (Cohen's Kappa) 0.73, indicating “substantial” agreement [Munoz and Bangdiwala, 1997]. Tract seeding and termination were scored separately. These measurements of the reproducibility of the localization of the ROIs demonstrate that the process of creating the ROIs in an individual is sufficiently reproducible to achieve highly accurate delineation of the OpR.
The anterior bundle was considered identified if streamlines moved antero/posterolaterally from a relatively anterior region of the LGN ROI in the region of the anterior lateral ventricle then coursed posteriorly to the occipital lobe. Scoring of seeding rested on evidence that a sheet of fibers should be seeded [Ebeling and Reulen, 1988; Levin, 2006; Rubino et al., 2005]. Seeding: streamlines were scored 0 if the anterior bundle was not identified, 1 if it was seeded but there were many gaps between streamlines, and 2 if a continuous/near‐continuous sheet of streamlines was generated. Termination was also scored. 0 was awarded if the majority of streamlines terminated outside the occipital lobe; 1 if they terminated in the occipital lobe, and 2 if they terminated in calcarine/polar cortex.
Medial/posterior bundles were considered tracked if streamlines exiting the LGN laterally and posteriorly to the LGN were identified. Seeding and termination were evaluated as above, but with point scores doubled (0/2/4).
RESULTS
The six white matter regions surrounding the LGN seeded to the sagittal stratum with varying consistency (Table 1).
Table 1.
Analysis 1: sub‐ROI results (12 hemispheres)
| Streamlines seeded to target region | Cases seeding no target streamlines (Number of cases) | ||||
|---|---|---|---|---|---|
| Average (%/total) | SD (%/total) | Min (%/total) | Max (%/total) | ||
| LGN1 | 3.9 | 5.3 | 0.0 | 13.3 | 5 |
| LGN2 | 4.0 | 5.7 | 0.0 | 21.1 | 0 |
| LGN3 | 25.9 | 18.2 | 6.4 | 55.2 | 0 |
| LGN4 | 37.7 | 11.8 | 16.3 | 57.1 | 0 |
| LGN5 | 32.5 | 30.9 | 0.5 | 93.5 | 0 |
| LGN6 | 3.7 | 5.9 | 0.0 | 21.7 | 3 |
| SS1 | 10.0 | 11.2 | 0.0 | 36.0 | 1 |
| SS2 | 7.3 | 4.7 | 1.4 | 15.0 | 0 |
| SS3 | 0.5 | 1.1 | 0.0 | 3.2 | 6 |
Results from analysis of streamlines seeded from LGN and sagittal stratum subregions. Percentages are proportion of total streamlines seeded from each region to the relevant target within the optic radiations. Target for the LGN subregions was any component of the sagittal stratum; the target for the stratum components was any of the LGN subregions.
LGN1, the optic tract, seeded components of the OpR infrequently (<4% of streamlines) and biologically implausibly. The maximum percentage of streamlines seeded to the stratum across the sample was 13.3%, and in just under half the sample (5) no streamlines consistent with the radiations were seeded. LGN2, consisting of voxels with anteroposteriorly oriented diffusion anterolateral to the LGN, also seeded relatively few OpR streamlines on average (4%). In all hemispheres, however, streamlines congruent with the radiations were seeded. Importantly, these were typically consistent with the known course of the OpRs (Fig. 7, yellows streamlines).
Figure 7.
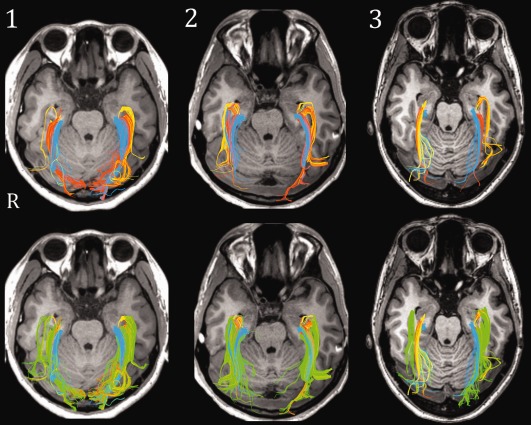
Results from initial tractography of white matter regions bordering LGN (three exemplary participants) displayed axially. Top: streamlines seeded from LGN ROI two (yellow); three (orange), and five (blue). Bottom: same data, with streamlines seeded from region four (green) overlaid. Note the correspondence between green streamlines with those seeded from other ROI (particularly anterior and middle streamlines).
LGN regions 3–5 seeded to the stratum most consistently and generated target streamlines in all cases. Over a quarter of the streamlines seeded from the region of low FA voxels overlying LGN2 (that is, region LGN3) passed through the stratum; as did over a third of those from the region of high mediolaterally oriented diffusion superior to this (i.e., LGN4). Just under a third of those from LGN5, the region of mediolaterally oriented diffusion medial to LGN4 within the boundaries of the ascending corticospinal tracts, traversed the stratum. Finally, LGN6, the region of anteroposteriorly to inferosuperiorly oriented diffusion at the posterior extent of LGN2, seeded a small number of streamlines to the stratum inconsistently.
Qualitatively, regions LGN2, LGN3, and LGN5 generated largely complementary components of the OpR (Fig. 7). Streamlines from LGN2 followed the course of Meyer's loop, whereas those from LGN3 either followed the same path or, more typically, a trajectory consistent with that of the “medial” bundle of the radiations (i.e., coursing laterally and posteriorly, between streamlines from LGN2 and LGN5). Finally, LGN5 generated streamlines dorsal to LGN2 and LGN3, consistent with the course of the posterior (dorsal) bundle. In contrast, LGN4 generated streamlines that demonstrated marked overlap with those from LGN2, LGN3, and LGN5 (Fig. 7, green streamlines). These streamlines reflected the structure of the radiations in their sheet‐like structure and substantial overlap with streamlines from LGN2, LGN3, and LGN5.
The two medial components of the sagittal stratum (SS1 and SS2) seeded streamlines to the LGN region most consistently (Table 1). Those from the most lateral region (SS3) did not reach the LGN in half the sample, and only a small portion did so (at most 3%) in the remaining half.
On the basis of this analysis, the optimal LGN regions were considered to include LGN2–5, whereas the optimal stratal regions included SS1 and SS2. These LGN regions were combined into a single seed region, and the stratal regions into a single “touch” region. These were used to generate the radiations in the other 14 hemispheres (seven participants).
This strategy yielded tractography results that bore a close correspondence to the known structure of the OpRs (Fig. 8; Table 2). Across the group, the most anterior extent of the radiations fell on average 0.2 ± 2.4 mm (range −4 to 5 mm) anterior to the anterior horn of the lateral ventricle. Qualitative analysis indicated both the anterior and medial/posterior components of the radiations were identified in all individuals. With respect to the quality of seeding, the medial/posterior components typically formed a sheet of fibers (93% of cases), whereas the anterior bundle did so in half of the cases. Similarly, although all fibers terminated within the occipital lobe, the medial/posterior bundles reached the calcarine/polar region in a majority of cases (71%), whereas the anterior fibers did so in approximately a third of cases (36%).
Figure 8.
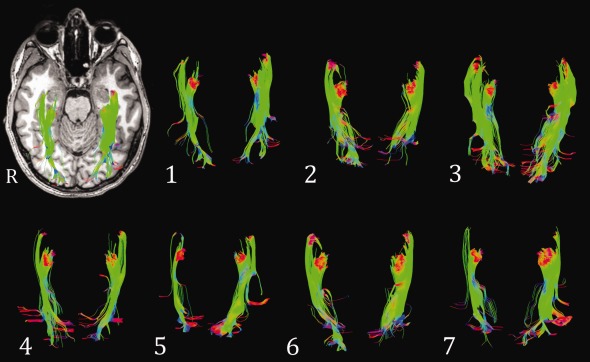
Final tractography results. These represent the optic radiations seeded from LGN ROI 2–5 (axial view) of each participant. Results from 14 hemispheres (seven participants). Top left: data from Participant 1 overlaid on their T1 image.
Table 2.
Analysis 2: Results of optimized strategy
| Quantiative Scoring (group) | Quantiative Scoring (group) | |||||||||||
|---|---|---|---|---|---|---|---|---|---|---|---|---|
| Meyers ‐ TH distance | 0.2±2.4mm | Anterior Bundle | Seeding (points) 1.5±0.5 | Termination (points) 1.4±0.5 | Medial/ Posterior | Seeding (points) 3.9±0.5 | Termination (points) 3.4±0.9 | |||||
| Quantiative Scoring (case/hemisphere) | Quantiative Scoring (case/hemisphere) | |||||||||||
| Meyers ‐ TH distance | Distance (mm) | Anterior Bundle | Seeding (points) | Termination (points) | Medial/ Posterior | Seeding (points) | Termination (points) | |||||
| Right | Left | Right | Left | Right | Left | Right | Left | Right | Left | |||
| case01 | −1 | −1 | case01 | 1 | 2 | 2 | 1 | case01 | 4 | 4 | 4 | 2 |
| case02 | −2 | −1 | case02 | 2 | 2 | 1 | 2 | case02 | 4 | 4 | 4 | 2 |
| case03 | 3 | 1 | case03 | 1 | 2 | 1 | 1 | case03 | 4 | 4 | 4 | 4 |
| case04 | −2 | 1 | case04 | 1 | 1 | 2 | 1 | case04 | 4 | 4 | 4 | 2 |
| case05 | 2 | 2 | case05 | 1 | 1 | 1 | 1 | case05 | 4 | 4 | 4 | 4 |
| case06 | −4 | 1 | case06 | 2 | 2 | 2 | 1 | case06 | 2 | 4 | 4 | 2 |
| case07 | −1 | 5 | case07 | 1 | 2 | 2 | 1 | case07 | 4 | 4 | 4 | 4 |
Quantitative (left) and qualitative (right) evaluation of 14 hemispheres. Quantitative values represent the distance (mm) from the anterior‐most point of Meyer's Loop to the anterior tip of the temporal horn. Positive values place Meyer's Loop anterior to the temporal horn. Qualitative scoring: the anterior bundle was awarded 0, 1, or 2 points for the seeding score and the same for termination. Values were doubled for the medial/posterior bundle(s). For seeding, tracts are awarded 0 if not seeded, 1 if they were seeded but included many gaps between fibers, and 2 if they formed a sheet‐like representation. For termination, tracts were awarded 0 if they terminated outside the occipital lobe; 1 if they terminated inside the occipital lobe, and 2 if they terminated in the occipital pole/calcarine cortex.
DISCUSSION
In the first sequence of analyses, multiple regions of white matter surrounding the LGN were found to seed streamlines consistent with the known course of the OpRs. Streamlines from key LGN ROI (LGN2, LGN3, and LGN5)—including a ROI used widely in the literature (LGN2)—seeded largely unique and complementary components of the radiations. Those from another (LGN4) demonstrated marked overlap with these. In line with both previous work and anatomically‐based predictions, the region of anterolaterally oriented diffusion (LGN2) inconsistently seeded the OpRs' anterior component (Meyer's Loop). In contrast, overlying voxels of mediolateral diffusion (LGN3 and LGN5), not typically seeded, tracked relatively medial and posterior components of the radiations. A final region seeded once in previous work [White and Zhang, 2010] generated streamlines overlapping with these and in some instances identified Meyer's Loop when it was not identified using LGN2 (e.g., Fig. 7, Case 3). These regions of the LGN were combined into a single ROI in a separate analysis, and tracts that touched relevant regions of the sagittal stratum were selected. The resulting streamlines were highly consistent with anatomical descriptions of the OpRs and in each instance included streamlines consistent with the radiations' most anterior component, Meyer's Loop.
Our choice of LGN regions for seeding was based on a clear anatomical rationale. Anatomically, the radiations form a sheet of fibers with distinct anterior, medial, and posterior components [e.g., Ebeling and Reulen, 1988; Rubino et al., 2005]. Selecting white matter seeds representing each of these components could thus be expected to reconstruct the OpR. To date, studies have largely focused on seeding voxels of white matter anterior [Taoka et al., 2008] or lateral [Bassi et al., 2008] to the LGN, anterolateral to posteromedially oriented diffusion in the region anterior and lateral to the LGN or in the presumed base of Meyer's Loop [Ciccarelli et al., 2003; Yogarajah et al., 2009], or in the LGN proper [Catani et al., 2003; Hofer et al., 2010] where low FA has been documented to make tracking difficult [Behrens et al., 2003]. Our data suggest that when regions of white matter directly bordering the LGN are considered separately with reference to the anatomy of the radiations, it is possible to independently identify different components of the OpR.
Perhaps the most important implication of this data is that widely used approaches to mapping the OpR do not appear to map all components of the OpR. This point is likely to have been overlooked to date as the main question asked of OpR tractography methods has been whether they can or cannot identify the OpR's most anterior extent; Meyer's Loop.
Methods seeding white matter anterior to the LGN, and particularly anterior white matter regions characterized by anteroposteriorly oriented diffusion, will likely miss the OpR's posterior and potentially medial components. Importantly these approaches will generate visually plausible tracts and typically still identify the most vulnerable component of the radiations in temporal surgery: the OpR's anterior and inferolateral boundaries. They will do so inconsistently, however, and will also underestimate the extent of the OpR's dorsal and medial boundaries [the more superior bundles in Fig. 4; Meyer, 1907]. These boundaries are particularly important in surgery targeting medial, occipital, and superior lateral (e.g., parietal) regions, or when disease‐related changes in properties across the radiations as a whole are considered. The significance of seeding the region of mediolaterally oriented diffusion bordering the LGN has been noted only once previously [White and Zhang, 2010], and the fact that this region can complement seeding of standard regions has not been appreciated.
Across the group, the anterior tip of Meyer's Loop fell 0.2 mm anterior (range −4 mm to +5 mm anterior) to a key proximal anatomical landmark, the temporal horn of the lateral ventricle. This landmark is a particularly significant one for the OpRs given its consistent relationship to the anterior radiations, which “plunge” down into the anterior temporal lobe [Meyer, 1907] while capping the temporal horn of the lateral ventricle. Ex vivo studies indicate that although Meyer's Loop's anterior extent may be posterior or anterior to this landmark in any individual case, at the group level it generally falls 3.3 mm (−5 to 10 mm) anterior to the tip of the lateral ventricle. The above value represents the average (mean weighted by sample size) from data published in Ebeling and Reulen [1998; mean = 5 ± 3.9 mm, range −5 to 10 mm, n = 25 hemispheres], Rubino et al. [2008; mean = 2 mm, range 1–3 mm, n = 20 hemispheres], Chowdhury and Khan [2006; mean = 2 mm, range 1.5–2.4 mm, n = 11 hemispheres], and Peuskens et al. [2012; range −4 to 6 mm, n = 17 hemispheres]. The validation analysis of the proposed method thus yielded results consistent with ex vivo data in all 14 hemispheres. As such, when combined with the demonstration that different regions surrounding the LGN seed complementary components of the radiations the current approach is an advance over existing methods. Wu et al. [2012] identified the anterior point of the radiations as substantially posterior to the anterior temporal horn in all patients (left: −8.69 ± 1.93 mm, range −11.1 to −7; right: −9.94 ± 2.63 mm, range −14.7 to −6.2), as did Nilsson et al. [2004; −16 mm, −21 to −8], whereas Yogarajah et al [2005] found the tracts (on average) at the temporal horn (mean 0 mm, range −15 to 9).
These results build on the work of White and Zhang [2009]. Here the region of mediolaterally oriented diffusion was seeded into the anterior temporal lobe. Their tractography data located Meyer's Loop on average −1 ± 2.2 mm (right) and 0.6 ± 2.5 mm (left) anterior to the temporal horn of the lateral ventricle. To validate their method White and Zhang presented eigenvector maps to argue this region constitutes Meyer's Loop. Such a form of validation is weak as the eigenvector maps are a representation of the same data from which the tractography is generated. Validation of the results is important as this region may represent either the anterior extent of Meyer's Loop, the posterior extent of the uncinate fasciculus, or other crossing fibers. We directly contrasted tracts seeded from this region with those generated from existing and well‐validated methods, and found substantial correspondence between these (Fig. 7). This adds further support for the argument that streamlines seeded from the region of mediolaterally oriented diffusion lateral to the LGN represent the OpR. The anatomy of the OpR reviewed in the introduction would suggest this region is where the fibers along the length of the radiations turn laterally before coursing to the occipital lobe.
The optimization of seeding strategy suggested could be further developed through standardizing and advancing other elements of tractography analysis. Jbabdi and Johansen‐Berg [2010] have described “three levels of methodology where details matter” in tractography; raw data acquisition; voxel‐wise modeling; and the tractography itself. Significant effort has been expended on optimizing the former two components in OpR tractography. In data acquisition, the influence of the number of motion probing gradients [Yamamoto et al., 2007] and slice angle at acquisition [Stieglitz et al., 2011] have been investigated, whereas in voxel‐wise modeling, single [Hofer et al., 2010; Taoka et al., 2008] and multiple tensor [Winston et al., 2011; Yogarajah et al., 2009] models of diffusion have been applied [see Jbabdi and Johansen‐Berg, 2011; Scherrer and Warfield, 2010, for a discussion of limitations in one and two tensor modeling]. To date, optimization of tractography and the selection of seed regions in particular has been treated as a variable of relatively little consequence [but see Stieglitz et al., 2011]. The current data suggest modifying the regions seeded in tractography can have a dramatic impact on output quality. In a clinical setting this may mean that it is possible to obtain comprehensive mapping of the radiations with standard clinical sequences (e.g., <10 min) and an optimized ROI strategy. Numerous other tractography variables (e.g., maximum tract angle, minimum FA) are yet to be comprehensively evaluated in a single, large sample.
The current data also underscores the difficulties inherent in validating tractography, and the importance of using multiple (quantitative or qualitative) metrics when evaluating and reporting results. It suggests that when the true course of patients' tracts is unknown the gold standard in evaluating tractography should be the presentation of (i) qualitative and (ii) quantitative metrics with (iii) visual presentation of the results. As shown in the introduction, such metrics are only useful to the extent that they are grounded in a sound knowledge of a structure's anatomy.
A limitation of the current approach is that the streamlines representing the radiations do not constitute a single, continuous “bundle” of streamlines. Why a break occurs in these streamlines in this study is unclear. This break between posterior and anterior sections of streamlines is also apparent in other DWI studies of the radiation [see e.g., Fig. 1A,D; Catani et al., 2003, p. 2097; Hofer et al., 2010, p. 5; Yamamoto et al., 2007, p. 94]. We also chose to use a single tensor model of diffusion data to mirror the constraints of a standard clinical setting, where software typically only allows for single tensor modeling (e.g., BrainLAB, http://www.brainlab.com/). Improved tracking may well be possible through the modeling of multiple fibers. Using the presented strategy to map the OpR should allow the benefit of such an approach to be effectively characterized.
A number of outstanding questions are apparent. A key goal in future work will be to validate OpR tractography against the known location of the OpR in ex vivo samples. Another will be to move beyond adult samples to evaluate our ability to map the OpR in a standard and reliable manner in children. The few studies in this population to date have been limited by small sample sizes (e.g. n = 4) [Sherbondy et al., 2008a], the integration of pediatric with adult cases [Chen et al., 2009], or a failure to evaluate the quality of Meyer's Loop tracking [Bassi et al., 2008]. This is particularly important given the marked differences between the brain in childhood and adulthood, particularly with respect to white matter structure. A further area of significant practical interest is the ability of the different combinations of modeling and tractography provided by different software packages in the tracking of the OpR [see discussion in Stieglitz et al., 2011]. We have clearly documented our analysis and tractography approach here to allow its reproduction using publicly available, validated software (http://crl.med.harvard.edu/). A further outstanding question relates to tractography's representation of the most posterior components of the OpRs, and the fibers that branch to lateral occipitotemporal regions in particular (see Fig. 3, left). Such streamlines are apparent in select examples of tractography in published studies [e.g., Fig. 2A above, Catani et al., 2003; Fig. 2A in Ciccarelli et al., 2005, p. 314; Fig. 2C in Yamamoto et al., 2007, p. 94]. In our experience such streamlines arise not infrequently from the OpR's most anterior component [see Fig. 2A above and Fig. 2C in Yamamoto et al., 2007, p. 94]. Such fibers do appear in dissected specimens of the radiations (Fig. 3, above), and functional magnetic resonance imaging has been used to map retinopically organized visual cortex in the region where these fibers terminate [Larsson and Heeger, 2006]. As such these streamlines are understood to represent a true anatomical connection.
CONCLUSIONS
In this article, we sought to identify an optimal strategy for seeding and selecting streamlines representing the OpR. We have shown that existing approaches map different components of the OpR, and that combining key seed regions allows optimal mapping of the OpR. We have further shown that to accurately evaluate OpR tractography it is critical that complementary (quantitative, qualitative, and visual) methods of data analysis and presentation are used, and that these must be based in a sound knowledge of white matter anatomy. A key goal in future work will be the difficult task of validating OpR tractography against the “ground truth”; the known location of these tracts in ex vivo samples.
Acknowledgments
The authors thank their participants for participating in this project.
REFERENCES
- Agrawal A, Kapfhammer J, Kress A, Wichers H, Deep A, Feindel W, Sonntag V, Spetzler R, Preul M. (2011): Josef Klingler's models of white matter tracts: influences on neuroanatomy, neurosurgery, and neuroimaging. Neurosurgery 69:238–252; discussion 252–254. [DOI] [PubMed] [Google Scholar]
- Barton J, Hefter R, Chang B, Schomer D, Drislane F. (2005): The field defects of anterior temporal lobectomy: A quantitative reassessment of Meyer's loop. Brain 128:2123–2133. [DOI] [PubMed] [Google Scholar]
- Bassi L, Ricci D, Volzone A, Allsop J, Srinivasan L, Pai A, Ribes C, Ramenghi L, Mercuri E, Mosca F, Edwards A, Cowan F, Rutherford M, Counsell S. (2008): Probabilistic diffusion tractography of the optic radiations and visual function in preterm infants at term equivalent age. Brain 131:573–582. [DOI] [PubMed] [Google Scholar]
- Behrens T, Johansen‐Berg H, Woolrich M, Smith S, Wheeler‐Kingshott C, Boulby P, Barker G, Sillery E, Sheehan K, Ciccarelli O, Thompson A, Brady J, Matthews P. (2003): Non‐invasive mapping of connections between human thalamus and cortex using diffusion imaging. Nat Neurosci 6:750–757. [DOI] [PubMed] [Google Scholar]
- Burgel U, Schormann T, Schleicher A, Zilles K. (1999): Mapping of histologically identified long fiber tracts in human cerebral hemispheres to the MRI volume of a reference brain: Position and spatial variability of the optic radiation. Neuroimage 10:489–499. [DOI] [PubMed] [Google Scholar]
- Catani M, Jones D, Donato R, Ffytche D. (2003): Occipito‐temporal connections in the human brain. Brain 126:2093–2107. [DOI] [PubMed] [Google Scholar]
- Chen X, Weigel D, Ganslandt O, Buchfelder M, Nimsky C. (2009): Prediction of visual field deficits by diffusion tensor imaging in temporal lobe epilepsy surgery. Neuroimage 45:286–297. [DOI] [PubMed] [Google Scholar]
- Choi C, Rubino PA, Fernandez‐Miranda JC, Abe H, Rhoton AL Jr. (2006): Meyer's loop and the optic radiations in the transsylvian approach to the mediobasal temporal lobe. Neurosurgery 59:ONS. [DOI] [PubMed] [Google Scholar]
- Chowdhury F, Khan AH. (2010): Anterior & lateral extension of optic radiation & safety of amygdalohippocampectomy through middle temporal gyrus: A cadaveric study of 11 cerebral hemispheres. Asian J Neurosurg 5:78. [PMC free article] [PubMed] [Google Scholar]
- Ciccarelli O, Parker GJM, Toosy AT, Wheeler‐Kingshott CAM, Barker GJ, Boulby PA, Miller DH, Thompson AJ. (2003): From diffusion tractography to quantitative white matter tract measures: A reproducibility study. Neuroimage 18:348–359. [DOI] [PubMed] [Google Scholar]
- Ciccarelli O, Toosy A, Hickman S, Parker G, Wheeler‐Kingshott C, Miller D, Thompson A. (2005): Optic radiation changes after optic neuritis detected by tractography‐based group mapping. Hum Brain Mapp 25:308–316. [DOI] [PMC free article] [PubMed] [Google Scholar]
- Duncan JS. (2010): Imaging in the surgical treatment of epilepsy. Nature reviews. Neurology 6:537–550. [DOI] [PubMed] [Google Scholar]
- Ebeling U, Reulen H. (1988): Neurosurgical topography of the optic radiation in the temporal lobe. Acta Neurochir (Wien) 92:29–36. [DOI] [PubMed] [Google Scholar]
- Falconer M, Serafetinides E. (1963): A follow‐up study of surgery in temporal lobe epilepsy. J Neurol Neurosurg Psychiatry 26:154–165. [DOI] [PMC free article] [PubMed] [Google Scholar]
- Falconer MA, Wilson JL. (1958): Visual field changes following anterior temporal lobectomy: Their significance in relation to Meyer's loop of the optic radiation. Brain 81:1–14. [DOI] [PubMed] [Google Scholar]
- Grau V, Mewes AU, Alcaniz M, Kikinis R, Warfield SK. (2004): Improved watershed transform for medical image segmentation using prior information. IEEE Trans Med Imaging 23:447–458. [DOI] [PubMed] [Google Scholar]
- Hofer S, Karaus A, Frahm J. (2010): Reconstruction and dissection of the entire human visual pathway using diffusion tensor MRI. Front Neuroanat 4:15. [DOI] [PMC free article] [PubMed] [Google Scholar]
- Jbabdi S, Johansen‐Berg H. (2011): Tractography: Where do we go from here? Brain Connect 1:169–183. [DOI] [PMC free article] [PubMed] [Google Scholar]
- Jones RD, Tranel D. (2002): Visual disorders In: Ramachandran VS, editor.Encyclopedia of the Human Brain.New York:Academic Press: pp775–789. [Google Scholar]
- Kamada K, Todo T, Morita A, Masutani Y, Aoki S, Ino K, Kawai K, Kirino T. (2005): Functional monitoring for visual pathway using real‐time visual evoked potentials and optic‐radiation tractography. Neurosurgery 57:121–127. [DOI] [PubMed] [Google Scholar]
- Larsson J, Heeger D. (2006): Two retinotopic visual areas in human lateral occipital cortex. J Neurosci 26:13128–13142. [DOI] [PMC free article] [PubMed] [Google Scholar]
- Levin A (2008): Topical diagnosis of chiasmal and retrochiasmal lesions In: Miller NR, Newman N, Biousse V, Kerrison JB, editors.Walsh and Hoyt's Clinical Neuro‐ophthalmology: The Essentials.US:Lippincott Williams & Wilkins. [Google Scholar]
- Lewis W, Sahin M, Scherrer B, Peters JM, Suarez R, Vogel‐Farley VK, Jeste SS, Gregas MC, Prabhu SP, Nelson CA, Warfield SK. (2012): Impaired language pathways in tuberous sclerosis complex patients with autism spectrum disorders. Cereb Cortex. [DOI] [PMC free article] [PubMed] [Google Scholar]
- Meyer A. (1907): The connections of the occipital lobes and the present status of the cerebral visual affections. Trans Assoc Am Physicians 22:7–16. [Google Scholar]
- Munoz SR, Bangdiwala SI. (1997): Interpretation of Kappa and B statistics measures of agreement. J Appl Stat 24:105–112. [Google Scholar]
- Nilsson D, Malmgren K, Rydenhag B, Frisen L. (2004): Visual field defects after temporal lobectomy—Comparing methods and analysing resection size. Acta Neurol Scand 110:301–307. [DOI] [PubMed] [Google Scholar]
- Nilsson D, Starck G, Ljungberg M, Ribbelin S, Jönsson L, Malmgren K, Rydenhag B. (2007): Intersubject variability in the anterior extent of the optic radiation assessed by tractography. Epilepsy Res 77:11–16. [DOI] [PubMed] [Google Scholar]
- Peltier J, Travers N, Destrieux C, Velut S. (2006): Optic radiations: A microsurgical anatomical study. J Neurosurg 105:294–300. [DOI] [PubMed] [Google Scholar]
- Peters JM, Sahin M, Vogel‐Farley VK, Jeste SS, Nelson CA, Gregas MC, Prabhu SP, Scherrer B, Warfield SK. (2012): Loss of white matter microstructural integrity is associated with adverse neurological outcome in tuberous sclerosis complex. Acad Radiol 19:17–25. [DOI] [PMC free article] [PubMed] [Google Scholar]
- Peuskens D, van L, Johannes, Van C, Frank, van dB, Raymond, Goffin J, Plets C. (2004): Anatomy of the anterior temporal lobe and the frontotemporal region demonstrated by fiber dissection. Neurosurgery 55:1174–1184. [DOI] [PubMed] [Google Scholar]
- Pujari VB, Jimbo H, Dange N, Shah A, Singh S, Goel A. (2008): Fiber dissection of the visual pathways: Analysis of the relationship of optic radiations to lateral ventricle: A cadaveric study. Neurol India 56:133. [DOI] [PubMed] [Google Scholar]
- Rubino PA, Rhoton AL, Tong X, de Evandro O. (2005): Three‐dimensional relationships of the optic radiation. Neurosurgery 57:219–227. [DOI] [PubMed] [Google Scholar]
- Sherbondy A, Dougherty R, Ben‐Shachar M, Napel S, Wandell B. (2008a): ConTrack: Finding the most likely pathways between brain regions using diffusion tractography. J Vis 8:15.1–16. [DOI] [PMC free article] [PubMed] [Google Scholar]
- Sherbondy A, Dougherty R, Napel S, Wandell B. (2008b): Identifying the human optic radiation using diffusion imaging and fiber tractography. J Vis 8:12.1–11. [DOI] [PMC free article] [PubMed] [Google Scholar]
- Sincoff EH, Tan Y, Abdulrauf SI. (2004): White matter fiber dissection of the optic radiations of the temporal lobe and implications for surgical approaches to the temporal horn. J Neurosurg 101:739–746. [DOI] [PubMed] [Google Scholar]
- Stieglitz L, Ludemann W, Giordano M, Raabe A, Fahlbusch R, Samii M. (2011): Optic radiation fiber tracking using anteriorly angulated diffusion tensor imaging: A tested algorithm for quick application. Neurosurgery. [DOI] [PubMed] [Google Scholar]
- Suarez R, Commowick O, Prabhu S, Warfield S. (2012): Automated delineation of white matter fiber tracts with a multiple region‐of‐interest approach. Neuroimage 59:3690–3700. [DOI] [PMC free article] [PubMed] [Google Scholar]
- Taoka T, Sakamoto M, Nakagawa H, Nakase H, Iwasaki S, Takayama K, Taoka K, Hoshida T, Sakaki T, Kichikawa K. (2008): Diffusion tensor tractography of the Meyer loop in cases of temporal lobe resection for temporal lobe epilepsy: Correlation between postsurgical visual field defect and anterior limit of Meyer loop on tractography. AJNR Am J Neuroradiol 29:1329–1334. [DOI] [PMC free article] [PubMed] [Google Scholar]
- Weisenfeld NI, Warfield SK. (2009): Automatic segmentation of newborn brain MRI. Neuroimage 47:564–572. [DOI] [PMC free article] [PubMed] [Google Scholar]
- White ML, Zhang Y. (2010): Three‐tesla diffusion tensor imaging of Meyer's loop by tractography, color‐coded fractional anisotropy maps, and eigenvectors. Clin Imaging 34:413–417. [DOI] [PubMed] [Google Scholar]
- Winston G, Yogarajah M, Symms M, McEvoy A, Micallef C, Duncan J. (2011): Diffusion tensor imaging tractography to visualize the relationship of the optic radiation to epileptogenic lesions prior to neurosurgery. Epilepsia 52:1430–1438. [DOI] [PMC free article] [PubMed] [Google Scholar]
- Winston GP, Daga P, Stretton J, Modat M, Symms MR, McEvoy AW, Ourselin S, Duncan JS. (2012): Optic radiation tractography and vision in anterior temporal lobe resection. Ann Neurol 71:334–341. [DOI] [PMC free article] [PubMed] [Google Scholar]
- Wu W, Rigolo L, O'Donnell LJ, Norton I, Shriver S, Golby AJ. (2012): Visual pathway study using in vivo diffusion tensor imaging tractography to complement classic anatomy. Neurosurgery 70:ons145. [DOI] [PMC free article] [PubMed] [Google Scholar]
- Yamamoto A, Miki Y, Urayama S, Fushimi Y, Okada T, Hanakawa T, Fukuyama H, Togashi K. (2007): Diffusion tensor fiber tractography of the optic radiation: Analysis with 6‐, 12‐, 40‐, and 81‐directional motion‐probing gradients, a preliminary study. AJNR Am J Neuroradiol 28:92–96. [PMC free article] [PubMed] [Google Scholar]
- Yamamoto T, Yamada K, Nishimura T, Kinoshita S. (2005): Tractography to depict three layers of visual field trajectories to the calcarine gyri. Am J Ophthalmol 140:781–785. [DOI] [PubMed] [Google Scholar]
- Yogarajah M, Focke N, Bonelli S, Cercignani M, Acheson J, Parker G, Alexander D, McEvoy A, Symms M, Koepp M, Duncan J. (2009): Defining Meyer's loop‐temporal lobe resections, visual field deficits and diffusion tensor tractography. Brain 132:1656–1668. [DOI] [PMC free article] [PubMed] [Google Scholar]
- Yoshida M, Ida M, Nguyen T, Iba‐Zizen M, Bellinger L, Stievenart J, Nagao T, Kikuchi S, Hara T, Shiba T, et al. (2006): Resolution of homonymous visual field loss documented with functional magnetic resonance and diffusion tensor imaging. J Neuroophthalmol 26:11–17. [DOI] [PubMed] [Google Scholar]