Abstract
The growth inhibition of dividing cells and most of the transcriptional responses upon TGF-beta treatment depend on the Smad2, Smad3, and Smad4 transcription factors. These proteins shuttle continuously between the cytoplasm and the nucleus, transmitting the ligand status of the TGF-beta receptors to the nuclear transcription machinery. In the absence of TGF-beta ligand, Smads 2/3/4 reside predominantly in the cytoplasm. Following ligand binding to the TGF-beta receptors, the dynamic equilibrium of shuttling Smads 2/3/4 shifts towards a predominantly nuclear state, where a high concentration of these transcription factors drives transcriptional activation and repression of genes required for proper cellular response. Here, we describe live-cell imaging and immunofluorescence microscopy methods for tracking Smads subcellular localization in response to TGF-beta and leptomycin B treatment. In addition, a method of fractionating nuclear and cytoplasmic proteins used to confirm the imaging results was presented. Our results support the notion that the R-Smad shuttling mechanism is distinct from Co-Smad.
Keywords: TGF-beta, SMAD4, SMAD2, Nuclear Accumulation, Cellular Fractionation, Immunofluorescence, Leptomycin B
1. Introduction
Transforming Growth Factor Beta (TGF-beta) is a cytokine that can cause several distinct cellular responses, including growth inhibition, apoptosis, and differentiation (For Review (1)).The active form of the TGF-beta ligand binds as a dimer to the TGF-beta receptors on the plasma membrane of target cells, thus carrying a signal from one cell to another (For Review on ligand-receptor interactions:(2)). Type I and Type II TGF-beta receptors (TBRI and TBRII, respectively) are serine/threonine kinases that transmit the signal across the plasma membrane (1). TGF-beta binding to TBRII induces heterooligomerization of TBRII with TBRI (1). The receptor oligomerization initiates a protein phosphorylation cascade, eventually propagating the signal into the nucleus. This cascade begins when TBRII phosphorylates TBRI, resulting in activation of TBRI’s kinase activity (1). Active TBRI then phosphorylates receptor regulated Smad proteins also known as R-Smads (Smad2 and Smad3) (3). These phosphorylated Smad2/3 proteins homo-oligomerize into protein complexes, as well as hetero-oligomerize with Smad4 or Co-Smad (4, 5). Oligomerization of Smads 2/3/4 correlates with nuclear accumulation of these proteins (6). Smads 2/3/4 are transcription factors that activate the transcription of p21 and p15, which cause cell cycle arrest in the G1 phase of the cell cycle, as well as repress transcription of growth promoting genes such as c-myc and CDC25A (1). It is through transcriptional regulation of these genes, and possibly others yet to be identified, that Smad nuclear accumulation leads to cytostatic responses.
Nucleocytoplasmic shuttling of signaling proteins is a common theme shared by many cellular signaling pathways. Smads are constantly cycling in and out of nucleus even in the absence of ligand stimulation (7, 8). The Smad nuclear export rates exceed their import rates in the basal state consequently both Smad2/Smad3 and Smad4 are predominantly localized to the cytosol (9, 10). Ligand stimulation decreases the export rates of Smad4 without significantly affecting the import rates resulting in nuclear accumulation of Smad4 (10). Similar mechanism may also account for R-Smad nuclear accumulation although nuclear import and export mechanism of R-Smad and Smad4 appears to be distinct. Earlier studies have shown that Smad3 but not Smad2 or Smad4 can directly interact with importin β1 and interaction may be important for nuclear translocation of Smad3 (11-13). Subsequent studies suggest that nuclear import of Smad2 and Smad3 can also occur through direct binding of Smad2/3 to nucleoporins Nup214 and Nup153 (8). Thus, both importin β-dependent and importin β-independent pathways are involved in trafficking R-Smad into nucleus. For shuttling R-Smad out of the nucleus, exportin 4 has been implicated as the export factor for Smad3 and most likely for Smad2 as well (14). Unlike R-Smad, nuclear import of Smad4 likely relies on importin 7/8 or importin alpha (13, 15) while Smad4 nuclear export occurs by binding to the nuclear export factor CRM1 as treatment of the specific small molecule inhibitor Leptomycin B (LMB), which targets CRM1, is sufficient to drive nuclear accumulation of Smad4 but not Smad2 or Smad3 (16-18). Two nuclear export signals have been identified in Smad4 and mutation of these signals causes Smad4 to exclusively localize to nucleus (12, 16, 17). Despite all these advances, a number of outstanding questions still remain unanswered. For example, how is the phosphorylated R-Smad induced by TGF-beta treatment translocated to the nucleus? Is the import rate for the phosphorylated Smad2/3 higher than the unphosphorylated Smad2/3? How Smad homo- or heteroligomerization regulates Smad nuclear accumulation? Can the rate of Smad import or export be re-adjusted intrinsically or in response to signaling cross-talk? Here we described some of the key methods that can be used to determine the trafficking mechanisms of Smad in the mammalian system.
2. Materials
2.1 Cell Culture
Dulbecco’s Modified Eagle Medium (DMEM) (GIBCO, Invitrogen 10313-039)
DMEM lacking phenol red (GIBCO, Invitrogen 31053-036)
GlutaMAX L-Glutamine Supplement (GIBCO, Invitrogen 35050-061)
Dulbecco’s Phosphate Buffered Saline (D-PBS) (GIBCO, Invitrogen 14190-136)
100 X Penicillin G Solution (Solid Penicillin G from Sigma in distilled water to 10,000 U/ml)
Streptamycin Sulfate solution (Solid streptomycin sulfate from Sigma in distilled water to 10,000 U/ml)
2.2 Live Cell Treatment
Leptomycin B, 500 μg in Absolute Ethanol (LC Laboratories L-6100)
Transforming Growth Factor Beta1 (TGF-beta1) (R and D Systems 240-B-010)
2.3 Cellular Fractionation
Hypotonic Lysis Buffer (10 mM Tris Base HCL, 10 mM KCl, 1.5 mM MgCl2, 1 mM Sodium Orthovanadate, 0.2 mM phenylmethanesulphonylfluoride, 1mM DTT)
RIPA buffer (150 mM NaCl, 1 % v/v Triton X 100, 1 % w/v sodium deoxycholic acid, 0.1 % w/v sodium dodecyl sulfate, 25 mM Tris Base HCL, 1 mM ethylenediaminetetraacetic acid, 0.2 mM phenylmethanesulphonylfluoride, 1 mM Sodium Orthovanadate, 1 mM DTT, 25 mM B-glycerophosphate, 25 mM NaF)
Salt Balancing Solution (10 % v/v Triton X 100, 1 M NaCl, 100 mM B-glycerophosphate, 100 mM NaF)
Cell Lifter (Costar, Corning 3008)
Dounce Homogenizer with 1 ml volume (Wheaton)
Ponceau S Staining Solution (0.5 g Ponceau S Dye, 5 % Glacial Acetic Acid to 100 ml with deionized water)
Protogel 30 % Acrylamide/Bisacrylamide Solution (National Diagnostics, EC-890)
Protogel 4 X Resolving Gel Buffer (National Diagnostics, EC-892)
Protogel Stacking Gel Buffer (National Diagnostics, EC-893)
10 % Sodium Dodecyl Sulfate Solution (10% w/v SDS in distilled water)
Mouse anti-Smad1/2/3 antibody (Santa Cruz Biotechnology SC-7960)
Mouse anti-Lamin A/C antibody (Santa Cruz Biotechnology SC-7292)
Mouse anti-betaActin antibody (AbCam Ab8226)
Horse Radish Peroxidase conjugated Sheep anti-mouse antibody (GE Healthcare NA931-1ML)
SuperSignal West Dura Extended Duration Substrate chemiluminesence kit (Pierce Biotechnology 34076)
Protran Nitrocellulose Membrane (Whatman 104024 BA83)
Whatman Chromatography Paper (Whatman 3030-917)
Semi-dry transfer apparatus (Hoefer TE70)
BCA protein assay kit (Thermo 23225)
Spectra broad ranged multicolor protein ladder (Fermentas SM184)
Powerwave X Scanning Spectrophotometer Plate Reader (Bio-Tek)
4 X SDS-Gel Loading Buffer (to Make 10 ml: 8 mg Bromophenol Blue, 1 ml 0.5 M EDTA, 40 mM DTT, 4 ml 100% glycerol, 0.8 g SDS, 2 mL 1 M Tris Base pH 6.8, to 10 ml with deionized water)
Transfer Buffer (5.8 g Glycine, 11.6 g Tris Base, 0.72 g Sodium Dodecyl Sulfate, 400 ml Methanol, to 2 L with deionized water)
Tris Buffered Saline supplemented with Tween-20 detergent (TBS-t) (8.8 g NaCl, 0.2 g KCl, 3 g Tris Base, 1 ml Tween 20, pH 7.4 to 1L with deionized water)
Western Blot Film (ISC BioExpress F-9023-8X10)
2.4 Immunofluorescence
Poly-D-Lysine Hydrobromide Solution (1 mg/ml Poly-D-Lysine Hydrobromide (Sigma P7405-5MG), 23.5 mM Sodium Tetraborate, 50 mM Boric Acid, pH to 8.5)
Round Glass Coverslips (Fisherbrand 12-546 18CIR-2)
Glass Slides (VWR 48312-003)
Rabbit anti-Smad2 antibody (Zymed Laboratories 51-1300)
Mouse anti-Smad4 antibody (Santa Cruz Biotechnology SC 7966)
Goat anti-Mouse Alexafluor488 conjugated antibody (Molecular Probes, Invitrogen A11001)
Goat anti-Rabbit AlexaFluor555 conjugated antibody (Molecular Probes, Invitrogen A21428)
Normal Goat Serum (Invitrogen PCN5000)
3.7 % Paraformaldehyde solution (Made from dilution of 16 % solution in deionized water, Electron Microscopy Sciences 15710)
10 mg/ml Hoescht 33258 Solution in deionized water (made from solid, Invitrogen H21491)
Clear Nail Polish (Sally Hansen ‘Hard as Nails’ 2103)
Nikon ECLIPSE TE2000 Inverted Fluorescence Microscope equipped with the following; excitation filters: 360/40 Hoescht 55258, 490/20 AlexaFluor488, 555/28 AlexaFluor555, 470/30 GFP, 492/18 YFP. Emission Filters: 457/50 Hoescht 33258, 528/38 AlexaFluor488, 617/73 AlexaFluor555, 510/30 GFP, 535/30 YFP. Camera: COOLSNAP ES. Software: Metamorph Premier Imaging System.
2.5 Live Cell Imaging
GFP-Smad4 HaCaT Cells was created by retroviral mediated gene transfer. Briefly, pMX-GFP-Smad4, a retroviral expression vector described previously (18), was transfected into the amphotrophic packaging cell line φNX 293T cells using Mirus (Mirus Bio, Madison, WI). Infection and selection of GFP positive stable cell lines using FACS sorting were performed as described (19). Similar procedure was used to create YFP-Smad2 HaCaT Cells except the expression vector used was pREX-YFP-Smad2-IRES-Hygromycin.
Glass Bottom 35 mm Petridishes (Mat Tek Corporation P35G-0-7-C)
3. Methods
3.1 Cellular fractionation of cytoplasm and nuclear proteins
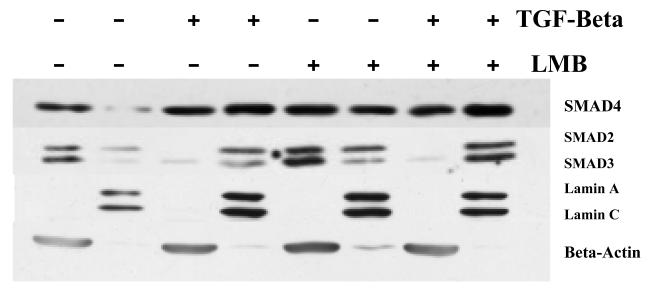
Using the methods of cellular fractionation and western blot analysis, we find that both TGF-beta and Leptomycin B treatment of cells is sufficient to increase the fraction of total cellular Smad4 protein located in the nucleus. This is not observed to be the case for either Smad2 or Smad3, where only TGF-beta treatment was sufficient to increase the fraction of total cellular Smad2/3 protein in the nucleus (Figure 1).
4 × 10 cm tissue culture Petri dishes were seeded with 10 ml and 2 × 10⁶ adherent HaCaT cells and allowed to grow for 24 hours at 37 °C in a 5 % CO2 atmosphere (See Note 1) Two plates were treated for 30 minutes with 20 ng/ml LMB prior to addition of 100 pM TGF-beta1 to one of these plates and to one of two plates not treated with LMB. Cells were treated with TGF-beta1 for one hour. Total volume of media in all plates is 10 ml.
Each 10 cm plate containing 2 × 10⁶ adherent HaCaT cells are rinsed (See Note 2) one time with 10 ml 4 °C Dulbecco’s Phosphate Buffered Saline (D-PBS). D-PBS is removed by titling the plate vertically at an 80 degree angle in a bucket full with ice for one minute and aspirating all liquid from the bottom corner of the plate using a vacuum trap and a glass Pasteur pipette. 10 ml of 4 °C hypotonic lysis buffer is then added to the plate, which is then incubated horizontally on ice for 15 minutes. During this incubation, cells will swell, providing an easier lysis in the following steps (See Note 3) All hypotonic lysis buffer is removed in the same manner as stated above. 70 μl of 4 °C hypotonic lysis buffer supplemented with 0.4 % TX100 is added to each plate. With the plate tilted at an 80 degree angle in a bucket of ice, cells are scraped using a cell lifter, and all cells are pushed towards the pooling liquid in the bottom end of the tilted plate.
Scraped cells in lysis buffer are briefly homogenized by pipetting up and down the pooled liquid in the plate, being careful not to introduce air bubbles (See Note 4). The mixture of buffer and cells is then transferred to a 1.7 ml Eppendorf tube on ice, and incubated at 4 °C for 15 minutes.
Using a 200 μl pipette, cells are further homogenized by pipetting up and down without introducing air bubbles. Cells and buffer are transferred to a clean 4 °C 1 ml Dounce homogenizer, and the ‘loose fit’ plunger is raised and lowered 60 times. The plunger is removed and the liquid is allowed to collect in the bottom of the homogenizer for 30 seconds. 1-2 μl of liquid homogenate is removed, and placed on a microscope slide and a cover-slip is applied to prevent evaporation. The homogenate is confirmed to be composed of nuclei, which look wrinkled oval and dark, and debris, which is the result of plasma membrane breakage. There should be no presence of in-tact cells at this point. However, if there are still 5-10 % unbroken cells one may apply the plunger again and homogenize the cells 40-60 more times before proceeding to step 5 (See Notes 5 and 6)
Homogenate is transferred to a fresh 4 °C 1.7 ml eppendorf tube and spun for 5 minutes at 800 rcf and 4 °C. A small pellet forms at the end of the tube, and the supernatant contains plasma membrane components and cytoplasm contents. Most of the supernatant is removed by pipetting and labeled as cytoplasmic fraction, and care is taken not to disturb the pellet (See Note 7). Cytoplasmic fractions are balanced for salt, detergent, and phosphatase inhibitors by addition of 20 μl salt balancing buffer.
The last bit of supernatant is removed and discarded. The nuclear pellet is rinsed one time by addition of 100 μl of 4 °C hypotonic buffer lacking 0.4 % TX100. The tube containing hypotonic wash buffer and nuclei is then spun for 5 minutes at 800 rcf and 4 °C (See Note 8). All liquid contents of the tube are removed by aspiration, being careful not to disturb the pellet or to scrape the inner walls of the tube. The nuclei are then lysed completely by addition of 70 μl of RIPA buffer followed by gentle flicking and inverting of the tube. These tubes are then labeled as nuclear fractions.
Cytoplasmic and nuclear fractions are rotated for 45 minutes at 4 °C.
Fractions are then spun for 10 minutes at 13,200 rcf and 4 °C. Supernatants are transferred to new labeled tubes and stored on ice (See Note 9).
Figure 1.
Determining the effect of LMB on the relative amounts of Smad2/3/4 in the cytoplasm and the nucleus. HaCaT cells were treated with and without 100 pM TGF-beta1 for one hour. This experiment was repeated with treatment of 20 ng/ml LMB, where LMB was applied 30 minutes prior to addition of TGF-beta. Cells were fractionated into cytoplasm and nuclear fractions and western blotted to determine the relative amounts of Smad2/3/4. Lamin A/C and Beta-actin were used as both loading controls and indicators of the purity of fractions.
3.2 Determining Protein Concentration and Performing Western Blot Analysis
Protein concentration is determined using a BCA assay kit, according to the manufacturer’s instructions. Briefly, serial dilutions of 2.0 mg/ml Bovine Serum Albumin (BSA) stock solution in a 1:10 dilution of RIPA solution:distilled water are made to produce 1.0 mg/ml, 0.5 mg/ml, 0.25 mg/ml standards, while a blank is made from 1:10 dilution of RIPA solution:distilled water alone. A 2 μl aliquot of each fraction is removed to make a 1:10 dilution of each unknown sample in distilled water, yielding a total of 20 μl of diluted unknown sample.
5 μl of each unknown and each standard are mixed with 100 μl of 1 X BCA Solution (50:1 mixture of solutions A and B, from the BCA kit), each in 1 well of a clear 96 well polyethylene plate. Plates are completely sealed to prevent evaporation using parafilm tape, and incubated at 37 °C for 30 minutes.
The 96 well plate is read at 562 nm for absorbance using a 96 well plate scanning spectrophotometer. Using Excel, a spreadsheet is constructed to determine the mathematical relationship of BSA concentration to absorbance for the standards, and this relationship is used to determine the concentration of the proteins in each unknown sample. The total yield in the cytoplasmic fraction is 150 μg in 100 μl, while the total yield in the nuclear fraction is 100 μg in 75 μl.
For each cytoplasmic fraction, 50 μg of total protein is prepared for loading into a single well, while 33.3 μg of total protein is prepared for loading into a single well for nuclear fractions (See Note 10). Each sample for loading into an SDS-PAGE gel is mixed with 7 μl of 4 X SDS-loading buffer and incubated at 95 °C for 5 minutes. Tubes are inverted and liquid contents are briefly spun at 5000 rcf for 30 seconds. In this experiment, 2 identical sample sets are used to make two identical gels.
A 1.5 mm, 12 % polyacrylamide mini-gel polymerized with a 10 well comb (manufactured using SDS-PAGE Protogel reagents from National Diagnostics according to the manufacturer’s instruction) is loaded with samples and 5 μl Spectra protein ladder (Fermentas) and 10 μl of SDS-loading buffer is added to any spare/empty wells prior to application of current. Each gel is run for 1 hour at 35 mA (190 V), at which time the bromophenol blue dye in the SDS-loading buffer runs just out of the bottom of the gel.
Each gel is transferred in a semi dry western blot horizontal transfer unit, using a sandwich from cathode (bottom piece) to anode (top piece) with the following scheme: 3 pieces of chromatography paper, 1 piece of nitrocellulose paper, SDS-PAGE gel containing samples, 3 pieces of chromatography paper. This sandwich is assembled under 50 ml of transfer buffer, and removed as a sandwich and placed in the transfer apparatus such that the gel is above the membrane, as proteins will be deposited on the nitrocellulose membrane as they move down towards the cathode. The sandwich is then lightly ironed with a 10 ml glass test tube to ensure no air bubbles are trapped between the membrane and the gel. For each sandwich containing one gel, for 1.5 hours at 45 mA or 7 V is applied to the apparatus, which is assembled as indicated by the manufacturer.
Nitrocellulose paper is removed from the apparatus following transfer of proteins, and stained with 10 ml of Ponceau S Staining solution at room temperature for 1 minute. Staining solution is removed and the membrane is rinsed 5 times with 20 ml of distilled water to remove non-specific Ponceau S stain. Each cytoplasmic lane should have even and bright red staining. In contrast, far less staining should be present for each nuclear sample. At this point, one can make a reasonable assessment of the purity of the nuclear fractions by seeing whether abundant protein bands in the cytoplamic fraction lanes are shared in the nuclear fraction lanes.
Each membrane is blocked with 10 ml of 3 % (w/v) non-fat dry milk in TBS-t at room temperature for 45 minutes.
Blocking buffer is completely removed and discarded prior to the addition of 5 ml of 1:500 mouse anti-Smad1/2/3 in 3 % (w/v) non-fat dry milk in TBS-t to one membrane, while another solution of 1:1000 mouse anti-Smad4 in 3 % (w/v) nonfat dry milk in TBS-t is added to the other membrane.
Each blot is incubated with primary antibody solution for 3 hours at room temperature, on a table top rocker.
Membranes are washed 2 times for 2 minutes with 10 ml of TBS-t.
Each membrane is then incubated with 3 ml of 1:2000 anti-mouse HRP conjugated secondary antibody solution in 3 % (w/v) non-fat dry milk in TBS-t for 50 minutes at room temperature on a table top rocker.
Each membrane is rinsed with 10 ml of TBS-t, and subsequently washed three times with 15 ml of TBS-t for 8 minutes each wash.
Membranes are removed from wash buffer and allowed to drip for 10 seconds before being laid protein side up on a piece of clear plastic(SARAN wrap is sufficient, or a cut three-ringed binder sheet protector). To each membrane is added 200 μl of West Dura solution (a mixture of 100 μl solution A and 100 μl solution B) and lightly tilted in several directions, by hand, to ensure that this 200 μl of solution covers the entire membrane. Another clear plastic sheet is laid over the protein side up membrane, creating a sandwich of two plastic pieces around the membrane, which is allow to sit for 30 seconds prior to ironing out excess liquid from inside the sandwich with a paper towel.
Plastic/membrane sandwiches are then taped to the inside of an imaging cassette, and exposed with x-ray developing film in a dark room for 15 seconds, 30 seconds, 1 minute and 5 minutes to produce varied exposures of the protein bands. Film is then developed using an automatic film developer.
This process from step 9 to step 15 is repeated with a 1:1000 dilution of mouse anti-Lamin A/C for one membrane, and a 1:1000 dilution of mouse anti-betaActin for the other membrane. Both antibody dilutions are made in 5 ml of 3 % (w/v) non-fat dry milk in TBS-t.
3.3 Immunofluorescence Detection of Smad2 and Smad4
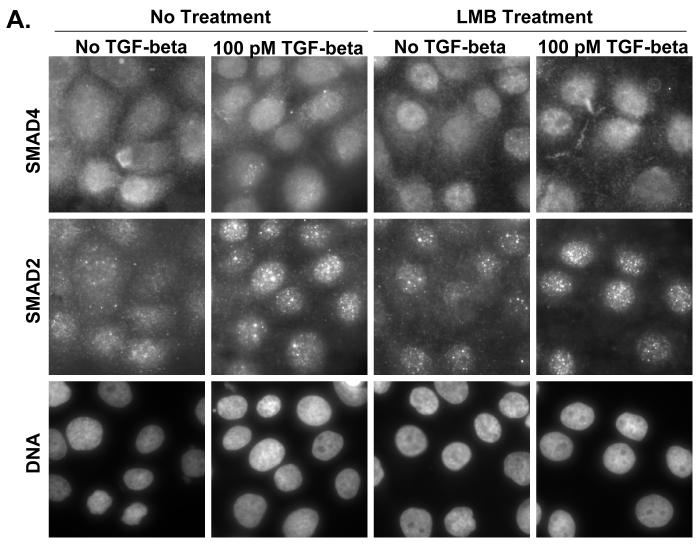
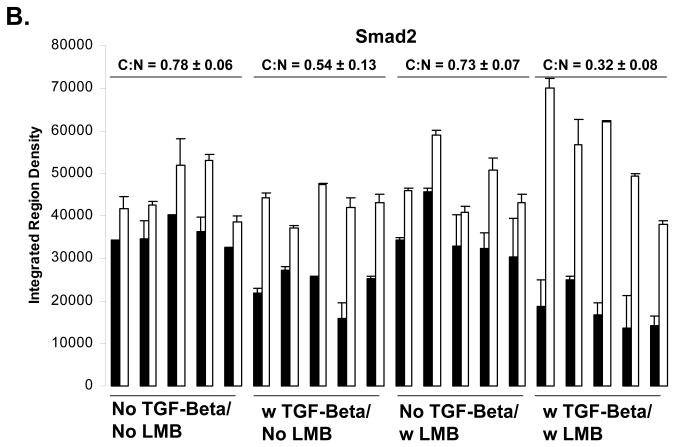
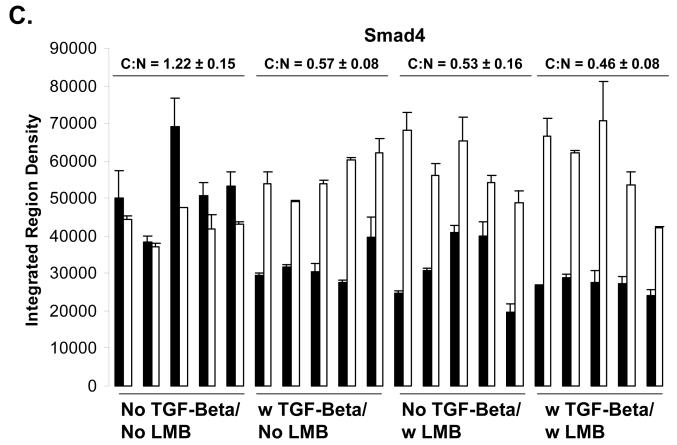
Using immunolfuorescent image analysis, we find that the ratio of cytoplasmic Smad4 to nuclear Smad4 (C:N) is 1.22 ± 0.15 in the basal state, 0.57 ± 0.08 when treated with TGF-beta, 0.53 ± 0.16 when treated with LMB, and 0.46 ± 0.08 when treated with both TGF-beta and LMB. Thus, either LMB or TGF-beta treatment is sufficient to drive the Smad4 from mostly cytoplasmic (C:N>1) to mostly nuclear (C:N<1)(Figure 2 A and C). This was not observed to be case for Smad2, where the ratio of cytoplasmic Smad2 to nuclear Smad2 (C:N) is 0.78 ± 0.06 in the basal state, 0.54 ± 0.12 when treated with TGF-beta, 0.73 ± 0.07 when treated with LMB, and 0.32 ± 0.08 when treated with both TGF-beta and LMB (Figure 2 A and B). We hypothesize that to cause for the C:N < 1 in the absence of both TGF-beta and LMB is due to high nuclear background of the anti-Smad2 antibody used for immunofluorescent staining.
4 X round coverslips are placed one in each well of 4 wells in a 12 well plate tissue culture plate. To each well is added 1 ml of room temperature 1 mg/ml Poly-D-lysine hydrobromide solution, and incubated 1 hr in the dark. Poly-D-lyisne Solution is removed and reused up to 10 times or before 2 months if stored at -80 C. Each well is washed with 1 ml of distilled water, and allowed to air dry in a sterile cell culture hood, with the UV light on. After 1 hr, 200,000 cells are added to each well in 1 ml of DMEM supplemented with 10 % FBS, 1 X Penecillin G/Streptomycin Sulfate Solution, 1 X L-Glutamine Solution (See Materials). Cells are allowed to adhere to the coverslips and grow for 24 hours at 37 °C in a 5 % CO2 atmosphere.
One well is untreated, and media is exchange with fresh pre-warmed media. In two other wells, LMB is added at a final concentration of 20 ng/ml for 30 minutes prior to addition of TGF-beta1 at a final concentration of 100 pM to one of these wells and the remaining fourth well. TGF-beta1 treatment lasts for one hour, at which time cells are harvested.
All media is removed from each well by aspiration, and washed one time with 1 ml of PBS. 1 ml of room temperature 3.7 % paraformaldehyde (freshly made from 16 % stock, diluted with water), and incubated at room temperature for 30 minutes. Paraformaldehyde solution is removed and fixed cells are washed one time with 1 ml PBS.
Fixed cells are blocked with 1 ml of TBS-t supplemented with 5 % (v/v) normal goat serum (NGS), and allowed to incubate while rocking at room temperature for 1 hour. All liquid is removed prior to proceeding to the next step.
1 ml of solution containing 1:400 dilution of Rabbit anti-Smad2 antibody in TBS-t supplemented with 5 % NGS is added to each well, and incubated while rocking over-night (approximately 10 hours) at 4 °C. Primary anti-smad2 solution is removed and cells are washed one time for 10 minutes at room temperature with 1 ml of PBS before proceeding to the next step.
1 ml of solution containing a 1:400 dilution of Mouse ant-Smad4 antibody in TBS-t supplemented with 5 % NGS is added to each well, and incubated for 4 hours while rocking at room temperature. Cells are washed one time with 1 ml PBS for 10 minutes at room temperature before proceeding to the next step.
1 ml of solution containing a 1:400 dilution of Alexa488 conjugated Goat anti-Mouse and 1:400 dilution of Alexa555 conjugated Goat anti-Rabbit antibodies in TBS-t supplemented with 5 % NGS, and incubated at 4 °C while rocking for 4 hours, wrapped in aluminum foil to completely prevent exposure to light. This secondary staining solution is removed, and cells are rinsed quickly with 1 ml of PBS, and then washed for 20 minutes with 1 ml PBS containing 10 μg/ml Hoescht 33258, while rocking at room temperature without exposure to light.
Cells are rinsed twice with 1 ml PBS, and mounted on slides with 8 μl of 30 % glycerol/TBS-t solution and coverslips are secured and sealed to the slides with a perimeter application of clear nail polish.
Cells are imaged using a Nikon microscope with a camera and metamorph software. Images were integrated over 5 seconds.
Figure 2.
A) Immunofluorescent Determination of Smad2/4 Localization upon LMB treatment. HaCaT cells were treated with or without 100 pM TGF-beta for 1 hour prior to harvest in the presence or absence of a 30 minute pretreatment of 20 ng/ml LMB. B) Quantification of immunofluorescent images for Smad2, and Smad4 (C). Black bars indicate cytoplasm fluorescence intensity, while white bars indicate nuclear fluorescent intensity. Error bars indicate one standard deviation for the two measurements made for each cell.
Image Analysis for Immunofluorescence and Live Cell Imaging
For each image a ratio of the average cytoplasmic fluorescence intensity to the average nuclear fluorescence intensity was calculated using measurements made using the ImageJ program (See Note 11).
Four 20 × 20 Pixel squares were used to measure four values of integrated density for each of five cells for each condition. Two squares were used to obtain the integrated density of the cytoplasm, while two squares were used to do the same for the nucleus of the same cell. Integrated density was measured using the Analyze/Measure function in ImageJ. This process was repeated for five total representative cells for each condition tested in both immunofluorescence experiments and live cell imaging experiments.
Averages for each of the two measurements were used to calculate the average integrated density for both the cytoplasm and nucleus of each cell. Reported values for each Cytoplasmic Integrated Density: Nuclear Integrated Density (C:N) consisted of average C:N values from 5 cells. Error for C:N is reported as a single standard deviation of the 5 C:N values for the 5 cells.
3.4 Live cell imaging of GFP-Smad4 and YFP-Smad2
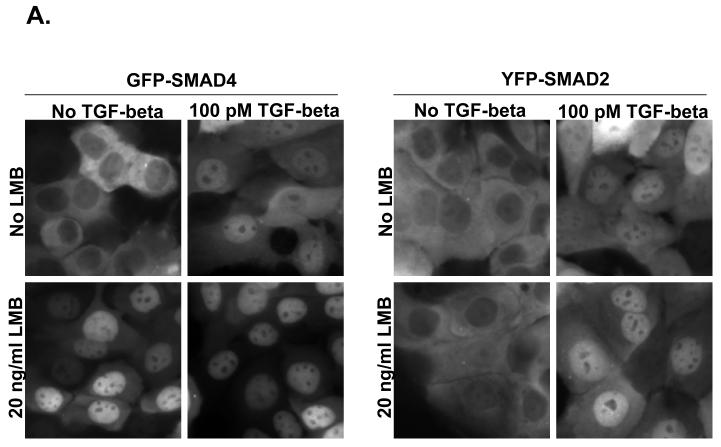
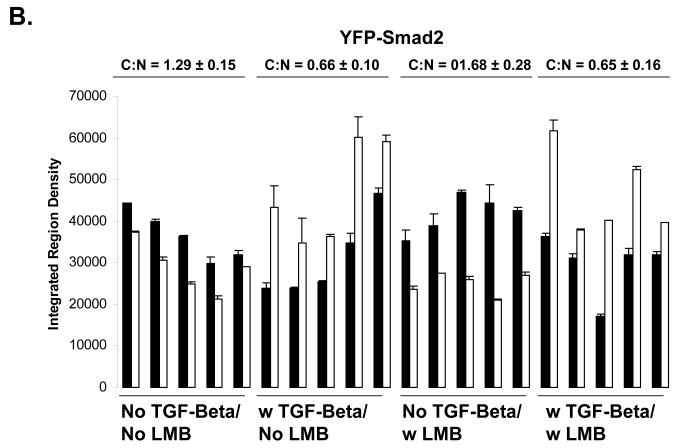
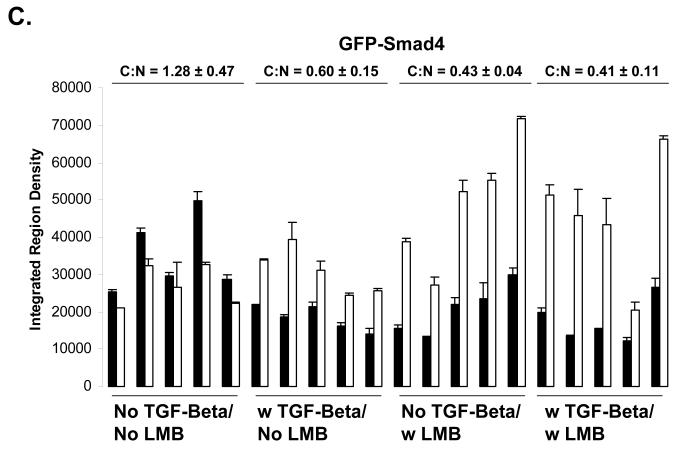
Using live cell imaging analysis, we find that the ratio of cytoplasmic Smad4 to nuclear Smad4 (C:N) is 1.28 ± 0.47 in the basal state, 0.60 ± 0.15 when treated with TGF-beta, 0.43 ± 0.04 when treated with LMB, and 0.41 ± 0.11 when treated with both TGF-beta and LMB. Thus, both LMB and TGF-beta treatment is sufficient to drive the Smad4 from mostly cytoplasmic (C:N>1) to mostly nuclear (C:N<1)(Figure 3 A and C). This was not observed to be case for Smad2, where the ratio of cytoplasmic Smad2 to nuclear Smad2 (C:N) is 1.29 ± 0.15 in the basal state, 0.66 ± 0.10 when treated with TGF-beta, 1.68 ± 0.28 when treated with LMB, and 0.65 ± 0.16 when treated with both TGF-beta and LMB (Figure 2 A and B). Thus, our live cell imaging data supports our findings for endogenous Smad4 and Smad2 using immunofluorescence image analysis.
For both GFP-Smad4 and YFP-Smad2 HaCaT cells, 200,000 cells in 1 ml are added to 3.5 mm glass bottom Mat-tek Petri dishes and allowed to settle for 24 hours.
For each of the two cell lines 4 × 3.5 mm plates were prepared, where one plate was used as a control and media was exchange for 1 ml of prewarmed DMEM media lacking phenol red and supplemented with 10 % FBS, 1 % penicillin/streptomycin, and 1 % l-glutamine solution (refered to as media from here on). To another plate, media was exchanged with 1 ml prewarmed media supplemented with 100 pM TGF-B1. Two more plates were prepared the same way but both using media supplemented with leptomycin B at a final concentration of 2 ng/ml. Thus, we are testing two variables independently. Cells are treated for 1 hour prior to imaging.
GFP-Smad4 cells were imaged using the same methods as for AlexaFluor488, stated above. YFP-Smad2 cells were imaged using a 492/18 band pass excitation filter and a 535/30 band pass emission filter. For both, images were integrations of 3 seconds.
Images were processed using ImageJ software, as stated above for immunofluorescence data.
Figure 3.
A) Live Cell Imaging of GFP-Smad4 and YFP-Smad2. HaCaT cells expressing either N-terminally tagged GFP Smad4 or N-terminally tagged YFP Smad2 were imaged to determine the relative localization of GFP-Smad4 or YFP Smad2. B) Quantification of fluorescent images for YFP-Smad2, and GFP-Smad4 (C). Black bars indicate cytoplasm fluorescence intensity, while white bars indicate nuclear fluorescent intensity. Error bars indicate one standard deviation for the two measurements made for each cell.
Footnotes
Cells prior to treatment should be fully spread out and 80% confluent. If too many cells are seeded at too high a density, clumps of cells will form in subsequent steps and lead to uneven lysing.
The term ‘rinse’ is used here to refer to brief addition, mixing, and removal of solutions. In contrast, the term ‘wash’ refers to the addition, timed incubation while mixing on a rocker, and removal of solutions.
The rate of cell swelling is not constant over different cell types, and the time of this incubation will have to be adjuted accordingly.
If cells are clumped together after this point, the final fraction of nuclear lysate will be partially contaminated with cytoplasm, due to incomplete lysis of plasma membrane prior to separation of nuclei by centrifugation.
If there are significant amounts of clumps of unbroken cells at this point, one may raise the amount in the hypotonic lysis buffer by adding an additional 30 μl, but this will dilute cytoplasmic fraction protein concentration. Alternatively, one may trypsinize cells at harvest, separate cells from trypsin by centrifugation, wash cells 1 time with 1 ml D-PBS, separate cells again by centrifugation, and resuspend cells in hypotonic lysis buffer. This trypsinization step is in place of Steps 1 and 2.
When cells are scraped and transferred to an Eppendorf tube on ice, they will settle to the bottom of the tube within 5 minutes. However, when plasma membranes are disrupted and nuclei are released, nuclei will not settle in less than an hour, and no pellet will form by gravity.
If one desires to remove the plasma membrane component of this fraction, one may spin 13,200 rcf for 10 min, and separate the cytoplasmic supernatant from the plasma membrane pellet, but this is not done in our procedure.
If the nuclear pellet is washed with a greater volume or more times than once with hypotonic buffer, then nuclei with adsorbe to the inner walls of the eppendorf tube, and no pellet will form during separation of nuclei by centrifugation. However, this will not influence the rest of the procedure, as all liquid can be removed and RIPA buffer added to elute nuclei from the walls at the same time as causing complete lysis.
From here on the ‘cytoplasm’ fraction will refer to the fraction containing cytoplasmic proteins as well as plasma membrane proteins.
We have determined that under these conditions in HaCaT cells the total protein yield in the nuclear fraction is two-thirds that of the cytoplasmic fraction, allowing us accurately load equal ratios of cytoplasm and nuclear fractions. Thus, a different cell line may have a different ratio of total protein in the cytoplasm/ plasma membrane relative to the nuclei, and that ratio will have to be determined experimentally based on the total yield of protein in these fractions over several experiments.
Rasband, W.S., ImageJ, National Institutes of Health, Bethesda, Maryland, USA, http://rsb.info.nih.gov/ij/, 1997-2004.
Notes
References
- 1.Massague J. TGF-beta signal transduction. Annu Rev Biochem. 1998;67:753–91. doi: 10.1146/annurev.biochem.67.1.753. [DOI] [PubMed] [Google Scholar]
- 2.Shi Y, Massague J. Mechanisms of TGF-beta signaling from cell membrane to the nucleus. Cell. 2003;113(6):685–700. doi: 10.1016/s0092-8674(03)00432-x. [DOI] [PubMed] [Google Scholar]
- 3.Heldin CH, Miyazono K, ten Dijke P. TGF-beta signalling from cell membrane to nucleus through SMAD proteins. Nature. 1997;390(6659):465–71. doi: 10.1038/37284. [DOI] [PubMed] [Google Scholar]
- 4.Lagna G, Hata A, Hemmati-Brivanlou A, Massague J. Partnership between DPC4 and SMAD proteins in TGF-beta signalling pathways. Nature. 1996;383(6603):832–6. doi: 10.1038/383832a0. [DOI] [PubMed] [Google Scholar]
- 5.Zhang Y, Feng X, We R, Derynck R. Receptor-associated Mad homologues synergize as effectors of the TGF-beta response. Nature. 1996;383(6596):168–72. doi: 10.1038/383168a0. [DOI] [PubMed] [Google Scholar]
- 6.Feng XH, Derynck R. Specificity and versatility in tgf-beta signaling through Smads. Annu Rev Cell Dev Biol. 2005;21:659–93. doi: 10.1146/annurev.cellbio.21.022404.142018. [DOI] [PubMed] [Google Scholar]
- 7.Inman GJ, Nicolas FJ, Hill CS. Nucleocytoplasmic shuttling of Smads 2, 3, and 4 permits sensing of TGF-beta receptor activity. Mol Cell. 2002;10(2):283–94. doi: 10.1016/s1097-2765(02)00585-3. [DOI] [PubMed] [Google Scholar]
- 8.Xu L, Kang Y, Col S, Massague J. Smad2 nucleocytoplasmic shuttling by nucleoporins CAN/Nup214 and Nup153 feeds TGFbeta signaling complexes in the cytoplasm and nucleus. Mol Cell. 2002;10(2):271–82. doi: 10.1016/s1097-2765(02)00586-5. [DOI] [PubMed] [Google Scholar]
- 9.Nicolas FJ, De Bosscher K, Schmierer B, Hill CS. Analysis of Smad nucleocytoplasmic shuttling in living cells. J Cell Sci. 2004;117(Pt 18):4113–25. doi: 10.1242/jcs.01289. [DOI] [PubMed] [Google Scholar]
- 10.Schmierer B, Hill CS. Kinetic analysis of Smad nucleocytoplasmic shuttling reveals a mechanism for transforming growth factor beta-dependent nuclear accumulation of Smads. Mol Cell Biol. 2005;25(22):9845–58. doi: 10.1128/MCB.25.22.9845-9858.2005. [DOI] [PMC free article] [PubMed] [Google Scholar]
- 11.Kurisaki A, Kose S, Yoneda Y, Heldin CH, Moustakas A. Transforming growth factor-beta induces nuclear import of Smad3 in an importin-beta1 and Ran-dependent manner. Molecular biology of the cell. 2001;12(4):1079–91. doi: 10.1091/mbc.12.4.1079. [DOI] [PMC free article] [PubMed] [Google Scholar]
- 12.Xiao Z, Liu X, Henis YI, Lodish HF. A distinct nuclear localization signal in the N terminus of Smad 3 determines its ligand-induced nuclear translocation. Proc Natl Acad Sci U S A. 2000;97(14):7853–8. doi: 10.1073/pnas.97.14.7853. [DOI] [PMC free article] [PubMed] [Google Scholar]
- 13.Xiao Z, Liu X, Lodish HF. Importin beta mediates nuclear translocation of Smad 3. J Biol Chem. 2000;275(31):23425–8. doi: 10.1074/jbc.C000345200. [DOI] [PubMed] [Google Scholar]
- 14.Kurisaki A, Kurisaki K, Kowanetz M, et al. The mechanism of nuclear export of Smad3 involves exportin 4 and Ran. Mol Cell Biol. 2006;26(4):1318–32. doi: 10.1128/MCB.26.4.1318-1332.2006. [DOI] [PMC free article] [PubMed] [Google Scholar]
- 15.Yao X, Chen X, Cottonham C, Xu L. Preferential utilization of Imp7/8 in nuclear import of Smads. J Biol Chem. 2008;283(33):22867–74. doi: 10.1074/jbc.M801320200. [DOI] [PMC free article] [PubMed] [Google Scholar]
- 16.Pierreux CE, Nicolas FJ, Hill CS. Transforming growth factor beta-independent shuttling of Smad4 between the cytoplasm and nucleus. Mol Cell Biol. 2000;20(23):9041–54. doi: 10.1128/mcb.20.23.9041-9054.2000. [DOI] [PMC free article] [PubMed] [Google Scholar]
- 17.Watanabe M, Masuyama N, Fukuda M, Nishida E. Regulation of intracellular dynamics of Smad4 by its leucine-rich nuclear export signal. EMBO Rep. 2000;1(2):176–82. doi: 10.1093/embo-reports/kvd029. [DOI] [PMC free article] [PubMed] [Google Scholar]
- 18.Xiao Z, Latek R, Lodish HF. An extended bipartite nuclear localization signal in Smad4 is required for its nuclear import and transcriptional activity. Oncogene. 2003;22(7):1057–69. doi: 10.1038/sj.onc.1206212. [DOI] [PubMed] [Google Scholar]
- 19.Liu X, Constantinescu SN, Sun Y, et al. Generation of mammalian cells stably expressing multiple genes at predetermined levels. Analytical biochemistry. 2000;280(1):20–8. doi: 10.1006/abio.2000.4478. [DOI] [PubMed] [Google Scholar]


