Abstract
We are interested in developing quantitative tools to study RPE morphology. We want to detect changes in the RPE by strain, disease, genotype, and age. Ultimately these tools should be useful in predicting retinal disease progression. The morphometric data will also help us to understand RPE sheet formation and barrier functions. A clear disruption of the regular cell size and shape appeared in mouse mutants. Aspect ratio and cell area together gave rise to principal components that predicted age and genotype accurately and well before visually obvious damage could be seen.
Keywords: Retinal pigmented epithelium, RPE, morphometrics, pattern analysis
76.1 Introduction
We hypothesize that in age related macular degeneration (AMD), stage-specific mechanical stresses act on the RPE, altering morphology. In this article we describe imaging and computational analyses for staging and categorizing these morphological responses in the RPE.
The morphology of the RPE cell is affected in disease states in many retinal and macular diseases. Breakdown of the RPE leads to a loss of the blood-retina-barrier [1]. In a diseased state, RPE changes can include epithelial-mesenchymal transition and abnormal proliferation. Changes can range from minor shape changes to cell death. Here, we seek to define patterns in the local interactions of RPE cells, when viewed en face, which are characteristic of the very earliest changes in shape that precede AMD. We have begun with simple mouse model systems to study the normal and diseased RPE sheet in flatmounts. We previously established that the rd10 mouse RPE sheet experiences many abnormalities [1]. Here we quantitatively detect early changes that appear useful as predictors of subsequent damage and death of RPE in this and other strains. We created a large dataset and discovered principal components based on two metrics, aspect ratio and cell size, that provided discrimination among strains and ages of mice. With this information we can begin to build a useful model of RPE degeneration as a predictive tool for retinal disease and AMD progression.
76.2 Materials and Methods
All animals were cared for in an AAALAC certified facility under an approved IACUC protocol [2, 3]. Over 100 mice were used, including C57BL/6J (WT) and mutant lines (rd10, IRBP knockout (KO), and rpe65 KO) that were congenic with C57BL/6J. Dissection, fixation, flatmounting, staining, and imaging were conducted as previously described [2].
To analyze photomerged images, Cell Profiler version 1.0 (release 9717) was used [4]. About 1.0 million cells were analyzed; CellProfiler automatically collected morphometric data (in 23 metrics) on every cell. We used functional principal component analysis (FPCA) to analyze the data.
76.3 Results
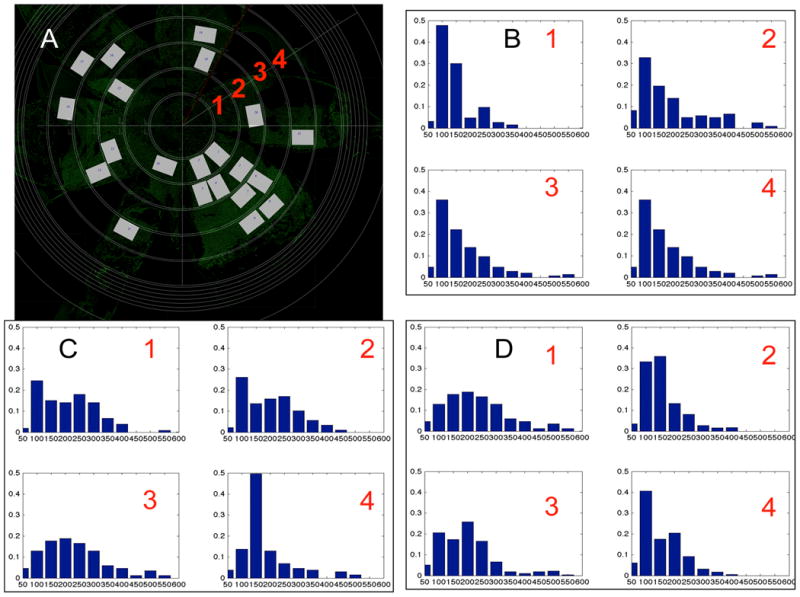
In Fig. 76.1, Panel A is an example of a flatmount that was photomerged from 64 images, and then 21 selected rectangles were analyzed in CellProfiler. Data were collected from four radial zones from three strains of mice (WT C57BL/6J, IRBP KO, and rpe65 KO). The density distributions of cell area in Panels B-D indicate differences according to strain and zone. The shapes of the distributions varied widely.
Figure 76.1.

Inhomogeneous spatial distribution of morphology in experimental mouse RPE flat-mount data. (A) RPE flat-mount defining measuring zones 1-4 (red numbers). (B-D) Cell area distributions for four zones: (B) Wild-type mouse at P60; (C) IRBP mutant at P60; (D) RPE65 mutant at P60. While the WT distributions were tighter and more similar from one zone to the next, most of the other distributions were more spread out and revealed no obviously similar patterns of cell sizes.
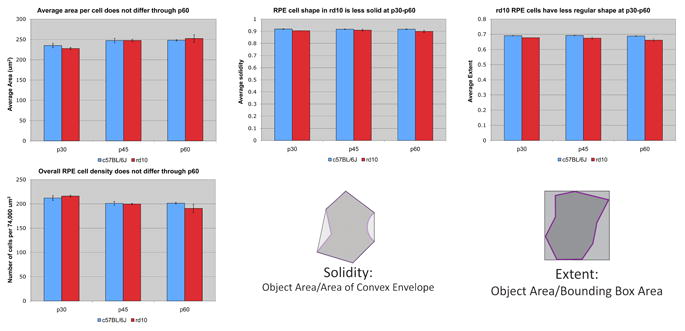
In Fig. 76.2, at very young ages from P30 to P60, we observed no difference in cell size, density or number of sides. Previously, we observed early changes in eccentricity and form factor [2], and here we detected differences in solidity and extent of the RPE cell, indicating quantitative irregularities in the shape of RPE cells from the rd10 mouse that were not detected by visual inspection.
Figure 76.2.

Comparison of rd10 and wt RPE at young ages. Four metrics obtained in CellProfiler were studied for potential differences. These included cell area, cell density, solidity, and extent. The definitions of solidity and extent are diagrammed. No differences in the averaged cell area or cell density were detected comparing rd10 to WT at P30, P45, or P60. The solidity and extent of rd10 RPE cells were reduced compared to WT at all three ages.
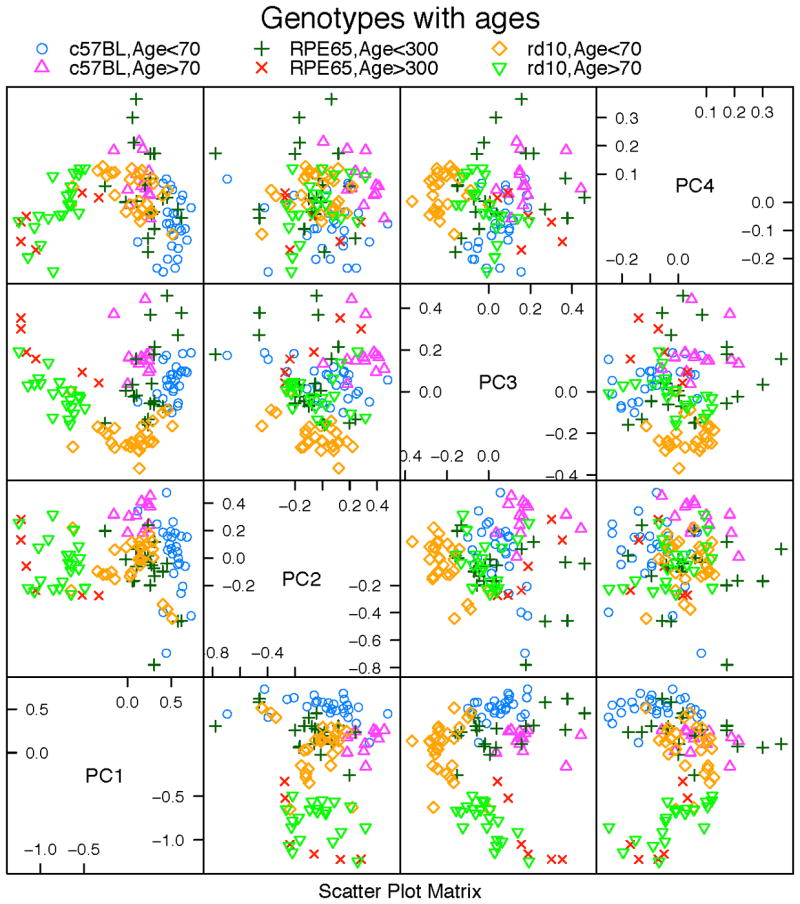
In Fig. 76.3, we tested the hypothesis that the aspect ratio (a measure of cell shape) combined with cell area of the RPE cells would be a useful predictor of future deterioration of the RPE sheet. The figure shows function principal component analysis (FPCA) results with the first four principal components (PC). With this approach it was possible to clearly resolve young versus old in WT, rpe65, and rd10. For example, PC1 and PC2 resolved rd10 and WT at both young and old ages well. Thus, principal components allowed an accurate genotyping of each strain regardless of age. Prediction accuracy of the age and genotype of an unknown mouse RPE flatmount was >98%.
Figure 76.3.

Scatterplot of the first four principal components from FPCA analysis using aspect ratio and cell area. Different colors and marks indicate six distinct classes: young C57BL/6J, old C57BL/6J, young rpe65 KO, old rpe65 KO, young rd10, and old rd10.
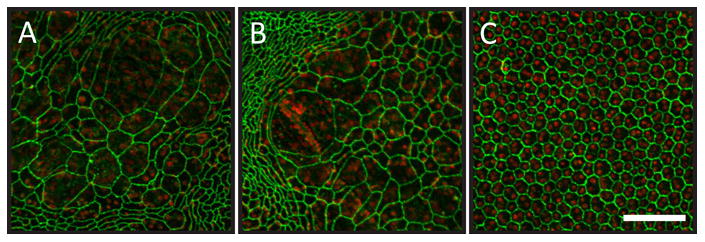
In Fig. 76.4, extremely large RPE cells from P100 rd10 are illustrated. These cells appeared to be multinucleate [5], though a possible confound is “show-through” of underlying capillary endothelial cells. In normal pigmented mice, pigment granules block “show-through”; however, if stretched thin, the number of pigment granules can be so small that underlying capillary nuclei become readily visible. There was no obvious pattern or location in the appearance of the extremely large cells. For example, in Panels A and B the large cells were near highly eccentric cells, but not near many other large cells. Regardless of mutant or WT strain, at least 25% of cells were binucleate [6].
Figure 76.4.

Highly enlarged cells in the RPE sheet of the P100 rd10 mouse. Green represents ZO-1 staining, and red represents propidium iodide staining of nuclei. Panels A and B illustrate representative large cell patches from rd10. Panel C represents aged matched WT. The large cells appeared multinucleate in A and B. The scale bar in Panel C represents 100 microns and applies to all panels.
76.4 Discussion
RPE sheet morphometrics clearly indicate retinal disease stage and age. That is, we can predict genotype at early stages before any damage occurs in simple Mendelian inherited retinal degenerations in mouse. We speculate that this can be applied to human RPE and predict who is at risk for AMD. Further, the approach could be used to monitor treatment effectiveness and dosing schedules.
The general utility of the CellProfiler pipeline [4] was in the analysis of spatial and temporal information and in capturing quantified information on numerous metrics of millions of individual RPE cells (Fig. 76.1).. The density distributions of cell areas in different regions indicates that within the eye, that spatial variation of the morphology can be almost as significant as that between different strains.
At early ages some metrics were not useful in early discrimination of rd10 from WT. However, shape-related metrics (aspect ratio, solidity, eccentricity, and extent) revealed clear differences between mutant strains and WT at early stages before a human observer could detect morphologic changes (Fig. 76.2), suggesting a promising class of metrics to pursue.
By utilizing FPCA (based on joint aspect ratio and cell size) we achieved: (1) discrimination by age in each genotype, (2) discrimination among genotypes at each age, (3) discrimination among all six age-genotype groups (Fig. 76.3)). This establishes that we can make predictions of each genotype and its outcome at an early age with high accuracy and confidence.
In young wild type mice the RPE morphology resembles a regular hexagonal array of cells of uniform size throughout the retina except near the ciliary body, where the shapes of RPE resemble a soft network of teardrop- or fish scale-shaped cells at the periphery (called the transitional epithelium, an 8-10 cell-wide zone). It is common to see a few discrete dots of ZO-1 staining in the cytoplasm of these transitional cells. The regular RPE lack these dots.
Mutant eyes develop a subpopulation of large cells. To compensate for cell loss, adjacent RPE cells expand surface area to prevent gaps from emerging between adjacent cells. Over time there is an equilibration of cell sizes, leading to most cells becoming larger. However, in rd10 mice, we find some extremely large cells (Fig. 76.4), and it remains to be explained why there is no equilibration of cell size among those and nearby cells. We speculate that there are unknown permanent structures attached to some cells that hinder movement or area expansion, and this prevents cell size equilibration.
In conclusion, cell size and aspect ratio ought to be investigated to discriminate (with FPCA) between normal and early stage AMD. Morgan et al. [7] have reported noninvasive AO-FAF imaging of RPE. Flood illumination and AO, Syed et al. [8] may be useful as well. Analysis of data from such instruments with the approach we report here ought to be considered.
Acknowledgments
Supported by NIH grants R01EY0016470, and P30EY007092, and an unrestricted grant to the Emory Eye Center from Research to Prevent Blindness.
References
- 1.Rizzolo LJ. Development and role of tight junctions in the retinal pigment epithelium. Int Rev Cytol. 2007;258:195–234. doi: 10.1016/S0074-7696(07)58004-6. [DOI] [PubMed] [Google Scholar]
- 2.Chrenek MA, Dalal N, Gardner C, Grossniklaus H, Jiang Y, Boatright JH, Nickerson JM. Analysis of the RPE sheet in the rd10 retinal degeneration model. Advances in Experimental Medicine and Biology. 2012;723:641–7. doi: 10.1007/978-1-4614-0631-0_81. [DOI] [PMC free article] [PubMed] [Google Scholar]
- 3.Nickerson JM, Goodman P, Chrenek MA, Bernal CJ, Berglin L, Redmond TM, Boatright JH. Subretinal delivery and electroporation in pigmented and nonpigmented adult mouse eyes. Methods in molecular biology (Clifton, NJ) 2012;884:53–69. doi: 10.1007/978-1-61779-848-1_4. [DOI] [PMC free article] [PubMed] [Google Scholar]
- 4.Lamprecht MR, Sabatini DM, Carpenter AE. CellProfiler: free, versatile software for automated biological image analysis. BioTechniques. 2007;42(1):71–5. doi: 10.2144/000112257. [DOI] [PubMed] [Google Scholar]
- 5.Ding JD, Johnson LV, Herrmann R, Farsiu S, Smith SG, Groelle M, Mace BE, Sullivan P, Jamison JA, Kelly U, Harrabi O, Bollini SS, Dilley J, Kobayashi D, Kuang B, Li W, Pons J, Lin JC, Bowes Rickman C. Anti-amyloid therapy protects against retinal pigmented epithelium damage and vision loss in a model of age-related macular degeneration. Proc Natl Acad Sci USA. 2011;108(28):E279–87. doi: 10.1073/pnas.1100901108. [DOI] [PMC free article] [PubMed] [Google Scholar]
- 6.Bodenstein L, Sidman RL. Growth and development of the mouse retinal pigment epithelium. I. Cell and tissue morphometrics and topography of mitotic activity. Dev Biol. 1987;121(1):192–204. doi: 10.1016/0012-1606(87)90152-7. [DOI] [PubMed] [Google Scholar]
- 7.Morgan JI, Dubra A, Wolfe R, Merigan WH, Williams DR. In vivo autofluorescence imaging of the human and macaque retinal pigment epithelial cell mosaic. Invest Ophthalmol Vis Sci. 2009;50(3):1350–9. doi: 10.1167/iovs.08-2618. [DOI] [PMC free article] [PubMed] [Google Scholar]
- 8.Syed R, Sundquist SM, Ratnam K, Soudry SZ, Zhang Y, Crawford JB, Macdonald IM, Godara P, Rha J, Carroll J, Roorda A, Stepien KE, Duncan JL. High Resolution Images of Retinal Structure in Patients with Choroideremia. Investigative Ophthalmology & Visual Science. 2013 doi: 10.1167/iovs.12-10707. [DOI] [PMC free article] [PubMed] [Google Scholar]


