Abstract
Muscular contraction plays a pivotal role in the mechanical environment of bone, but controlled muscular contractions are rarely used to study the response of bone to mechanical stimuli. Here, we use implantable stimulators to elicit programmed contractions of the rat tibialis anterior (TA) muscle. Miniature stimulators were implanted in Wistar rats (n = 9) to induce contraction of the left TA every 30 s for 28 days. The right limb was used as a contralateral control. Hindlimbs were imaged using microCT. Image data were used for bone measurements, and to construct a finite-element (FE) model simulation of TA forces propagating through the bone. This simulation was used to target subsequent bone histology and measurement of micromechanical properties to areas of high strain. FE mapping of simulated strains revealed peak values in the anterodistal region of the tibia (640 µε ± 30.4 µε). This region showed significant increases in cross-sectional area (28.61%, p < 0.05) and bone volume (30.29%, p < 0.05) in the stimulated limb. Histology revealed a large region of new bone, containing clusters of chondrocytes, indicative of endochondral ossification. The new bone region had a lower elastic modulus (8.8 ± 2.2 GPa) when compared with established bone (20 ± 1.4 GPa). Our study provides compelling new evidence of the interplay between muscle and bone.
Keywords: muscle electrical stimulation, bone, loading, mechanotransduction
1. Introduction
In 1892, Wolff [1] famously proposed a set of laws concerning bone adaptation to mechanical stimuli. His broad principle—that bone is able functionally to adapt to its mechanical environment—is still widely accepted [2,3]. The skeletal environment is heavily influenced by contractile and kinematic forces generated by skeletal muscle during movement. Despite this, muscular contraction is rarely used experimentally to load bones under closely controlled conditions [4–8]. Typically, animals are either anaesthetized, and the bones are loaded in daily sessions using an external mechanical device, or they are subjected to exercise regimes [9–11]. These regimes have reported mild osteogenic responses that are highly variable between individuals, probably reflecting intraspecific variations of morphology, physiology and aptitude. Electrical muscular stimulation (EMS) via the motor nerve offers several potential advantages over the above paradigms. Perhaps its greatest advantage is experimental control; neuromuscular stimulation can generate contractions of the whole muscle for a pre-set time period at a pre-set frequency. The stimulation can also be delivered continuously over days or weeks without the need for repeated anaesthesia, supervised exercise sessions or mechanical loading protocols, offering a greater potential to resolve the integrated changes of muscular and skeletal phenotype [12].
Here, we use recent advances in implantable microelectronics to determine the effect of electrical neuromuscular stimulation on the morphology and biomechanics of bone. We anticipated that the period of EMS will shift the muscle phenotype, and that the repetitive contractile forces generated would induce morphological changes in the tibia. We also anticipated that morphological changes would be most pronounced in regions of greatest strain. We have addressed these questions using micro-computed tomography (microCT) and histology together with recent advances in contrast-enhanced microCT [13–15], nanoindentation and computational simulations of structural mechanics [16–18].
2. Material and methods
(a). Animal model
Nine male, eight-week-old Wistar rats (weights 228–282 g) underwent surgical implantation of miniature neuromuscular stimulators [19]. Under general isoflurane anaesthesia, stimulators were implanted into the abdominal cavity. The electrodes were passed subcutaneously into the hindlimb to activate the common peroneal nerve. Stimulators delivered 0.2 ms pulses at 100 Hz for 200 ms every 30 s, resulting in a total of 9.6 min of stimulation per day. Each 200 ms burst of nerve stimulation at 100 Hz caused a very brief but fused (tetanic, near maximum force) contraction. After 28 days, the animals were euthanized. To evaluate any possible systemic or surgical effects on the contralateral control limb, three additional age-, sex- and strain-matched rats were analysed as controls (no surgery or specific loading regimes).
(b). Imaging
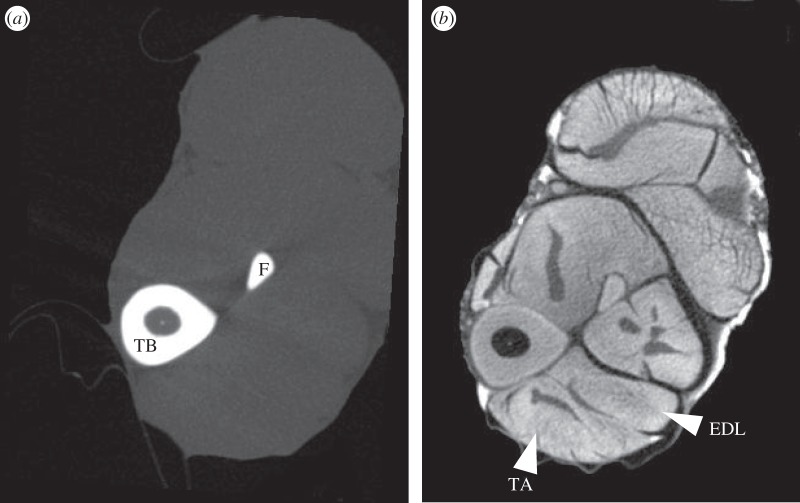
Hindlimbs from six experimental and the three control animals were removed, and stored in 10% phosphate-buffered formal saline. Hindlimbs were imaged twice with the Metris X-tek custom 320 kV bay system (University of Manchester) and reconstructed at 40 µm resolution (isometric voxels). For standard microCT, X-ray tube parameters of 75 kV and 200 µA were used. For contrast enhancement of muscle tissue (figure 1; see also [13]), limbs were then stained with I2KI. To control for concentration-dependent specimen shrinkage [15], all samples were immersed in the same concentration of solution for the same time period (9% I2KI for 9 days). Specimens were then scanned a second time (90 Kv; 130 μA; 40 µm). Hindlimbs from the remaining three experimental animals were subjected to muscle histology (see below).
Figure 1.
Mid-tibial transverse MicroCT scans of the same rat hindlimb, (a) without and (b) with I2KI-contrast enhancement. EDL, extensor digitorum longus; F, fibula; TA, tibialis anterior; TB, tibia.
(c). Macroscopic analysis
Volumes of stimulated tibialis anterior (TA) and extensor digitorum longus (EDL) muscles were calculated from contrast-enhanced microCT images using the Volume Est plug-in for ImageJ [20,21].
The maximum force production capability of TA was estimated using I2KI microCT data. Average fascicle lengths were calculated from 20 fascicles throughout TA. Physiological cross-sectional area (PCSA) was calculated by dividing average muscle fascicle lengths by muscle volume. Muscle force estimates were then calculated by multiplying PCSA with muscle stress value of 0.3 N mm−2 [22]. Force estimates correspond well with those used in a previous model of the rat hindlimb [23]. Regional cortical thickness data were obtained using the BoneJ plug-in for ImageJ [20,24]. To capture regional differences, 10 evenly distributed sites were sampled along the posterior and anterior surfaces of the tibia. Differences in cortical thickness were tested for using unequal-variance two-tailed Student's t-tests, with p-values < 0.05 considered significant.
(d). Finite-element analysis
Finite-element analysis (FEA) was used to simulate the strains experienced by the tibia–fibula complex during TA muscular contraction. The simulation was based on the control limb geometry closest to the mean form in the experimental sample (n = 6), as determined using homologous landmarks and MorphoJ [25]. Bones for the selected individual were reconstructed in three dimensions from the standard microCT data in Amira v. 5.4.0 (Visage Imaging, Pro Medicus Limited, Melbourne, Australia). The model included the tibia–fibula complex, the talus and the condyles of the femur, as well as cartilaginous growth plates, articular cartilages and medullary fat. The talus was set on a rigid-body platform. The reconstruction was converted to a tetrahedral mesh in Amira (consisting of 284 766 tetrahedra) and was parametrized as well as analysed using FEBio version 1.8 [26]. Constraints were applied to the femoral head and at the rigid body. Bone and fat were modelled as isotropic elastic materials with reference to published values [27–31]. Cartilaginous structures were modelled as near incompressible Mooney–Rivlin materials with reference to published values [32,33]. Loads of 8.7 N were applied across TA's attachment site to represent the estimated contractile muscle force (see §2c on macroscopic analysis). A force was also applied at the femoral condyles of 0.89 N approximating the influence of body mass during stance. Force vectors were based on the attachment sites of the muscle and the typical orientation of the limb. A version of the model was validated against previously published strain data for a comparable rat tibia loaded under ex vivo external compression [34].
(e). Focused bone analysis
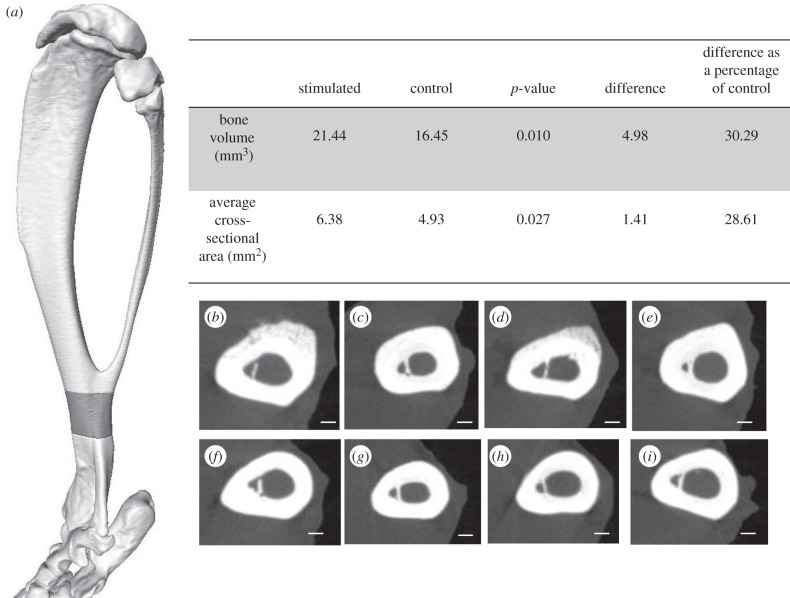
Guided by the FEA, a distal segment of the tibia was selected for further analysis (figure 7a). Measures of bone area and volume for this region were taken with Amira from both hindlimbs of four experimental rats, and values were compared using two-tailed unequal-variance t-tests (p < 0.05 considered significant).
Figure 7.
MicroCT data illustrating differences of bone volume and cross-sectional measurements targeted to the anterodistal region of the tibia. (a) The grey region on the three-dimensional reconstruction of the tibia highlights the region used for bone volume and cross-sectional area measurements of microCT data. (b–i) Cross-sections taken from microCT data within this region for (b–e) stimulated limb and (f–i) corresponding contralateral control limbs. (d) and (h) correspond with histological sections in figure 8a. Scale bars, 400 µm.
(f). Histology
For histological analysis of muscle, fresh TA samples were dissected from the widest part of the muscle in three experimental animals. Samples were transferred to cork discs and snap frozen in isopentane, and stored at −80°C for subsequent cryostat processing. Serial frozen sections of 10 µm were cut in a cryostat at −20°C. Sections were stained for myofibrillar ATPase [35], which allows identification of type 1, type 2a and type 2b/d fibres in one incubation. Further sections were stained with NADH dehydrogenase, to indicate the mitochondrial content of the muscle fibres and to cross-check fibre identification.
For bone histology, the individual that was closest to the mean shape was selected. Guided by the FEA, the distal portion of the tibia was targeted for histological analysis. A distal portion of the tibia was cut from the rest of the bone using a slow-speed diamond saw, and samples were immersed in 12% ethylenediaminetetraacetic acid (EDTA) diluted in 10% formalin, pH 7.4. Following fixation and decalcification, tissues were processed for histology and embedded in paraffin wax. Paraffin blocks were sectioned at 5 µm intervals using a semiautomatic microtome, mounted and stained with haematoxylin and eosin (H&E). Further sections were stained using safranin O and fast green for indication of chondrocytes. Images were obtained using a Nikon eclipse Ci-L light microscope and a Nikon DS-Fi2 camera (Nikon, Tokyo, Japan).
Muscle fibre data were obtained from the histological sections using 1200 × 900 µm images. A random number generator was used to select 200 sets of coordinates for each image of muscle taken. The coordinates were used to identify an unbiased sample population of muscle fibres, which were manually categorized into type 1, 2a or 2b. The cross-sectional area of each individual fibre was measured. The proportional cross-sectional area of fibre types was calculated. Differences in fibre populations were tested for using a two-tailed unequal-variance Student's t-test, with p < 0.05 considered significant.
(g). Nanoindentation
Slices of tibia were cut with the diamond saw from the control and experimental tibias. Bone slices were cold-mounted in a non-infiltrating epoxy resin (Eposet, MetPrep, Coventry, UK) and polished using P4000 silicon carbide paper to achieve a surface finish of 5 µm. The samples were then polished using Opus colloidal silica suspension polishing compound (MetPrep) to ensure a smooth bone surface for contact with the indentation tip.
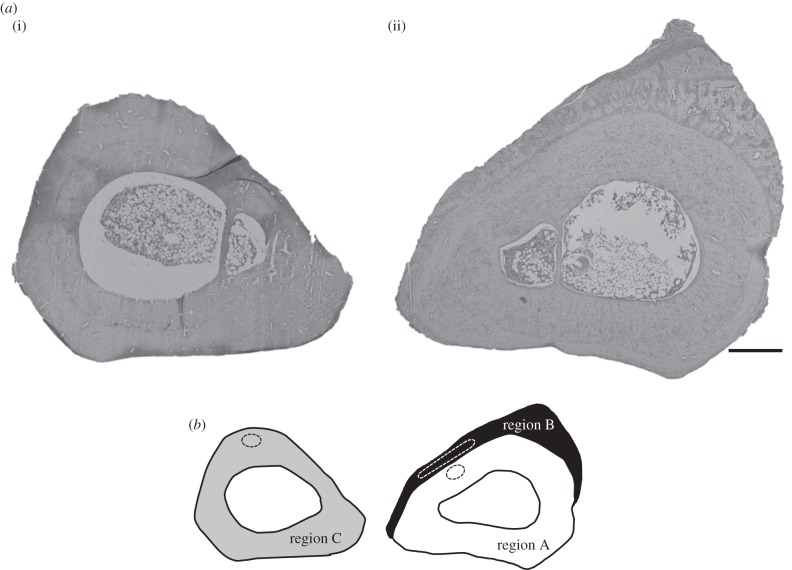
Nanoindentation was carried out using an Agilent nanoindenter G200 (Agilent Technologies, Chandler, AZ) instrument with an ultra-low load dynamic contact module indentation head. Indentations were carried out using a Berkovich tip with a 20 nm radius. The continuous stiffness measurement option [36] was used at a frequency of 75 Hz for the testing. Each indent was made in the bone up to a maximum depth of 500 nm with surface detection limited to 100 N m−1. A Poisson's ratio of 0.3 was assumed [29,30]. Three distinct bone regions were identified for indentation (figure 8b). Thirty indents across regions A and C were made in an array, and 20 indents across region B were manually selected to avoid indentation of any blood vessels or fibrous tissue (figure 8). The nanoindenter was calibrated using fused silica with known mechanical properties before and after testing the specimen.
Figure 8.
(a) Histological cross sections of the targeted region, stained with H&E, from the tibias with the shape closest to the mean shape. (i) The contralateral control and (ii) the stimulated limb are sectioned at equivalent positions along the length of the tibia. Scale bar, 400 µm. (b) The regions of bone used for nanoindentation. White represents established bone (region A), black represents new bone (region B) and grey represents the contralateral control bone (region C). Approximate areas used for nanoindentation are outlined by dashed lines.
3. Results
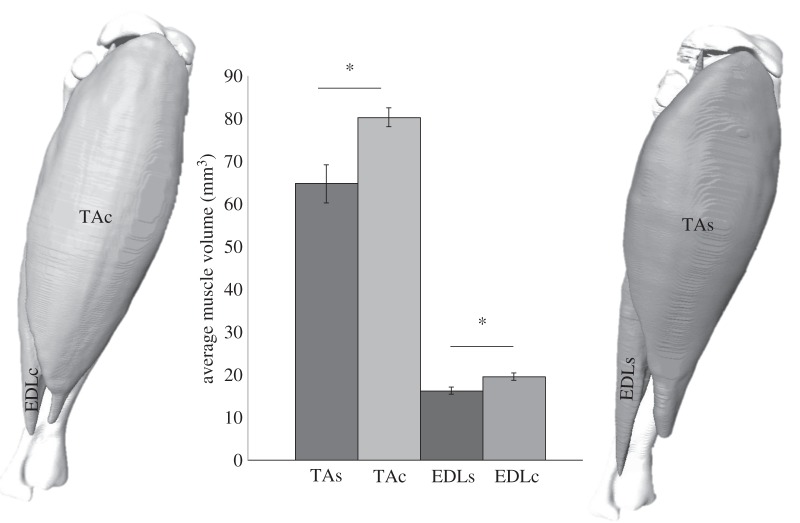
The volume of the stimulated muscles, TA and EDL, showed a significant decrease of volume of, on average, 19% and 16% (p < 0.05), respectively, when compared with the contralateral control limb (figure 2).
Figure 2.
Volume reconstructions of tibialis anterior and extensor digitorum longus muscles in situ on the tibia of both control (left) and stimulated (right) limbs. Both stimulated muscles show a significant decrease in average muscle volume compared with the contralateral control muscle of 19% (p < 0.05) and 16% (p < 0.05), respectively. n = 6. TAc, tibialis anterior control; EDLc, extensor digitorum longus control; TAs, tibialis anterior stimulated; EDLs, extensor digitorum longus stimulated.
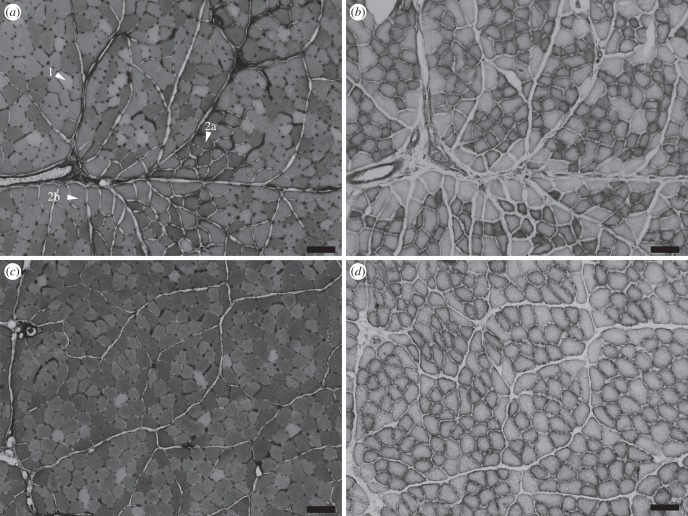
Histological analysis of fibre types within TA showed that both contralateral control and stimulated muscles contained a mix of type 1, 2a and 2b fibre types. Stimulated muscles showed significant decreases in the proportion of total cross-sectional area of type 2b fibres (20%, p < 0.01; figures 3 and 4). There were no significant differences among other fibre types.
Figure 3.
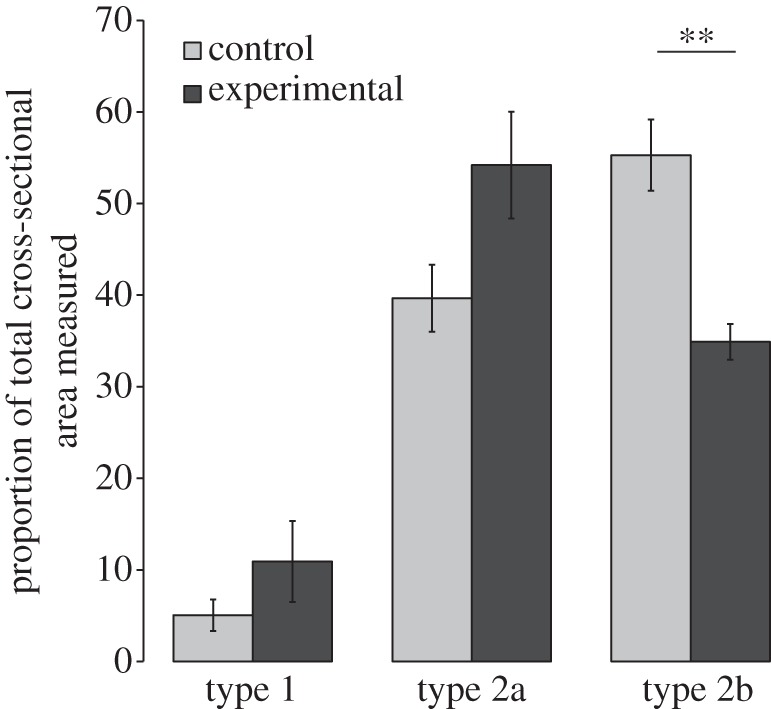
Proportion (%) of total cross-sectional area of muscle fibre types 1, 2a and 2b within area sampled, in the stimulated and contralateral control muscles. There is a significant decrease in type 2b area (p = 0.007).
Figure 4.
Histological sections of tibialis anterior: (a,b) contralateral control muscle and (c,d) stimulated muscle. (a,c) Myofibrillar ATPase staining shows fibre type: type 1 fibres do not stain, type 2a stain darkest and 2b stain intermediate; representative fibres are labelled. (b,d) NADH dehydrogenase staining was used to stain for oxidative capacity: the darker the fibre, the more mitochondria present, and so the more oxidative the muscle. Scale bars, 100 µm.
NADH staining represents mitochondrial content in muscle fibres. In the contralateral control muscle, NADH staining revealed fibres that were either unstained or densely stained (figure 4b). In the stimulated muscle, all fibres showed NADH staining (figure 4d).
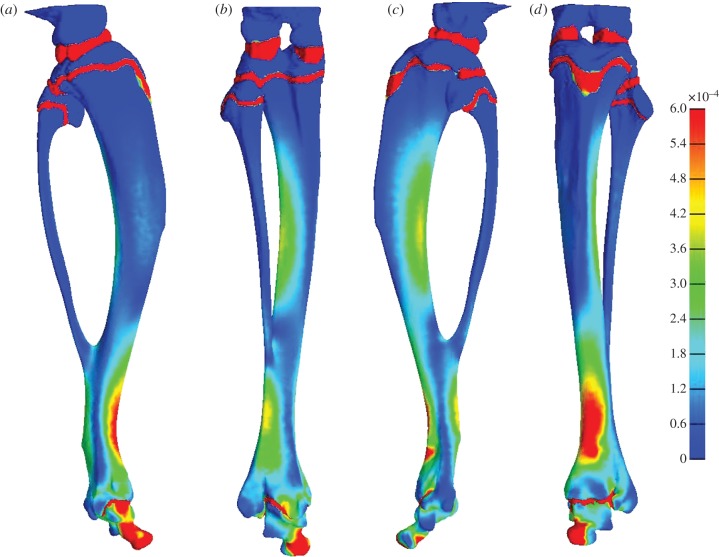
FEA revealed a region of high predicted strain in the anterodistal region of the tibia (figure 5). The anterodistal area experienced averages of 640 µɛ effective strain and 328 µɛ maximum shear strain.
Figure 5.
The distribution of effective strain across the tibia on the (a) medial, (b) posterior, (c) lateral and (d) anterior aspects. The highest effective strains are indicated by red regions and the lowest by blue.
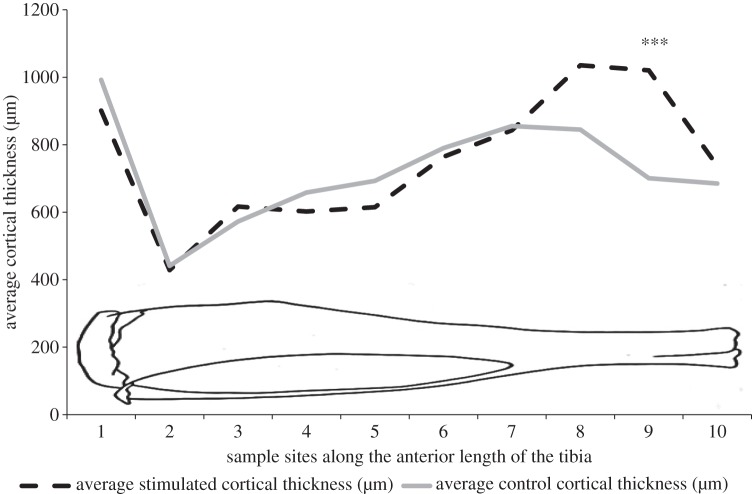
Regional sampling of the cortical thickness along the anterior and posterior aspects of the tibias showed that there were no significant differences between regional cortical thickness along the posterior aspect of the tibia. Along the anterior aspect of the tibia, there was a highly significant increase (300 µm, p < 0.001) in cortical thickness also in the distal region of the stimulated tibia compared with the contralateral controls (figure 6). There were no significant differences in any parameter measured by microCT between the contralateral control legs and the control animal legs.
Figure 6.
Regional measurements of cortical thickness along the anterior aspect of the tibia in the stimulated (broken line) and contralateral control (solid line) bones. There was a significant difference between control and stimulated bones in the distal aspect of the tibia (n = 6). Asterisks represent a highly significant difference (p < 0.001). The diagrammatic outline of the tibia represents the approximate location of the sample sites along the tibia.
In the distal section of the tibia, there was a significant increase in average cross-sectional area of 1.41 mm² (p < 0.05) and an increase in total volume of 4.98 mm3 (p < 0.05) in the stimulated limb compared with the contralateral control (figure 7).
Histological sectioning targeted to this distal region revealed that the cross-sectional geometry of the contralateral control and the stimulated tibias were markedly different (figure 8a). The stimulated bone shows a large region of primary osteon formation (figure 9). Safranin O staining revealed the presence of clusters of chondrocytes within the region of primary osteon formation (figure 10).
Figure 9.
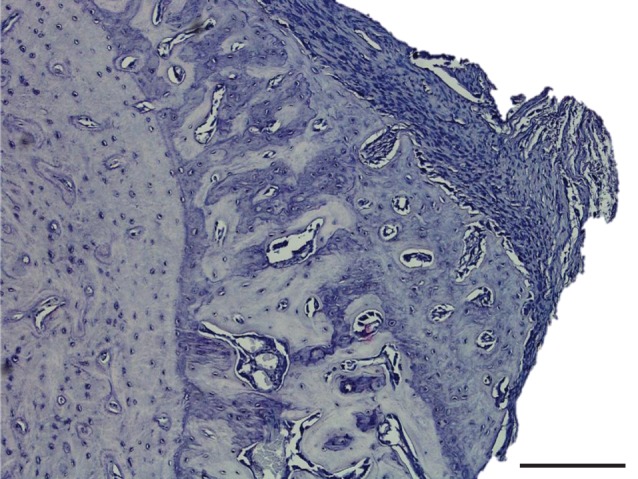
Histological section of the stimulated tibia, showing the region of primary osteon formation. Section stained with H&E. Scale bar, 200 µm.
Figure 10.
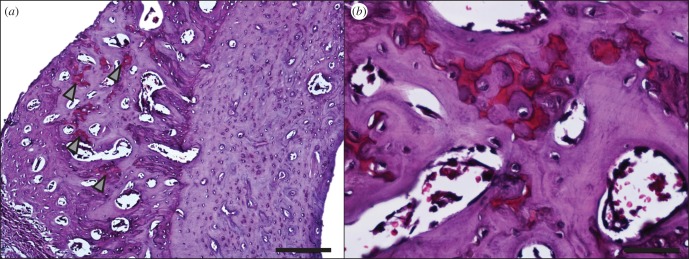
(a) Safranin O staining of the stimulated tibia. Proteoglycans stain red; arrowheads indicate red cartilaginous regions. Scale bar, 100 µm. (b) A region with high safranin O staining, within the region of primary osteon formation on the stimulated tibia. Scale bar, 50 µm.
Nanoindentation measurements on the distal regions within the contralateral control and experimental bones showed that the average elastic modulus of region A, which represents the established bone, was 20 ± 1.4 GPa. Region B, representing the region of new bone, was 8.8 ± 2.2 GPa, and region C, which was the contralateral control tibia, was 15 ± 1.5 GPa (figure 11; see also figure 8b).
Figure 11.
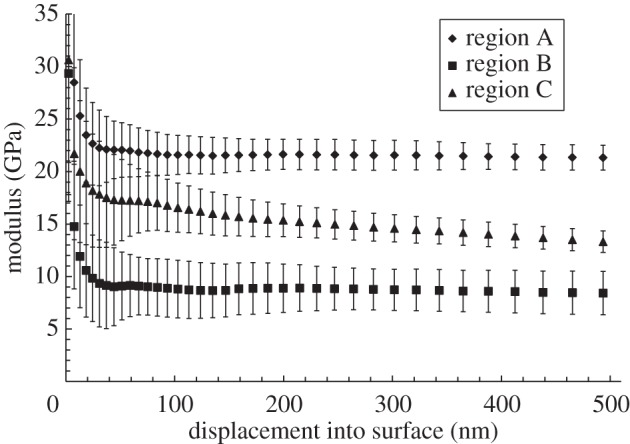
Modulus versus displacement into surface for the anterodistal region of the contralateral control bone as determined by nanoindentation (n = 30).
4. Discussion
Electrical muscle stimulation (EMS) has been used mostly for examining the plastic potential of skeletal muscle [12,37–39] and only recently used for studying bone. For instance, Qin et al. [40] used EMS to study the response of bone cell populations to EMS following spinal cord injury, but no morphological data were presented. Hence, this study is the first to use EMS to assess the effect of controlled muscular contraction upon the macro- and microanatomy of the supporting skeleton.
EMS resulted in transformation of TA towards a less fatigable phenotype. Three major fibre types found in rat muscle are type 1 (slow, oxidative), type 2b (fast, glycolytic) and the intermediate type 2a (fast twitch and oxidative) [12]. We have shown that a pattern of 100 Hz burst stimulation every 30 s for 28 days resulted in a significant decrease in type 2b fibres (figures 3 and 4) and an increase in mitochondria within the fibres (figure 4). Together, these suggest a decrease in susceptibly to fatigue. The reduction in muscle volume of the stimulated muscles (figure 2) is likely to represent the net effect of muscle fibre-type transformation away from fatigable type 2b fibres as types 2a and 1 have a smaller cross-sectional area than type 2b fibres [41]. These changes are consistent with transformation of muscle in endurance training [42,43].
In addition to muscular transformation, we show that EMS can be an effective technique for loading bone. A relatively short period of loading resulted in a dramatic increase in bone volume, which surpassed that seen by, for example, radical surgical methods [4]. The speed of bone deposition required for such a large increase in bone cross-sectional area (figure 7) over 28 days would require a minimum of 10 µm in transverse bone growth a day. Bone has a highly ordered structure, and mature bone cells are highly differentiated, so the deposition of bone is an iterative surface-bound (and often time-consuming) process. In rats, the surface deposition of bone by osteoblastic apposition has a maximal rate in the region of 3.5 µm a day [44]. By contrast, cartilage is able to dramatically increase its volume, as its cells are capable of division and hypertrophy across its volume. This capability can be seen in the growth plates, for which the growth rate can be up to 125 µm per day in rats [45]. The chondrocytes then undergo cell death, and are replaced by bone cells. This mechanism provides a mechanically sound structure capable of faster growth than direct growth of bone. The presence of chondrocytes within the region of new bone reported here implies that the adaptive response of the tibia to the muscle load was initially a rapid phase of cartilage growth followed by endochondral ossification. Investigation of our EMS model at earlier time points will help reveal the exact nature of the response.
The elastic modulus of bone is indicative of its overall mechanical performance and reflects microstructural changes. Nanoindentation analysis showed that the region of new bone (region B, figure 8b) has a far lower elastic modulus than the established bone (region A, figure 11). Newly deposited bone is less stiff when compared with established bone [46,47], largely owing to a lower mineral content. This discrepancy in moduli quickly diminishes as new bone mineralizes, with bone reaching a similar indentation modulus to established bone within 4 days of deposition in rats [47]. The mineralization process is not the only factor influencing the mechanical properties of bone. Increased porosity decreases bone stiffness [48], and the presence of chondrocytes is also likely to decrease stiffness as cartilage has a far lower modulus than bone [49]. The lower elastic modulus of the region B is likely to be a combination of the relative immaturity of the bone (a lack of mineral), presence of chondrocytes and a higher porosity than region A (figure 9).
The skeleton is shaped by the effects of the forces it experiences, with an increase in strain resulting in bone deposition and a decrease in strain resulting in bone absorption [50]. This was originally thought to be governed by specific strain thresholds, with strains above 1500 µɛ resulting in bone growth [51]. Later work in rats has shown that no bone response was shown below strains of 1050 µɛ [6]. This is still higher than the strains recorded in our FE model (640 µɛ), albeit limited to a quasi-static simulation of just one contraction. As such our results underline the importance of factors other than the magnitude of the load, both in terms of the force applied and the strains produced, in determining an osteogenic response [52]. This is especially interesting in the light of the work of Turner et al. [6]. Here, we used approximately 2880 cycles per day, resulting in a total of 9.6 min of 10 N loading per day and provoking a large region of bone growth. In Turner et al.'s experiments, it was found that the lower limit for bone formation was 40 N; however, the loading protocol involved only 36 cycles per day, totalling 10.8 min of 40 N of loading per day. So, while the overall loading time is fairly similar, applying loads more frequently (and possibly at a higher rate) appears to have a greater effect than simply increasing the magnitude of the load, assuming the nature of the adaptive response was similar to the apparent endochondral process reported for the first time here. The exact mechanism for the response reported here is not fully understood, but it seems likely that the mechanical stimulus initiates the recruitment of precursor cells, possibly mesenchymal stem cells [53]. The differentiation and eventual fate of mesenchymal cells are controlled by biomechanical factors [54], with compressive forces resulting in cartilage. If continuous compression is applied then cartilage will remain, but if it is intermittent, then chondrocytes undergo endochondral ossification to become bone [55]. Our FEA model shows that this region is intermittently exposed to compressive forces, which could explain the clusters of cartilage seen within the primary osteon formation.
This study shows the value of EMS for skeletal biology, with a relatively short experimental period resulting in dramatic bone growth, both in terms of the volume generated and the time scale over which it was achieved. Such findings suggest that a carefully designed muscle stimulation protocol could offer targeted bone growth to at-risk regions of bone. This is a significant finding in the light of the ageing population and the burden of bone disease for healthcare providers.
Supplementary Material
Acknowledgements
The authors acknowledge Craig Keenan and David Atkinson for their expertise and assistance in experimental work.
All experiments received ethical approval and were carried out in strict accordance with the Animals (Scientific Procedures) Act of 1986.
Data accessibility
Raw data for muscle and bone measurements can be found in the electronic supplementary material.
Funding statement
We thank the EPSRC-supported Henry Moseley X-ray Imaging Facility (University of Manchester) and the School of Engineering's metallography laboratory (University of Liverpool) for the use of their facilities. P.V. was supported by a scholarship from the Institute of Ageing and Chronic Disease, University of Liverpool.
References
- 1.Wolff J. 1892. Das gesetz der transformation der knochen. Deutsche Medizinische Wochenschrift 19, 1222–1224. ( 10.1055/s-0028-1144106) [DOI] [Google Scholar]
- 2.Bertram JEA, Swartz SM. 1991. The ‘law of bone transformation’: a case of crying Wolff? Biol. Rev. 66, 245–273. ( 10.1111/j.1469-185X.1991.tb01142.x) [DOI] [PubMed] [Google Scholar]
- 3.Ruff C, Holt B, Trinkaus E. 2006. Who's afraid of the big bad Wolff? ‘Wolff's law’ and bone functional adaptation. Am. J. Phys. Anthropol. 129, 484–498. ( 10.1002/ajpa.20371) [DOI] [PubMed] [Google Scholar]
- 4.Lanyon LE, Goodship AE, Pye CJ, MacFie JH. 1982. Mechanically adaptive bone remodelling. J. Biomech. 15, 141–154. ( 10.1016/0021-9290(82)90246-9) [DOI] [PubMed] [Google Scholar]
- 5.Akhter MP, Cullen DM, Pedersen EA, Kimmel DB, Recker RR. 1998. Bone response to in vivo mechanical loading in two breeds of mice. Calcified Tissue Int. 63, 442–449. ( 10.1007/s002239900554) [DOI] [PubMed] [Google Scholar]
- 6.Turner CH, Forwood MR, Rho J-Y, Yoshikawa T. 1994. Mechanical loading thresholds for lamellar and woven bone formation. J. Bone Miner. Res. 9, 87–97. ( 10.1002/jbmr.5650090113) [DOI] [PubMed] [Google Scholar]
- 7.Gross TS, Srinivasan S, Liu CC, Clemens TL, Bain SD. 2002. Noninvasive loading of the murine tibia: an in vivo model for the study of mechanotransduction. J. Bone Miner. Res. 17, 493–501. ( 10.1359/jbmr.2002.17.3.493) [DOI] [PMC free article] [PubMed] [Google Scholar]
- 8.Poulet B, Hamilton RW, Shefelbine S, Pitsillides AA. 2011. Characterizing a novel and adjustable noninvasive murine joint loading model. Arthritis Rheum. 63, 137–147. ( 10.1002/art.27765) [DOI] [PubMed] [Google Scholar]
- 9.Hamann N, Kohler T, Muller R, Braggemann G-P, Niehoff A. 2012. The effect of level and downhill running on cortical and trabecular bone in growing rats. Calcified Tissue Int. 90, 429–437. ( 10.1007/s00223-012-9593-6) [DOI] [PubMed] [Google Scholar]
- 10.Umemura Y, Ishiko T, Yamauchi T, Kurono M, Mashiko S. 1997. Five jumps per day increase bone mass and breaking force in rats. J. Bone Miner. Res. 12, 1480–1485. ( 10.1359/jbmr.1997.12.9.1480) [DOI] [PubMed] [Google Scholar]
- 11.Buie HR, Boyd SK. 2010. Reduced bone mass accrual in swim-trained prepubertal mice. Med. Sci. Sports Exerc. 42, 1834–1842. ( 10.1249/MSS.0b013e3181dd25d4) [DOI] [PubMed] [Google Scholar]
- 12.Salmons S. 2009. Adaptive change in electrically stimulated muscle: a framework for the design of clinical protocols. Muscle Nerve 40, 918–935. ( 10.1002/mus.21497) [DOI] [PubMed] [Google Scholar]
- 13.Jeffery NS, Stephenson RS, Gallagher JA, Jarvis JC, Cox PG. 2011. Micro-computed tomography with iodine staining resolves the arrangement of muscle fibres. J. Biomech. 44, 189–192. ( 10.1016/j.jbiomech.2010.08.027) [DOI] [PubMed] [Google Scholar]
- 14.Stephenson RS, et al. 2012. Contrast enhanced micro-computed tomography resolves the 3-dimensional morphology of the cardiac conduction system in mammalian hearts. PLoS ONE 7, e35299 ( 10.1371/journal.pone.0035299) [DOI] [PMC free article] [PubMed] [Google Scholar]
- 15.Vickerton P, Jarvis J, Jeffery N. 2013. Concentration-dependent specimen shrinkage in iodine-enhanced microCT. J. Anat. 223, 185–193. ( 10.1111/joa.12068) [DOI] [PMC free article] [PubMed] [Google Scholar]
- 16.Cox PG, Fagan MJ, Rayfield EJ, Jeffery N. 2011. Finite element modelling of squirrel, guinea pig and rat skulls: using geometric morphometrics to assess sensitivity. J. Anat. 219, 696–709. ( 10.1111/j.1469-7580.2011.01436.x) [DOI] [PMC free article] [PubMed] [Google Scholar]
- 17.Cox PG, Rayfield EJ, Fagan MJ, Herrel A, Pataky TC, Jeffery N. 2012. Functional evolution of the feeding system in rodents. PLoS ONE 7, e36299 ( 10.1371/journal.pone.0036299) [DOI] [PMC free article] [PubMed] [Google Scholar]
- 18.O'Hare L, et al. 2012. Finite element analysis of stress in the equine proximal phalanx. Equine Vet. J. 45, 273–277. ( 10.1111/j.2042-3306.2012.00635.x) [DOI] [PubMed] [Google Scholar]
- 19.Russold M, Jarvis JC. 2007. Implantable stimulator featuring multiple programs, adjustable stimulation amplitude and bi-directional communication for implantation in mice. Med. Biol. Eng. Comput. 45, 695–699. ( 10.1007/s11517-007-0190-1) [DOI] [PubMed] [Google Scholar]
- 20.Schneider CA, Rasband WS, Eliceiri KW. 2012. NIH Image to ImageJ: 25 years of image analysis. Nat. Methods 9, 671–675. ( 10.1038/nmeth.2089) [DOI] [PMC free article] [PubMed] [Google Scholar]
- 21.Merzin M. 2008. Applying stereological method in radiology: volume measurement. Bachelor's thesis, University of Tartu, Estonia. [Google Scholar]
- 22.Strait DS, Wang Q, Dechow PC, Ross CF, Richmond BG, Spencer MA, Patel BA. 2005. Modeling elastic properties in finite-element analysis: how much precision is needed to produce an accurate model? Anat. Rec. A, Discov. Mol. Cell. Evol. Biol. 283, 275–287. ( 10.1002/ar.a.20172) [DOI] [PubMed] [Google Scholar]
- 23.Johnson WL, Jindrich DL, Roy RR, Edgerton VR. 2008. A three-dimensional model of the rat hindlimb: musculoskeletal geometry and muscle moment arms. J. Biomech. 41, 610–619. ( 10.1016/j.jbiomech.2007.10.004) [DOI] [PMC free article] [PubMed] [Google Scholar]
- 24.Doube M, et al. 2010. BoneJ: free and extensible bone image analysis in ImageJ. Bone 47, 1076–1079. ( 10.1016/j.bone.2010.08.023) [DOI] [PMC free article] [PubMed] [Google Scholar]
- 25.Klingenberg CP. 2011. MorphoJ: an integrated software package for geometric morphometrics. Mol. Ecol. Resour. 11, 353–357. ( 10.1111/j.1755-0998.2010.02924.x) [DOI] [PubMed] [Google Scholar]
- 26.Maas SA, Ellis BJ, Ateshian GA, Weiss JA. 2012. FEBio: finite elements for biomechanics. J. Biomech. Eng. 134, 011005 ( 10.1115/1.4005694) [DOI] [PMC free article] [PubMed] [Google Scholar]
- 27.Jämsä T, Rho J-Y, Fan Z, MacKay CA, Marks SC, Tuukkanen J. 2002. Mechanical properties in long bones of rat osteopetrotic mutations. J. Biomech. 35, 161–165. ( 10.1016/S0021-9290(01)00203-2) [DOI] [PubMed] [Google Scholar]
- 28.Turner CH, Burr DB. 1993. Basic biomechanical measurements of bone: a tutorial. Bone 14, 595–608. ( 10.1016/8756-3282(93)90081-K) [DOI] [PubMed] [Google Scholar]
- 29.Rho J-Y, Tsui TY, Pharr GM. 1997. Elastic properties of human cortical and trabecular lamellar bone measured by nanoindentation. Biomaterials 18, 1325–1330. ( 10.1016/S0142-9612(97)00073-2) [DOI] [PubMed] [Google Scholar]
- 30.Akhtar R, Daymond MR, Almer JD, Mummery PM. 2008. Load transfer in bovine plexiform bone determined by synchrotron X-ray diffraction. J. Mater. Res. 23, 543–550. ( 10.1557/JMR.2008.0068) [DOI] [PubMed] [Google Scholar]
- 31.Gefen A, Dilmoney B. 2007. Mechanics of the normal woman's breast. Technol. Health Care 15, 259–271. [PubMed] [Google Scholar]
- 32.Erdemir ASS. 2010. Open knee: a three-dimensional finite element representation of the knee joint. User's Guide, v. 1.0.0. Cleveland, OH: Lerner Research Institute.
- 33.Sibole S, Bennetts C, Borotikar B, Maas S, van den Bogert AJ, Weiss JA, Erdemir A. 2010. Open knee: a 3D finite element representation of the knee joint. In 34th Annual Meeting of the American Society of Biomechanics, August 18–21 Providence, RI: Brown University. [Google Scholar]
- 34.Torcasio A, Zhang X, Duyck J, Lenthe GH. 2012. 3D characterization of bone strains in the rat tibia loading model. Biomech. Model. Mechanobiol. 11, 403–410. ( 10.1007/s10237-011-0320-4) [DOI] [PubMed] [Google Scholar]
- 35.Tunell GL, Hart MN. 1977. Simultaneous determination of skeletal muscle fiber, types I, IIA, and IIB by histochemistry. Arch. Neurol. 34, 171 ( 10.1001/archneur.1977.00500150057011) [DOI] [PubMed] [Google Scholar]
- 36.Li X, Bhushan B. 2002. A review of nanoindentation continuous stiffness measurement technique and its applications. Mater. Character. 48, 11–36. ( 10.1016/S1044-5803(02)00192-4) [DOI] [Google Scholar]
- 37.Jarvis JC, et al. 1996. Fast-to-slow transformation in stimulated rat muscle. Muscle Nerve 19, 1469–1475. () [DOI] [PubMed] [Google Scholar]
- 38.Jarvis JC. 1993. Power production and working capacity of rabbit tibialis anterior muscles after chronic electrical stimulation at 10 Hz. J. Physiol. 470, 157–169. [DOI] [PMC free article] [PubMed] [Google Scholar]
- 39.Salmons S, Sreter F. 1976. Significance of impulse activity in the transformation of skeletal muscle type. Nature 263, 30–34. ( 10.1038/263030a0) [DOI] [PubMed] [Google Scholar]
- 40.Qin W, et al. 2013. The CNS-independent anti-bone resorptive activity of muscle contraction and the underlying molecular and cellular signatures. J. Biol. Chem. 288, 13 511–13 521. ( 10.1074/jbc.M113.454892) [DOI] [PMC free article] [PubMed] [Google Scholar]
- 41.Pullen A. 1977. The distribution and relative sizes of three histochemical fibre types in the rat tibialis anterior muscle. J. Anat. 123, 1. [PMC free article] [PubMed] [Google Scholar]
- 42.Gollnick PD, King DW. 1969. Effect of exercise and training on mitochondria of rat skeletal muscle. Am. J. Physiol. Legacy Content 216, 1502–1509. [DOI] [PubMed] [Google Scholar]
- 43.Green HJ, Klug GA, Reichmann H, Seedorf U, Wiehrer W, Pette D. 1984. Exercise-induced fibre type transitions with regard to myosin, parvalbumin, and sarcoplasmic reticulum in muscles of the rat. Pflügers Archiv. 400, 432–438. ( 10.1007/BF00587545) [DOI] [PubMed] [Google Scholar]
- 44.McBride SH, Silva MJ. 2012. Adaptive and injury response of bone to mechanical loading. BoneKEy Osteovision 1, 192. [DOI] [PMC free article] [PubMed] [Google Scholar]
- 45.Kember NF. 1960. Cell division in endochondral ossification: a study of cell proliferation in rat bones by the method of tritiated thymidine autoradiography. J. Bone Joint Surg. 42B, 824–839. [PubMed] [Google Scholar]
- 46.Gourion-Arsiquaud S, Burket JC, Havill LM, DiCarlo E, Doty SB, Mendelsohn R, van der Meulen MCH, Boskey AL. 2009. Spatial variation in osteonal bone properties relative to tissue and animal age. J. Bone Miner. Res. 24, 1271–1281. ( 10.1359/jbmr.090201) [DOI] [PMC free article] [PubMed] [Google Scholar]
- 47.Donnelly E, et al. 2010. Effects of tissue age on bone tissue material composition and nanomechanical properties in the rat cortex. J. Biomed. Mater. Res. A 92, 1048–1056. ( 10.1002/jbm.a.32442.) [DOI] [PMC free article] [PubMed] [Google Scholar]
- 48.Currey JD. 1988. The effect of porosity and mineral content on the Young's modulus of elasticity of compact bone. J. Biomech. 21, 131–139. ( 10.1016/0021-9290(88)90006-1) [DOI] [PubMed] [Google Scholar]
- 49.Radhakrishnan P, Lewis N, Mao J. 2004. Zone-specific micromechanical properties of the extracellular matrices of growth plate cartilage. Ann. Biomed. Eng. 32, 284–291. ( 10.1023/B:ABME.0000012748.41851.b4) [DOI] [PubMed] [Google Scholar]
- 50.Ozcivici E, Luu YK, Adler B, Qin Y-X, Rubin J, Judex S, Rubin CT. 2010. Mechanical signals as anabolic agents in bone. Nat. Rev. Rheumatol. 6, 50–59. ( 10.1038/nrrheum.2009.239) [DOI] [PMC free article] [PubMed] [Google Scholar]
- 51.Frost HM. 1987. Bone ‘mass’ and the ‘mechanostat’: a proposal. Anat. Rec. 219, 1–9. ( 10.1002/ar.1092190104) [DOI] [PubMed] [Google Scholar]
- 52.Qin Y-X, Rubin CT, McLeod KJ. 1998. Nonlinear dependence of loading intensity and cycle number in the maintenance of bone mass and morphology. J. Orthop. Res. 16, 482–489. ( 10.1002/jor.1100160414) [DOI] [PubMed] [Google Scholar]
- 53.Marsell R, Einhorn TA. 2011. The biology of fracture healing. Injury 42, 551–555. ( 10.1016/j.injury.2011.03.031) [DOI] [PMC free article] [PubMed] [Google Scholar]
- 54.Roux W. 1912. Anpassungslehre, Histomechanik und Histochemie. Virchows Arch. Pathol. Anat. Physiol. Klin. Med. 209, 168–209. [Google Scholar]
- 55.Shapiro F. 2008. Bone development and its relation to fracture repair: the role of mesenchymal osteoblasts and surface osteoblasts. Eur. Cell Mater. 15, 53–76. [DOI] [PubMed] [Google Scholar]
Associated Data
This section collects any data citations, data availability statements, or supplementary materials included in this article.
Supplementary Materials
Data Availability Statement
Raw data for muscle and bone measurements can be found in the electronic supplementary material.


