

Abstract
A promising, new, in vivo prostate dosimetry system has been developed for clinical radiation therapy. This work outlines the preliminary end-to-end testing of the accuracy and precision of the new OARtrac scintillation dosimetry system. We tested 94 calibrated plastic scintillation detector (PSD) probes before their final integration into endorectal balloon assemblies. These probes had been calibrated at The University of Texas MD Anderson Cancer Center Dosimetry Laboratory (MDADL). We used a complete clinical OARtrac system including the PSD probes, charge coupled device (CCD camera) monitoring system, and the manufacturer’s integrated software package. The PSD probes were irradiated at 6 MV in a Solid Water® phantom. Irradiations were performed with a 6 MV linear accelerator using anterior-posterior/posterior-anterior (AP/PA) matched fields to a maximum dose of 200 cGy in a 100 cm source-axis distance (SAD geometry. As a whole, the OARtrac system has good accuracy with a mean error of 0.01% and an error spread of ± 5.4% at the 95% confidence interval. These results reflect the PSD probes’ accuracy before their final insertion into endorectal balloons. Future work will test the dosimetric effects of mounting the PSD probes within the endorectal balloon assemblies.
1. Introduction
External beam radiotherapy for the prostate must be carefully planned and delivered to provide the required dose to the target organ while sparing the radio-sensitive bladder and rectal structures. Achieving these goals often requires a sharp dose gradient at the rectoprostatic interface. Sudden anatomic changes such as the accumulation of colorectal gas or patient movement can result in dose deviations at the rectal wall (de Crevoisier et al., 2005). In vivo dosimetry combined with a prostate immobilization device such as an endorectal balloon potentially offers a means of simultaneously mitigating the effects of prostate motion and monitoring true anterior wall rectal dose (Hardcastle et al., 2010). In this work, we describe and evaluate the dosimetric accuracy and precision of a promising new dosimetry system designed to achieve these goals.
The OARtrac® system (RadiaDyne, LLC., Houston, TX) is a new in vivo scintillation dosimetry system designed to measure rectal wall dose during prostate radiotherapy procedures. In its complete form, the OARtrac® system consists of four main components: 1) a disposable endorectal balloon assembly embedded with two independent plastic scintillation radiation detectors that together with a duplex fiber-optical connector constitute a PSD probe assembly; 2) a permanently routed fiber optical cable that transmits detector signals out of the treatment vault; 3) an optics box with a charge coupled device (CCD camera) that measures the scintillator output signal (figure 1); and 4) a personal computer-based software readout system located in the control room of the linear accelerator treatment machine. (OARtrac is meant to stand for Organ At Risk tracking).
Figure 1.
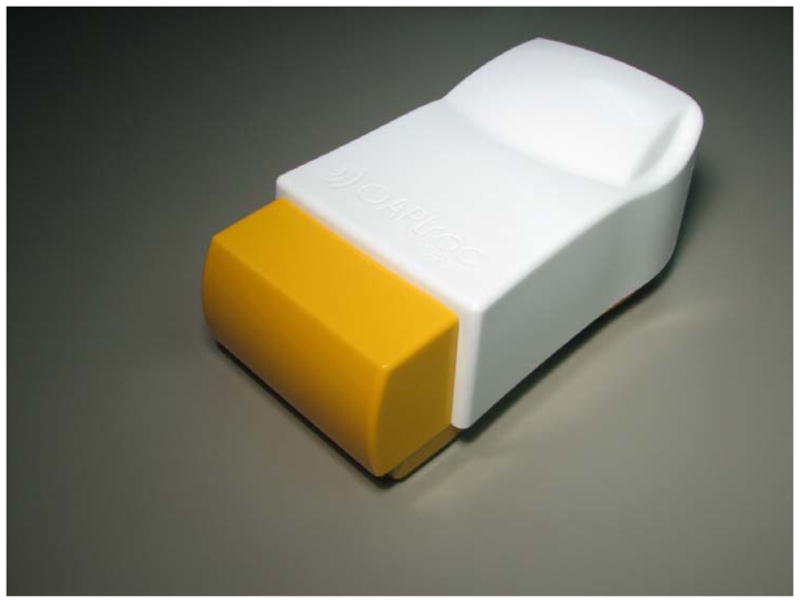
OARtrac optics box containing the optics and CCD camera. This unit is normally placed within the treatment vault control room along with the analysis computer. A long fiber optic cable is permanently routed through the treatment vault walls connecting the balloon-mounted PSD probes to the optics box shown here.
The plastic scintillation detector (PSD) probes are independently calibrated by The University of Texas MD Anderson Dosimetry Laboratory (MDADL). Each PSD probe is labeled with barcoded calibration factors to allow both internal PSD’s calibration factors to be transferred simply to the monitoring software system. Each PSD probe will be sealed within an endorectal balloon post calibration and will be sold in pre-calibrated lots to clinical users. Clinical users will monitor the PSD probes during radiation treatments through their permanently installed CCD camera systems mounted within their accelerator vault control rooms.
The OARtrac system is novel in that it is a scintillation dosimetry system with interchangeable and disposable, pre-calibrated detector cables. Disposable PSD probe assemblies allow for convenient and sanitary clinical use. To our knowledge no scintillation detector systems like this have been discussed in the literature.
This study measures the accuracy and precision of the end-to-end detector system prior to the final manufacturing step of mounting the endorectal balloon assemblies onto the PSD probes.
2. Methods and Materials
The PSD probes used for this study were produced by RadiaDyne as part of the OARtrac dosimetry system and consist of two side by side PSDs similar to those used in the in vivo study by Wootton et al, 2014. Each individual PSD consists of a plastic scintillating fiber optically coupled to a clear optical fiber, both of which are encased in an opaque flexible plastic jacketing. The plastic scintillating fiber was 2 mm long and 1 mm in diameter, resulting in an active detector volume of 0.00157 cm3. A duplex optical connector was placed at the end of each probe to allow for convenient use and consistent transmission of scintillation light from the two PSDs to a CCD camera for quantification. The two individual PSDs in the PSD probe are independently read by the OARtrac system using the chromatic removal technique (Fontbonne et al., 2002; Archambault et al., 2005), which provides dose measurements at two distinct points simultaneously. Each PSD probe also contains a single 1.0 mm diameter tantalum fiducial for localization of the PSDs through x-ray imaging (figures 2 and 3). The endorectal balloon assembly contains a second 1 mm diameter tantalum fiducial to improve the localization accuracy. Tantalum fiducials are non-ferromagnetic and compatible for use in MRI imaging as well as x-ray imaging.
Figure 2.
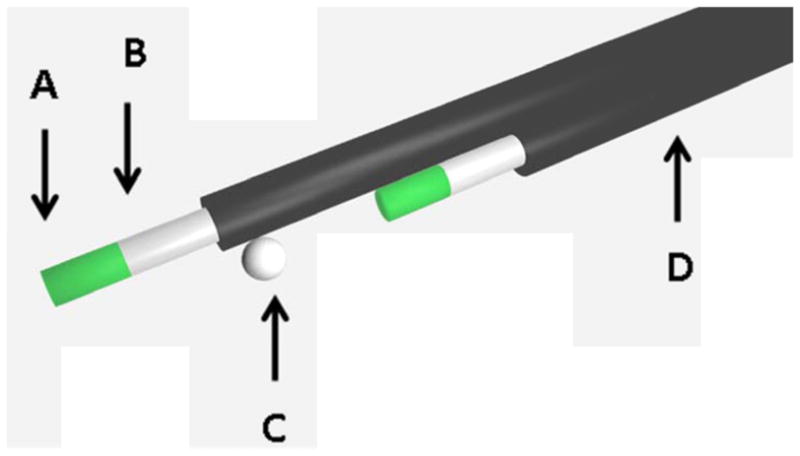
Scale model of PSD probe detector layout showing both scintillator fibers and tantalum fiducial placement. A) A 2 mm length of scintillating fiber (in two places, spaced 15 mm apart). B) A plastic optical fiber that transmits emitted light to the CCD camera (in two places). C) A tantalum fiducial (1.0 mm in diameter) for visualization on computed tomographic images. D) A polyethylene jacket that prevents external light contamination (in two places).
Figure 3.
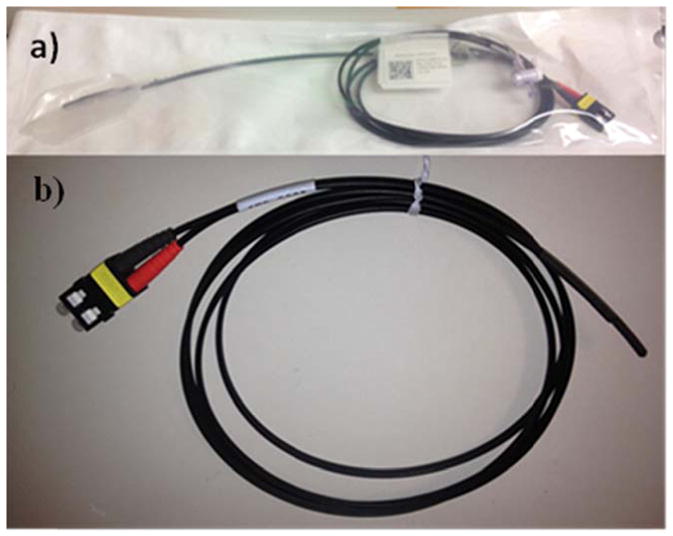
(a) An endorectal balloon-mounted PSD probe. The probe comes calibrated with barcoded calibration factors that the end user scans into the readout system. (b) The bare PSD probe prior to being mounted in the endorectal balloon.
The PSD probes were used prior to the final manufacturing stage, in which they are mounted within the anterior surface of endorectal balloons inflated to 60 cm3 parallel to the axis of the balloon. We distinguish between the two PSDs by referring to them as the distal PSD and the proximal PSD. Once mounted in the balloons, both of the PSDs within the probe will be in contact with the anterior rectal wall directly posterior to the prostate. The distal PSD will extend 15 mm farther than the proximal PSD in the direction of the balloon axis in order to allow dose measurements near the apex and base of the prostate simultaneously. 119 PSD probes (containing 238 sensors) were independently calibrated at the MDADL using a Theratron 780 C 60Co irradiator unit (MDS Nordion, Ontario, Canada). The same independent calibration process will be used once the probes become commercially available. Calibration coefficients were printed and attached as barcoded labels to each of the PSD probe assemblies. The labels can be read into the OARtrac system using a barcode scanner included with the system. The MDADL calibration procedure rejected 25 of the 119 PSD probe assemblies. Calibration failure was defined as occurring when either of the two independent PSD calibrations fell outside manufacturing limits (defined as the running average calibration factor ± 2 standard deviations). Thus, 94 calibrated PSD probes (containing 188 PSD sensors) were tested in this study.
For all measurements, detectors were mounted centrally into a two-piece Solid Water® phantom measuring 20 cm × 20 cm and 10 cm in thickness. The sensors were positioned at a source-to-axis distance of 100 cm and a depth of 5 cm within a treatment field of 10 cm × 10 cm centered on the phantom. A horizontal groove was milled into the bottom half of the phantom to position the bare PSD probe and remove air gaps. The top half of the phantom is a solid, 5 cm thick, 20 cm × 20 cm slab that rests directly upon the lower half, sandwiching the PSD probe between the halves.
Because the output of some plastic scintillation detectors is temperature dependent (Beddar, 2012) (Wootton and Beddar, 2013), the OARtrac system was designed to automatically compensate for temperature when processing data, by means of empirical correction factors that are based on a user-entered temperature. Accordingly, to improve dose measurement accuracy, room temperature was measured and entered into the manufacturer’s acquisition software before each PSD probe measurement was taken. The clinical system is designed to measure dose at body temperature but can be used at other detector temperatures as well.
A Varian 600 linear accelerator (Varian, Palo Alto, CA) was used to irradiate the sensors. Opposed anterior-posterior/posterior-anterior (AP/PA), matched 6 MV beams were used for a total delivered detector dose of 200 cGy. Care was taken to ensure that the linear accelerator was properly warmed up before test data were acquired. Machine output was monitored each morning of testing using a Daily QA 3 calibrated diode array (Sun Nuclear, Melbourne, FL). All irradiations were corrected i.e., the number of monitor units delivered for each beam, for daily machine output fluctuations to deliver 200 cGy. Treatment couch beam attenuation was minimal (<1%) and was therefore ignored for this accelerator. Each PSD probe was irradiated five times and sensor outputs were averaged over these five runs.
Data were analyzed for the proximal sensors alone, the distal sensors alone, and all sensors together. For each group, we calculated the average deviation from the expected dose—i.e., the difference between the average measured dose for each sensor and the expected dose. Additionally, the standard deviation and 95% confidence interval (CI) were calculated for the measurements.
3. Results
We looked at the both the proximal and distal sensors separately for each measurement and for all sensor measurements together for this analysis. We irradiated each PSD probe to 200 cGy. The 94 distal sensors had an average dose response of 197.4 cGy (95% CI: cGy to 208.3 cGy (± 5.3%)). The results of the end-to-end testing of the distal sensors are shown in figure 4. The 94 proximal sensors had an average dose response of 202.3 cGy (95% confidence interval: 193.3 cGy to 211.3 cGy (± 4.5%)). The results of the end-to-end testing for the proximal sensors are shown in figure 5. The complete set of 188 distal and proximal sensors had an average dose response of 200.0 cGy with (95% CI: 189.2 cGy to 210.8 cGy (± 5.4%)). The mean dose error of all 188 distal and proximal sensors combined was 0.01%. The total sensor results for the end-to-end testing are shown in figure 6.
Figure 4.

Error distribution for the raw distal sensor data. The ordinate represents the number of sensors and the abscissa represents the % error from 200 cGy, the delivered dose. A best fit normal distribution has been laid over this plot for reference.
Figure 5.

Error distribution for the raw proximal sensor data. The ordinate represents the number of sensors and the abscissa represents the % error from cGy, the delivered dose. A best fit normal distribution has been laid over this plot for reference
Figure 6.

Error distribution for both the raw distal and proximal sensor data. The ordinate represents the number of sensors and the abscissa represents the % error from 200 cGy, the delivered dose. A best fit normal distribution has been laid over this plot for reference.
We also wanted to determine whether system output analysis was influenced by outliers. We used the Thompson Tau method (Thompson, 1935) to identify outliers and exclude them from the distributions. We used a two-sided test with a significance level of α = 0.05 for the outlier removal process. Nine distal sensors were determined to be outliers. The remaining 85 distal sensors had an average dose response of 197.6 cGy (95% CI: 189.2 cGy to 206.0 cGy (± 4.2%)). The filtered distal results for the end-to-end testing are shown in figure 7. Ten proximal sensors were determined to be outliers. The remaining 84 proximal sensors had an average dose response of 202.2 cGy (95% CI: 195.4 cGy to 209.0 cGy (± 3.4%)). The filtered proximal results for the end-to-end testing are shown in figure 8. In the combined set of distal and proximal sensors, 13 sensors were determined to be outliers. The remaining set of 175 distal and proximal sensors had an average dose response of 200.0 cGy (95% CI: 191.0 cGy to 209.0 cGy (± 4.5%)). The mean dose error of the 175 filtered combined distal and proximal sensors was 0.03%. These results for the end-to-end testing are shown in figure 9.
Figure 7.

Error distribution for the distal sensor data with outliers removed using a Thompson Tau removal technique (significance level: α = 0.05). The ordinate represents the number of sensors and the abscissa represents the % error from 200 cGy, the delivered dose. A best fit normal distribution has been laid over this plot for reference.
Figure 8.

Error distribution for the proximal sensor data with outliers removed using a Thompson Tau removal technique (significance level: α= 0.05). The ordinate represents the number of sensors and the abscissa represents the % error from 200 cGy, the delivered dose. A best fit normal distribution has been laid over this plot for reference.
Figure 9.

Error distribution for the distal and proximal sensor data with outliers removed via a Thompson Tau removal technique (significance level: α = 0.05). The ordinate represents the number of sensors and the abscissa represents the % error from 200 cGy, the delivered dose. A best fit normal distribution has been laid over this plot for reference.
4. Discussion
Scintillator detectors are well suited for in vivo dosimetry because they work passively unlike ion chambers, which require high voltage. Scintillator detectors are also nearly water equivalent, unlike MOSFETs (metal oxide semiconductor field effect transistors) and diode detectors. Additionally, scintillator detectors are well known for their dose linearity and high spatial resolution (Beddar et al., 1992b, a; Fontbonne et al., 2002; Archambault et al., 2005; Beddar, 2006; Archambault et al., 2006; Lambert et al., 2007; Archambault et al., 2007; Lacroix et al., 2008)
In addition to knowing the average sensor response and standard deviation, we wanted to quantify the level of dosimetric outliers amongst the tested PSD probes. Large dosimetric outliers among the PSD probes are undesirable for a clinically used detector system. We used the Thompson Tau technique (Thompson, 1935) to find and discard potential statistical outliers amongst the PSD probes to see if there was any significant effect on the dosimetric results due to outliers. We found that outlier removal ultimately had little effect on the sensor distribution’s average dose error or dose response error confidence interval. We conclude the OARtrac system is quite consistent and essentially unaffected by manufacturing outliers amongst the PSD probes.
This initial testing of the OARtrac in vivo dosimetry system is essential to get a clear estimate of the expected accuracy that the manufacturing process can produce before PSD probes are permanently mounted in endorectal balloons. These tests measure the accuracy and precision of the OARtrac system including measurement variations introduced from manufacturing differences in the PSD probes as well as the connection uncertainty introduced by the unique fiber optical connector design.
5. Conclusion
We found the OARtrac system to be highly accurate, with an average dose error of only 0.01% from the expected value at dose levels of 200 cGy. We measured an overall error spread of ±5.4% relative to the 95% confidence interval (±2.7% 1σ interval). Individual distal and proximal offsets are within the statistical uncertainty of our tests. OARtrac should therefore be a very accurate and useful tool for dose monitoring.
Additionally, we found that the removal of outliers (significance level of α = 0.05) did not significantly change the overall error distribution, accuracy, or precision and thus demonstrated the robustness of the OARtrac system performance and calibration procedure.
Future work will include quantifying the dosimetric effects of mounting the PSD probes within the endorectal balloon assemblies.
Acknowledgments
This work was supported in part by a National Cancer Institute grant (1R01CA120198-01A2). Sam Beddar would like to acknowledge additional partial funding from RadiaDyne, LLC, Houston, TX, through Sponsored Research Agreements.
References
- Archambault L, Arsenault J, Gingras L, Beddar AS, Roy R, Beaulieu L. Plastic scintillation dosimetry: optimal selection of scintillating fibers and scintillators. Med Phys. 2005;32:2271–8. doi: 10.1118/1.1943807. [DOI] [PubMed] [Google Scholar]
- Archambault L, Beddar AS, Gingras L, Lacroix F, Roy R, Beaulieu L. Water-equivalent dosimeter array for small-field external beam radiotherapy. Med Phys. 2007;34:1583–92. doi: 10.1118/1.2719363. [DOI] [PubMed] [Google Scholar]
- Archambault L, Beddar AS, Gingras L, Roy R, Beaulieu L. Measurement accuracy and cerenkov removal for high performance, high spatial resolution scintillation dosimetry. Med Phys. 2006;33:128–35. doi: 10.1118/1.2138010. [DOI] [PubMed] [Google Scholar]
- Beddar AS. Water equivalent plastic scintillation detectors in radiation therapy. Radiat Prot Dosimetry. 2006;120:1–6. doi: 10.1093/rpd/nci694. [DOI] [PubMed] [Google Scholar]
- Beddar AS, Mackie TR, Attix FH. Water-equivalent plastic scintillation detectors for high-energy beam dosimetry: I. Physical characteristics and theoretical considerations. Phys Med Biol. 1992a;37:1883–900. doi: 10.1088/0031-9155/37/10/006. [DOI] [PubMed] [Google Scholar]
- Beddar AS, Mackie TR, Attix FH. Water-equivalent plastic scintillation detectors for high-energy beam dosimetry: II. Properties and measurements. Phys Med Biol. 1992b;37:1901–13. doi: 10.1088/0031-9155/37/10/007. [DOI] [PubMed] [Google Scholar]
- Beddar S. On possible temperature dependence of plastic scintillator response. Med Phys. 2012;39:6522. doi: 10.1118/1.4748508. [DOI] [PubMed] [Google Scholar]
- de Crevoisier R, Tucker SL, Dong L, Mohan R, Cheung R, Cox JD, Kuban DA. Increased risk of biochemical and local failure in patients with distended rectum on the planning CT for prostate cancer radiotherapy. Int J Radiat Oncol Biol Phys. 2005;62:965–73. doi: 10.1016/j.ijrobp.2004.11.032. [DOI] [PubMed] [Google Scholar]
- Fontbonne JM, Iltis G, Ban G, Battala A, Vernhes JC, Tillier J, Bellaize N, Le Brun C, Tamain B, Mercier K, Motin JC. Scintillating fiber dosimeter for radiation therapy accelerator. Nuclear Science, IEEE Transactions on. 2002;49:2223–7. [Google Scholar]
- Hardcastle N, Cutajar DL, Metcalfe PE, Lerch MLF, Perevertaylo VL, Tome WA, Rosenfeld AB. In vivo real-time rectal wall dosimetry for prostate radiotherapy. Phys Med Biol. 2010;55:3859–71. doi: 10.1088/0031-9155/55/13/019. [DOI] [PMC free article] [PubMed] [Google Scholar]
- Lacroix F, Archambault L, Gingras L, Guillot M, Beddar AS, Beaulieu L. Clinical prototype of a plastic water-equivalent scintillating fiber dosimeter array for QA applications. Med Phys. 2008;35:3682–90. doi: 10.1118/1.2953564. [DOI] [PubMed] [Google Scholar]
- Lambert J, Nakano T, Law S, Elsey J, McKenzie DR, Suchowerska N. In vivo dosimeters for HDR brachytherapy: a comparison of a diamond detector, MOSFET, TLD, and scintillation detector. Med Phys. 2007;34:1759–65. doi: 10.1118/1.2727248. [DOI] [PubMed] [Google Scholar]
- Thompson WR. On a criterion for the rejection of observations and the distribution of the ratio of deviation to sample standard deviation. The Annals of Mathematical Statistics. 1935;6:214–9. [Google Scholar]
- Wootton L, Beddar S. Temperature dependence of BCF plastic scintillation detectors. Physics in Medicine and Biology. 2013;58:2955–67. doi: 10.1088/0031-9155/58/9/2955. [DOI] [PMC free article] [PubMed] [Google Scholar]
- Wootton L, Kudchadker R, Lee A, Beddar S. Real-time in vivo rectal wall dosimetry using plastic scintillation detectors for patients with prostate cancer. Physics in Medicine and Biology. 2014 doi: 10.1088/0031-9155/59/3/647. (in press) [DOI] [PMC free article] [PubMed] [Google Scholar]