Abstract
In vitro, fibroblast growth factor-2 (FGF2) has been implicated in cardiomyocyte growth and reexpression of fetal contractile genes, both markers of hypertrophy. However, its in vivo role in cardiac hypertrophy during pressure overload is not well characterized. Mice with or without FGF2 (Fgf2+/+ and Fgf2–/–, respectively) were subjected to transverse aortic coarctation (AC). Left ventricular (LV) mass and wall thickness were assessed by echocardiography preoperatively and once a week postoperatively for 10 weeks. In vivo LV function during dobutamine stimulation, cardiomyocyte cross-sectional area, and recapitulation of fetal cardiac genes were also measured. AC Fgf2–/– mice develop significantly less hypertrophy (4–24% increase) compared with AC Fgf2+/+ mice (41–52% increase). Cardiomyocyte cross-sectional area is significantly reduced in AC Fgf2–/– mice. Noncoarcted (NC) and AC Fgf2–/– mice have similar β-adrenergic responses, but those of AC Fgf2+/+ mice are blunted. A lack of mitotic growth in both AC Fgf2+/+ and Fgf2–/– hearts indicates a hypertrophic response of cardiomyocytes. Consequently, FGF2 plays a major role in cardiac hypertrophy. Comparison of α- and β-cardiac myosin heavy chain mRNA and protein levels in NC and AC Fgf2+/+ and Fgf2–/– mice indicates that myosin heavy chain composition depends on hemodynamic stress rather than on FGF2 or hypertrophy, and that isoform switching is transcriptionally, not posttranscriptionally, regulated.
Introduction
Hypertrophy of the heart occurs in response to cardiac wall stress induced by pressure or volume overload (1, 2). This increase in hemodynamic load may be caused by a number of pathophysiological states, such as hypertension, aortic coarctation (AC), myocardial infarction, and valvular disease. The result is morphological, molecular, and functional changes including hypertrophy of cardiac myocytes, hyperplasia of nonmyocytes, accumulation of extracellular matrix proteins, and reexpression of fetal cardiac genes and other embryonic markers (1, 3).
Fibroblast growth factor-2 (FGF2) and other peptide growth factors have been implicated in the pathogenesis of cardiac hypertrophy (4–10). Parker et al. (4) demonstrated that the addition of FGF2 to cultured neonatal rat cardiac myocytes alters the gene profile of contractile proteins from an adult to a fetal program of gene expression. This repression of adult, or induction of embryonic, cardiac genes is characteristic of pressure overload–induced cardiac hypertrophy (3, 11–13). Furthermore, Kaye et al. (7) showed that paced adult rat cardiac myocytes exhibit a hypertrophic response, characterized by increases in protein content, phenylalanine incorporation, and cell size accompanied by increases in FGF2 levels in the medium. These hypertrophic changes in paced myocytes could be blocked by a specific anti-FGF2 antibody (7). However, recent evidence has demonstrated that chronic administration of FGF2 in rats with myocardial infarction or FGF2 isolated from pericardial fluid of patients with underlying cardiac disease does not affect left ventricular (LV) geometry or correlate with ventricular hypertrophy (14, 15). Therefore, the role of this growth factor in cardiac hypertrophy remains unclear.
Our laboratory has generated mice that carry a targeted disruption in the Fgf2 gene (16). The mice, which lack both the high- and low-molecular-weight isoforms of FGF2, are viable and fertile. However, Fgf2–/– mice have thrombocytosis, decreased mean arterial blood pressure, reduced vascular function, decreased portal vein vascular smooth muscle tone, and normal cardiac contractility. This hypotensive phenotype in Fgf2–/– mice has been subsequently documented by other investigators (17, 18).
With the availability of genetically modified mice and the in vitro evidence for FGF2 in cardiac hypertrophy, we tested the hypothesis that this growth factor has an integral function in the hypertrophic response to pressure overload. The results demonstrate that FGF2 plays a major role in the hypertrophic growth response that accompanies pressure overload conditions.
Methods
Generation of Fgf2–/– mice, maintained on a mixed background of 50% 129 and 50% Black Swiss, has been described previously (16). Mice were housed in a specific pathogen–free environment in accordance with standard use protocols, and handled according to animal welfare regulations. All protocols were approved by the University of Cincinnati Institutional Animal Care and Use Committee.
Eleven Fgf2+/+ and nine Fgf2–/– mice (2–3 months old) were assigned to the present study, and 6 mice from each genotype completed the study, which included the AC surgery, echocardiography, dobutamine dose response, histology, and molecular analysis. Three Fgf2+/+ mice died within 24–48 hours after surgery, and 2 died 1 week after AC. One Fgf2–/– mouse died during the preoperative echocardiographic imaging; 1 died 24 hours after AC; and 1 died 2 weeks after AC.
AC procedure.
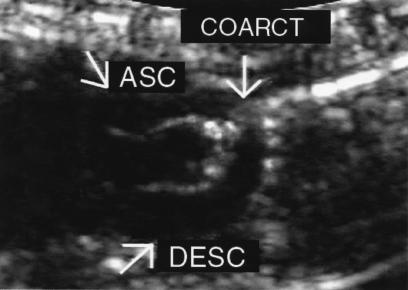
Age-matched Fgf2+/+ and Fgf2–/– mice of either sex weighing 22–26 g were anesthetized intraperitoneally with 2.5% Avertin (0.017 mL/g). Avertin, 2,2,2-tribromethanol (Sigma-Aldrich, Milwaukee, Wisconsin, USA) is an alcohol-based anesthetic that has been demonstrated to perform well in survival surgery of mice (19). A tracheotomy was performed, and the mouse was artificially ventilated with room air (120 breaths/min with a tidal volume of 0.3 mL) using a mouse ventilator (model 687; Harvard Apparatus Co., South Natick, Massachusetts, USA). A midline skin incision along the thoracic cavity was made. Using a dissecting stereoscope, a blunt dissection was performed at the second intercostal space to expose the aortic arch. A 7-0 silk suture was placed around the aorta between the left common carotid artery and brachiocephalic trunk. A 27-gauge needle, bent to an L-shape, was placed on top of the exposed transverse aorta. Tying the suture around this needle and subsequently removing the needle produced banding of the aorta (Figure 1). The lungs were reexpanded using positive pressure, and the chest and skin incisions were closed using 5-0 silk and 5-0 Ti-cron, respectively. The trachea incision was closed using 7-0 silk. The mice were monitored daily for 10 weeks.
Figure 1.
Echocardiogram of a Fgf2+/+ mouse 10 weeks after AC. Two-dimensional image depicting the ascending aorta (ASC), the coarctation site (arrow), and the descending aorta (DESC). Image was captured with an 8.5-MHz transducer. Banding of the aorta was produced by tying a 7-0 silk suture around a 27-gauge needle. The AC occurred at the aortic arch between the left common carotid artery and brachiocephalic trunk.
Echocardiography.
Echocardiography was performed preoperatively and once a week postoperatively for 10 weeks on each Fgf2+/+ and Fgf2–/– mouse. The mice were anesthetized with isoflurane, and their chests were shaved. The mice were placed in a supine position on a heating pad, and a warm layer of ultrasonic gel was applied over the left hemithorax. Using a Sonos 5500 Ultrasound System (Hewlett-Packard, Andover, Massachusetts, USA) equipped with both 15- and 12-MHz transducers or an HDI 5000cv Ultrasound System (Advanced Technology Laboratories Inc., Bothell, Washington, USA) equipped with an 8.5-MHz transducer, the following measurements were obtained: septal wall thickness (SWT) in diastole and systole, LV end-diastolic and systolic chamber size, LV posterior wall thickness (PWT) in diastole and systole, aortic root dimension, and R-R interval from long- and short-axis views. In addition, Doppler measurements of the ascending and descending aortic flow velocities were obtained from the suprasternal notch view. The highest aortic flow velocities were recorded, and M-mode measurements were made from original tracings, as suggested by the American Society of Echocardiography (20). Color-flow Doppler imaging assisted in the sample volume placement for aortic flow measured at the site of the coarct.
LV mass (as a corrected cube formula; ref. 21) and relative wall thickness (h/r, where h = wall thickness in diastole and r = radius of LV chamber in diastole) were calculated. LV mass = {1.04[(SWT + PWT + LVED)3 – LVED3] × 0.8} where SWT is septal wall thickness, PWT is posterior wall thickness, and LVED is LV end-diastolic chamber size. Cardiac output was calculated using the parameters of heart rate (HR), time-velocity integral of aortic flow (Ao TVI), and aortic root dimension (Ao Dim). Cardiac output = stroke volume × heart rate; stroke volume = (Ao Dim/2)2 × π × Ao TVI. In addition, cardiac function, measured as percent fractional shortening, was determined using the parameters of LVED and LV end-systole (LVES). Cardiac function = [(LVED – LVES)/LVED] × 100. A pressure gradient between the proximal and distal sites of the AC was calculated using Bernoulli’s equation Doppler-estimated.
In vivo hemodynamic measurements.
After echocardiographic assessment, age- and sex-matched noncoarcted (NC) and 10-week AC Fgf2+/+ and Fgf2–/– mice were surgically instrumented as described previously (22), and were subjected to a dobutamine dose-response study. The mice were allowed to stabilize for 30 minutes before initiation of the experiment protocol. All mice underwent a dobutamine dose-response protocol (1–32 ng/g per minute), with each dose infused for 3 minutes followed by washout to baseline hemodynamic levels. After the final dose of dobutamine, 150 μL of propranolol (100 ng/μL) was administered to block endogenous β-adrenergic activity; a test dose of dobutamine (32 ng/g per minute) was administered to verify complete blockade. Average values for HR, mean arterial blood pressure (MAP), systolic blood pressure (SBP), and LV pressure (LVP) were measured directly from the pressure waveforms. Maximum and minimum dP/dt were derived from a differential tracing of left intraventricular pressure. At the end of the experimental protocol, mice were sacrificed; organs including heart, lungs, kidney, and colon were harvested; and the tissue was weighed and normalized to the mouse body weight. The tissue was either placed in liquid nitrogen and stored at –80°C for future quantitative RT-PCR and protein analysis, or was placed in 4% paraformaldehyde.
RNA isolation and quantitative RT-PCR.
Total RNA was isolated from the left ventricles of NC and 10-week AC Fgf2+/+ and Fgf2–/– mice with RNAzol B (Tel-Test Inc., Friendswood, Texas, USA), following the manufacturer’s instructions, with a final concentration of 0.5–1.1 μg/μL. RNA (2 μg) was transcribed into cDNA using oligo-dT (as the primer) and Superscript II Reverse Transcriptase (GIBCO BRL, Grand Island, New York, USA). Serial dilutions (1:2, 1:4, 1:8, 1:16, and 1:32) of heart cDNA were amplified by PCR for α-myosin heavy chain (α-MHC; Myhca), β-myosin heavy chain (β-MHC; Myhcb), and Gapdh transcripts (28 cycles). Primer sequences were designed for detection of Myhca (23), Myhcb (23), and Gapdh (16) to discriminate between products derived from cDNA and genomic DNA templates.
The cDNA PCR products were blotted onto a 0.2-μm Nytran nylon membrane using the Turboblotter Rapid Downward Transfer System (Schleicher & Schuell, Keene, New Hampshire, USA) and hybridized as described previously (24). The radiolabeled blots were imaged on a PhosphorImager and quantitated using ImageQuant software (version 3.3; Molecular Dynamics, Sunnyvale, California, USA). The Myhca and Myhcb signals were normalized to Gapdh to correct for differences in loading and/or transfer. The levels of Gapdh were not affected by hypertrophy or the absence of FGF2.
Electrophoretic separation and protein quantitation of α-MHC and β-MHC.
Protein was isolated by homogenization of the left ventricles of NC and 10-week AC Fgf2+/+ and Fgf2–/– mice. SDS-PAGE and protein quantitation of α-MHC and β-MHC were performed as described previously (25). Gels were washed, silver-stained, and scanned with a Hoefer GS 300 densitometer to determine the amount of α-MHC and β-MHC, relative to total MHC, in each sample. The sample load was within the linear range of the relationship between amount of sample loaded and densitometric peak area. Three samples were each run on 2 gels. The mean difference in the relative amount of α-MHC or β-MHC in these samples between the 2 gels was 1%.
Histology.
Paraformaldehyde-fixed (4%) tissue from NC and 10-week AC Fgf2+/+ and Fgf2–/– mice was embedded in paraffin and sectioned serially (5 μm). Hematoxylin/eosin and Masson’s trichrome stain were used for histological and pathological examination of hearts.
Myocyte staining.
Heart sections from NC and 10-week AC Fgf2+/+ and Fgf2–/– mice were deparaffinized, rehydrated, and incubated for 1 hour at room temperature with a fluorescence TRITC–labeled red wheat germ agglutinin (1:4 dilution; Sigma Chemical Co., St. Louis, Missouri, USA). Fluorescence-tagged wheat germ agglutinin binds to saccharides of cellular membranes and connective tissue (26), and has been used by other investigators for the measurement of cardiomyocyte cross-sectional area (27, 28). Images of LV cardiomyocyte cell membranes were captured using a fluorescence microscope (Axiophot 2; Carl Zeiss Inc., Jena, Germany) with a digital camera (model C4742-95; Hamamatsu Photonics, Hamamatsu-City, Japan) linked to a Power Macintosh G3 computer (version 1.3; QED Imaging Inc., Pittsburgh, Pennsylvania, USA). Myocyte cross-sectional area was measured using the NIH Scion Image (version 1.6; National Institutes of Health, Bethesda, Maryland, USA).
Statistical analysis of data.
All values are expressed as mean ± SEM. Myocyte cross-sectional area, tissue weights, quantitative RT-PCR of cardiac genes, and protein levels were compared by Student’s t test. Differences between groups in echocardiographic and dobutamine hemodynamic measurements at various time points were compared using 2-way ANOVA for time and treatment with repeated measures, and Fisher’s least significant difference test. Statistical differences were considered significant at P < 0.05.
Results
Echocardiography, gravimetry, and morphology indicate less cardiac hypertrophy in AC Fgf2–/– mice.
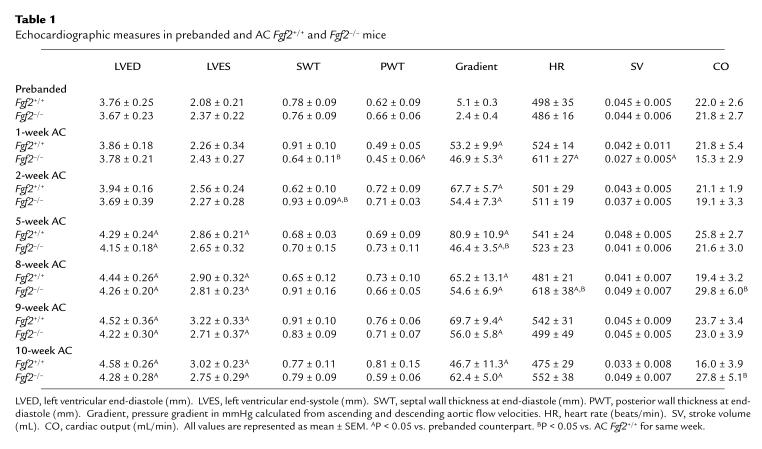
To assess the progression of cardiac hypertrophy, echocardiography was performed on prebanded Fgf2+/+ and Fgf2–/– mice and once a week for 10 weeks after AC. Table 1 depicts the echocardiographic measurements obtained on prebanded and AC Fgf2+/+ and Fgf2–/– mice from the initial, middle, and final weeks of AC. With the exception of the 5-week measurement for Fgf2–/–, there was no significant difference between the calculated pressure gradients for the AC Fgf2+/+ and Fgf2–/– mice, indicating that the degree of coarctation was similar in both groups of mice. By 5 weeks after AC in the Fgf2+/+ mice, both LVED and LVES were statistically higher than in prebanded Fgf2+/+ mice. Fgf2–/– mice also developed a significant increase in LVED at 5 weeks after AC. By 8 weeks after AC, both Fgf2+/+ and Fgf2–/– mice had elevated LVED and LVES compared with prebanded measurements, and this increase was maintained throughout the remainder of the study (P < 0.05). SWT was significantly lower at 1 week after AC, but had statistically increased by 2 weeks after AC for Fgf2–/– mice compared with the prebanded cohort and the AC Fgf2+/+ mice for the same week. PWT was significantly lower in the Fgf2–/– mice 1 week after AC compared with the prebanded value. The pressure gradient was higher for both AC Fgf2+/+ and Fgf2–/– mice for the entire 10 weeks compared with the prebanded mice (P < 0.05). There was little significant alteration in cardiac output (CO), stroke volume (SV), and HR in AC Fgf2+/+ and Fgf2–/– mice compared with the prebanded values. The exceptions were the higher HR and CO in Fgf2–/– mice at 1 and 8 weeks after AC and 8 and 10 weeks after AC, respectively (P < 0.05).
Table 1.
Echocardiographic measures in prebanded and AC Fgf2+/+ and Fgf2–/– mice
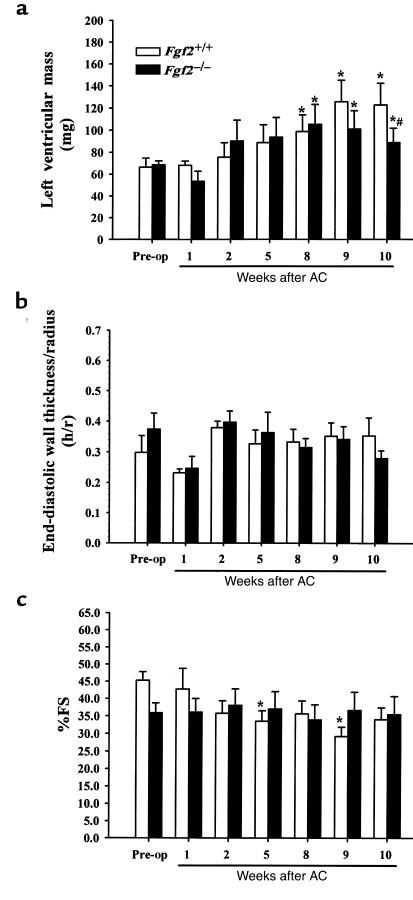
Figure 2, a–c depict the calculated LV mass, relative wall thickness (h/r), and percent fractional shortening (%FS), respectively, as measured using noninvasive echocardiographic imaging. Both Fgf2+/+ and Fgf2–/– mice had a significant increase in calculated LV mass by 8, 9, and 10 weeks after AC compared with their prebanded LV mass (P < 0.05; Figure 2a). Interestingly, the 10-week AC Fgf2–/– mice had a statistically lesser increase in LV mass (24%) compared with AC Fgf2+/+ mice (46%) (P < 0.05; Figure 2a). The relative wall thickness indicates that both AC Fgf2+/+ and Fgf2–/– mice underwent an eccentric hypertrophic response during pressure overload (Figure 2b). By 10 weeks after AC, Fgf2+/+ and Fgf2–/– mice were still in a compensated phase of hypertrophy, as %FS, a measure of cardiac function, was not significantly different from prebanded values (Figure 2c).
Figure 2.
Serial echocardiographic results for Fgf2+/+ (open bars) and Fgf2–/– (filled bars) mice before and after AC. All values are expressed as mean ± SEM. *P < 0.05 vs. prebanded. #P < 0.05 vs. Fgf2+/+ coarct. n = 6 for Fgf2+/+ and Fgf2–/–. (a) Calculated LV mass for prebanded and 1- to 10-week AC Fgf2+/+ and Fgf2–/– mice showed similar increases at 8 and 9 weeks, but by 10 weeks, that increase in LV mass was significantly less for Fgf2–/– compared with AC Fgf2+/+. LV mass was calculated from the echocardiographic measurements of SWT, PWT, and LVED. (b) Relative wall thickness (h/r) for prebanded and 1- to 10-week AC Fgf2+/+ and Fgf2–/– mice remained constant, indicating an eccentric form of cardiac hypertrophy during pressure overload. Relative wall thickness was extrapolated from the echocardiographic measurements of PWT and LVED. (c) Fractional shortening (FS) for prebanded and 1- to 10-week AC Fgf2+/+ and Fgf2–/– mice showed a preservation of function, suggesting a compensated stage of hypertrophy. FS was determined from the echocardiographic measurements of LVED and LVES.
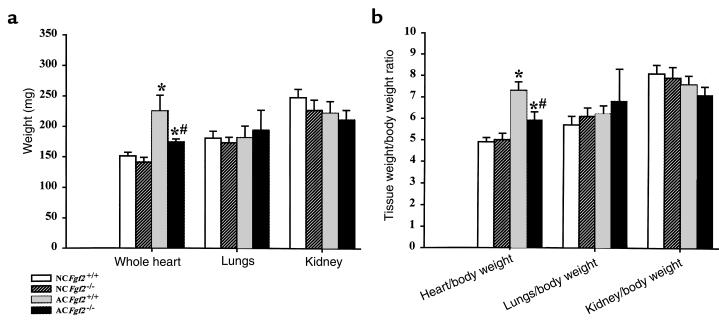
Ten-week AC heart/body weight ratios (Figure 3) indicate that both Fgf2+/+ and Fgf2–/– mice had a higher heart/body weight ratio than their age- and sex-matched NC cohorts. Consistent with LV mass values obtained by echocardiography, the AC Fgf2–/– mice had significantly less increase in heart/body weight ratio (16%) than did the AC Fgf2+/+ mice (52%) at 10 weeks. There was no change in kidney or lung weight in the AC versus NC mice, indicating that 10-week AC did not elicit pulmonary edema, a sign of heart failure.
Figure 3.
Tissue weights (a) and tissue/body weight ratios (b) for NC and 10-week AC Fgf2+/+ and Fgf2–/– mice showed increases in heart weight for AC mice compared with NC mice; however, AC Fgf2–/– mice had a significantly lesser increase in heart weight compared with AC Fgf2+/+ mice. All values are expressed as mean ± SEM. *P < 0.01 vs. NC. #P < 0.01 vs. AC Fgf2+/+. n = 6 for NC and AC Fgf2+/+ and Fgf2–/–.
Hypertrophic growth and fibrosis in AC Fgf2+/+ mice.
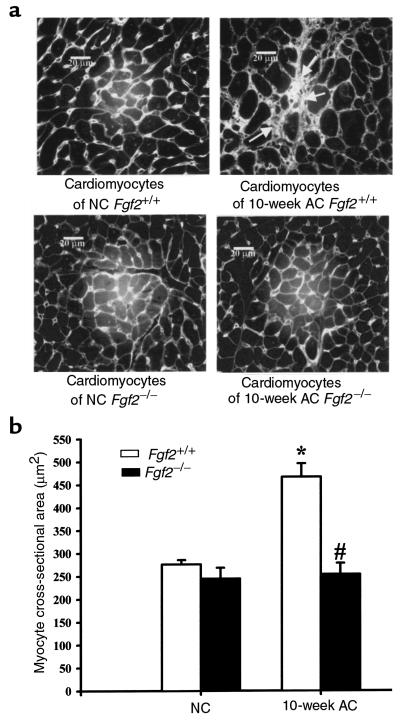
Morphological changes of the LV cardiomyocytes from NC and 10-week AC Fgf2+/+ and Fgf2–/– mice were analyzed by measuring cross-sectional area. Ten-week AC Fgf2–/– mice showed no significant increase in myocyte cross-sectional area, whereas 10-week AC Fgf2+/+ mice showed a substantial (>50%) increase (P < 0.05; Figure 4b). This result is consistent with data from echocardiography and gravimetry, and conclusively demonstrates an in vivo role of FGF2 in the growth response of the heart during hemodynamic load.
Figure 4.
(a) Representative images of hearts from NC and 10-week AC Fgf2+/+ and Fgf2–/– mice. Ten-week AC Fgf2+/+ heart depicting fibrosis (arrow) and an increase in cardiomyocyte size. Picture taken at ×500. Scale bar: 20 μm. (b) Cardiomyocyte cross-sectional area of 10-week AC Fgf2+/+ mice was significantly increased compared with NC Fgf2+/+ and 10-week AC Fgf2–/– mice. Each column represents approximately 100 myocytes from each of 3 hearts per group. *P < 0.05 vs. NC. #P < 0.05 vs. AC Fgf2+/+.
Figure 4a depicts a representative image of NC and 10-week AC Fgf2+/+ and Fgf2–/– cardiomyocytes. Histologically, 10-week AC Fgf2+/+ had moderate hypertrophy of LV myocytes, nuclear gigantism, and moderate to severe multifocal and perivascular fibrosis. However, only mild perivascular fibrosis, with no significant hypertrophy of cardiomyocytes, was observed in 10-week AC Fgf2–/– mice. The residual hypertrophy that is seen in AC Fgf2–/– hearts may be due to myocyte elongation or mild perivascular fibrosis.
To confirm that changes in LV mass were caused by a hypertrophic response, age-matched NC and 10-week AC Fgf2+/+ and Fgf2–/– mice were injected with BrdU (120 μg/g), a thymidine analogue taken up by proliferating cells. Mice were sacrificed 24 hours later, and heart and colon (positive control) were fixed in 4% paraformaldehyde and embedded in paraffin. Immunohistochemical detection of BrdU was performed as described previously by our laboratory (29). No BrdU incorporation was detected in LV cardiomyocytes and nonmyocytes from NC or AC mice (data not shown), indicating that the significant increase in Fgf2+/+ heart mass and slight increase in Fgf2–/– heart weight after 10 weeks of AC resulted from a hypertrophic, not a hyperplastic, response. Proliferating colonic epithelium taken from the same mice showed high levels of BrdU incorporation (data not shown).
Only hypertrophic Fgf2+/+ mice have depressed rate of contractility during dobutamine stimulation.
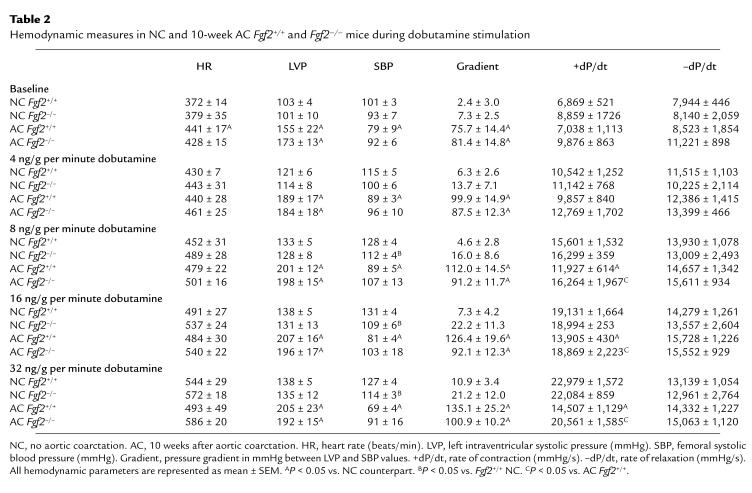
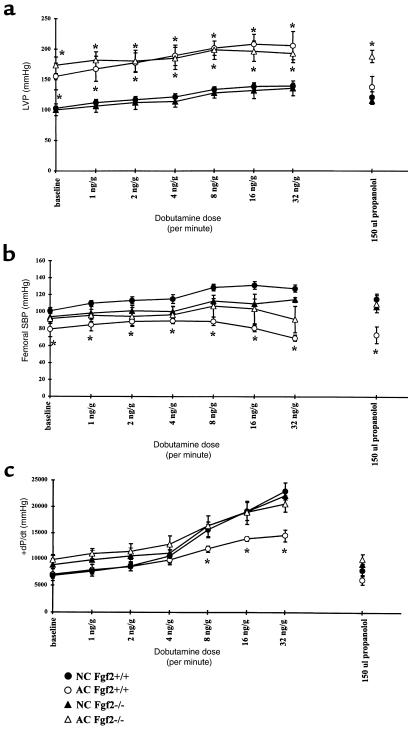
Hemodynamic parameters of HR, LVP, SBP, and maximum (+) and minimum (–) dP/dt obtained for 10-week AC and age- and sex-matched NC Fgf2+/+ and Fgf2–/– mice are shown in Table 2. Measurements of LVP, SBP, and +dP/dt are plotted in Figure 5 for NC and 10-week AC Fgf2+/+ and Fgf2–/– mice. HR and –dP/dt measured at baseline and during dobutamine stimulation are similar for NC and 10-week AC Fgf2+/+ and Fgf2–/– mice, with the exception of the 10-week AC Fgf2+/+ mice showing a significantly higher HR at baseline. Both 10-week AC Fgf2+/+ and Fgf2–/– mice had a substantial increase in LVP at baseline and during dobutamine stimulation compared with their NC cohorts (P < 0.05). SBP in 10-week AC Fgf2+/+ mice was decreased at baseline and during β-adrenergic stimulation (P < 0.05). There was no significant difference in SBP in NC and AC Fgf2–/– mice at any measured point (Figure 5b); however, the pressure gradient of 10-week AC Fgf2–/– mice was similar to that measured in the 10-week AC Fgf2+/+ mice (Table 2). There was a significant decrease in SBP of NC Fgf2–/– mice compared with NC Fgf2+/+ mice during the higher doses of dobutamine, as demonstrated previously (16). The rate of contraction (+dP/dt) was significantly depressed in 10-week AC Fgf2+/+ mice with increasing β-adrenergic activation, compared with NC mice (P < 0.05). There was no difference in responsiveness to dobutamine in the 10-week AC Fgf2–/– mice compared with NC mice.
Table 2.
Hemodynamic measures in NC and 10-week AC Fgf2+/+ and Fgf2–/– mice during dobutamine stimulation
Figure 5.
Hemodynamic parameters during dobutamine dose response for NC and 10-week AC Fgf2+/+ and Fgf2–/– mice. *P < 0.05 vs. baseline. n = 5 for NC and AC Fgf2+/+ and Fgf2–/–. (a) LVP for NC and 10-week AC Fgf2+/+ and Fgf2–/– mice during dobutamine stimulation. Ten-week AC Fgf2+/+ and Fgf2–/– mice had similar increases in LVP. (b) SBP for NC and 10-week AC Fgf2+/+ and Fgf2–/– mice during dobutamine stimulation. Systemic SBP was decreased in 10-week AC mice. (c) +dP/dt for NC and 10-week AC Fgf2+/+ and Fgf2–/– mice during dobutamine stimulation. AC Fgf2–/– mice had a similar increase in the rate of contractility as NC mice during β-adrenergic stimulation; however, AC Fgf2+/+ had a blunted response to increasing dobutamine levels.
FGF2 is not responsible for the upregulation of fetal cardiac MHC during pressure overload.
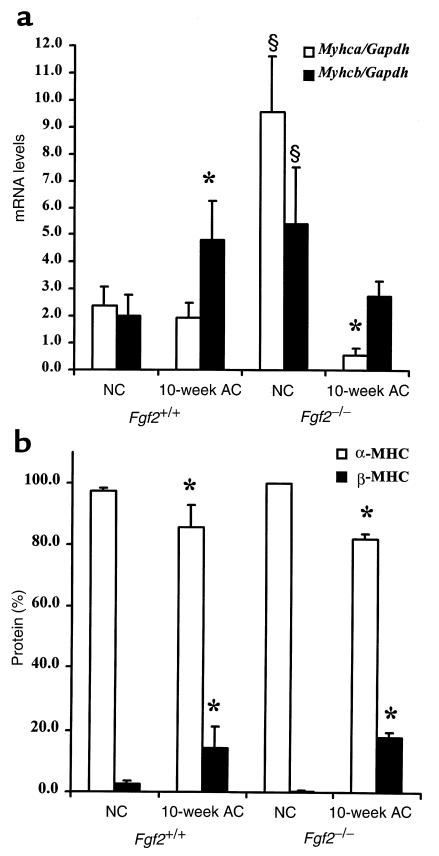
Using quantitative RT-PCR, we examined the profile of α-MHC and β-MHC genes (Myhca and Myhcb, respectively) in the left ventricle of NC and 10-week AC Fgf2+/+ and AC Fgf2–/– mice. Figure 6a depicts the mRNA levels of Myhca, the adult contractile isoform, and Myhcb, the fetal contractile isoform. Figure 6b shows the protein levels of the adult (α-MHC) and fetal (β-MHC) isoform of MHC in age- and sex-matched NC and 10-week AC Fgf2+/+ and Fgf2–/– mice. Surprisingly, relative to NC Fgf2+/+ mice, NC Fgf2–/– mice had exceptionally high levels of both Myhca and Myhcb mRNA, suggesting that FGF2 functions to reduce potently message levels of both cardiac myosin genes. As expected, 10-week AC Fgf2+/+ mice had a slight, but not significant, decrease in mRNA levels of Myhca. However, even in the absence of FGF2, a condition that keeps Myhca levels elevated in normotensive mice, the 10-week AC Fgf2–/– mice had dramatically less Myhca mRNA than their NC cohorts (P < 0.05), suggesting that factors other than FGF2 are responsible for the reduction in Myhca message during pressure overload. With respect to Myhcb, 10-week AC Fgf2+/+ mice had an expected increase in Myhcb message levels (P < 0.05). However, in the absence of FGF2, a condition that keeps Myhcb levels highly elevated in normotensive animals, there was no elevation in Myhcb mRNA levels in AC Fgf2–/– mice, suggesting that factors other than FGF2 are responsible for the increased levels of Myhcb in hypertensive mice. At the protein level (Figure 6b), there was 97% α-MHC and 3% β-MHC in NC Fgf2+/+ and Fgf2–/– mice. Conversely, there was a significant decrease in α-MHC (85%) and a significant elevation of β-MHC (15%) in AC Fgf2+/+ and Fgf2–/– mice (P < 0.05). As with Myhca and Myhcb expression, changes in the protein isoforms of MHC are independent of FGF2.
Figure 6.
Expression pattern of MHC mRNA and protein levels in NC and 10-week AC Fgf2+/+ and Fgf2–/– mice. *P < 0.05 vs. NC. §P < 0.05 vs. NC Fgf2+/+. n = 4 for NC; n = 3 for AC Fgf2+/+ and Fgf2–/–. (a) Compared with NC Fgf2+/+, NC Fgf2–/– mice had a significantly higher degree of Myhca (α-MHC; open bars) and Myhcb (β-MHC; filled bars) message. Ten-week AC caused a significant increase in Myhcb mRNA expression and a significant decrease in Myhca in Fgf2+/+ and Fgf2–/–, respectively. (b) NC Fgf2+/+ and Fgf2–/– mice have similar levels of α-MHC (open bars) and β-MHC (filled bars) protein. Ten-week AC caused a significant decrease in α-MHC and a significant increase in β-MHC protein levels in Fgf2+/+ and Fgf2–/– mice.
Discussion
To our knowledge, the present study is the first to demonstrate the involvement of FGF2 in the growth response of cardiac hypertrophy at the in vivo physiological level. Echocardiographic measurements, gravimetry, and cardiomyocyte cross-sectional area reveal that an absence of FGF2 results in a statistically lesser degree of hypertrophy during pressure overload (Figures 2a, 3, and 4). Owing to their noninvasive technique and the ability to evaluate cardiac disease and function in a serial fashion, M-mode and pulsed-wave Doppler echocardiography are excellent methods for measuring LV mass, LV function, and aortic blood flow velocities (30–33). We have used this noninvasive application to assess the weekly progression of cardiac hypertrophy after transverse AC of Fgf2+/+ and Fgf2–/– mice. Our present data support previous findings on the validity of echocardiographic measurements of LV mass and function with other technical applications. This is also the first investigation to show that the echocardiographic measurements of pressure gradient after AC are comparable to the gradients obtained from catheterizations of the LV and femoral artery (Tables 1 and 2).
The echocardiographic images from AC Fgf2+/+ and Fgf2–/– mice revealed an eccentric form of cardiac hypertrophy (Figure 2b). Eccentric LV hypertrophy has been well documented to occur with a volume overload, whereas concentric LV hypertrophy results from a pressure overload situation, such as hypertension (1, 2). However, recent human and rodent studies have demonstrated that concentric LV hypertrophy and high blood pressure do not necessarily correlate, and, in fact, have indicated that eccentric LV hypertrophy characterizes the early phase of cardiac adaptation to pressure overload (34–36). Therefore, the eccentric pattern of LV hypertrophy that we observed may also represent the early phase of adaptation to high blood pressure. If these echocardiographic measurements were continued past 10 weeks after AC, we may have observed the transition to concentric hypertrophy. However, the Fgf2+/+ and Fgf2–/– mice were only analyzed for 10 weeks after AC, because our preliminary echocardiographic data showed that LV function begins to decrease beyond 12 weeks after AC in this mouse model. We did not want to confuse potential roles of FGF2 in the development of hypertrophy with heart failure. The %FS data (Figure 2c) demonstrate that AC Fgf2+/+ and Fgf2–/– mice are in a compensated stage of cardiac hypertrophy, because cardiac function was not significantly different throughout the time course of hemodynamic load.
FGF2 does not have the signal peptide sequence for its release from cells (37). Therefore, the mechanism(s) that initiates the release of growth factors remains unclear. The current view is that FGF is synthesized and stored in cardiac myocytes and nonmyocytes, and released in response to a hemodynamic stress (7, 38–40). Its release would result in an autocrine or paracrine effect mediated via FGF receptor signaling to regulate gene transcription of the contractile machinery and the hypertrophic growth response (7, 39, 40). Besides FGF2 (41–45), a number of other FGFs, including FGF1 (41, 45–48), FGF7 (49), FGF10 (50, 51), FGF12 (52), FGF13 (52), FGF16 (53), and FGF18 (54), along with FGF receptors (55), have been localized to the heart either during development or in the adult. Despite the many FGFs found in the heart, in the present study, the absence of the Fgf2 gene resulted in a marked reduction of hypertrophy, suggesting that FGF2 has a major role in the growth response to hemodynamic load. It is not surprising that the cardiac hypertrophy was not completely abrogated during hemodynamic stress, as other molecules (e.g., FGF1, TGF-β1, angiotensin II, catecholamines) have also been implicated in mediating this response (8, 40). However, Harada et al. (56) recently demonstrated a lack of involvement of the renin-angiotensin system in a mouse model of pressure overload. This group showed that abdominal AC wild-type and AT1A receptor–deficient mice achieved the same degree of cardiac hypertrophy, ventricular remodeling, and reexpressed fetal cardiac genes.
A number of reexpressed fetal cardiac genes, including Myhcb, have been considered as markers for cardiac hypertrophy (3, 11, 57–59). Recent work has demonstrated that different hypertrophic stimuli elicit unique cardiac gene profiles (60–62). Furthermore, a number of studies have shown that cardiac hypertrophy does not always correlate with the expression pattern of fetal cardiac genes and other hypertrophic indicators (14, 60, 61, 63). In the present study, the changes in expression and protein levels of the cardiac MHC genes in response to pressure overload differed in an FGF2-independent manner (Figure 6). The AC Fgf2+/+ mice demonstrate the typical and extensively documented cardiac gene profile of increased Myhcb and mildly to greatly decreased Myhca. In the absence of FGF2, NC mice have a significant level of Myhca and Myhcb expression, suggesting that this growth factor may have an inhibitory role on cardiac myosin gene expression in the heart under normal conditions. Because the rates at which posttranscriptional regulation converts myosin mRNAs to protein are about the same, regardless of the levels of FGF2 or the degree of pressure overload or hypertrophy, the isoform switch appears to be primarily a function of mRNA expression, not one of an alteration in levels of posttranscriptional regulation. Our data show that FGF2 is a potent inducer of cardiac hypertrophy but that it has no significant effect on isoform switching. Only pressure overload correlates with isoform switching, as it occurs equally as much when there is much less hypertrophy and in the complete absence of FGF2. Also, consistent with the work by Dorn et al. (64), the degree to which the fetal isoform (β-MHC) increased (15%) in the cardiomyofibril during pressure overload in Fgf2+/+ and Fgf2–/– mice is not enough to decrease cardiac function (%FS), as assessed by echocardiography (Figure 2c). The depressed rate of contraction (+dP/dt) to β-adrenergic stimulation in AC Fgf2+/+ mice may be an effect of the degree of hypertrophy, as these mice have a 41–52% increase in mass compared with AC Fgf2–/– mice. However, the rate of relaxation (–dP/dt) was similar between the AC and NC mice.
Over the last 10 years, considerable evidence has accumulated demonstrating a correlative relationship between increased levels of FGF2, cardiac hypertrophy, and reversion of muscle structural mRNA to the fetal isoforms. The results presented here definitively demonstrate that FGF2 is a major stimulatory component of the growth aspects of cardiac hypertrophy, and that hemodynamic stress, rather than FGF2 and hypertrophy, correlates with isoform switching. Finally, although both transcriptional and posttranscriptional controls determine the ratios of myosin isoforms in the cardiomyofibril, the isoform switching that occurs under hemodynamic stress results from alterations in transcriptional, not posttranscriptional, regulation.
Acknowledgments
This work was supported by grants from the National Institutes of Health (NIH; HL-41496 and HL-58511). The investigators acknowledge B.T. Fan, C. York, and C. Sloan for their excellent animal husbandry work; J. Robbins for the use of the Hewlett-Packard Ultrasound system; B. Glascock and D. Puthoff for assistance with echocardiographic data; G.P. Boivin for pathological reports and for the use of the morphometric NIH imaging system; and the laboratory of J. Groden for the use of the fluorescence imaging system.
References
- 1.Grossman W. Cardiac hypertrophy: useful adaptation or pathologic process? Am J Med. 1980;69:576–584. doi: 10.1016/0002-9343(80)90471-4. [DOI] [PubMed] [Google Scholar]
- 2.Grossman W, Jones D, McLaurin LP. Wall stress and patterns of hypertrophy in the human left ventricle. J Clin Invest. 1975;56:56–64. doi: 10.1172/JCI108079. [DOI] [PMC free article] [PubMed] [Google Scholar]
- 3.Lompre AM, Mercadier JJ, Schwartz K. Changes in gene expression during cardiac growth. Int Rev Cytol. 1991;124:137–186. doi: 10.1016/s0074-7696(08)61526-0. [DOI] [PubMed] [Google Scholar]
- 4.Parker TG, Packer SE, Schneider MD. Peptide growth factors can provoke “fetal” contractile protein gene expression in rat cardiac myocytes. J Clin Invest. 1990;85:507–514. doi: 10.1172/JCI114466. [DOI] [PMC free article] [PubMed] [Google Scholar]
- 5.Bogoyevitch MA, et al. Endothelin-1 and fibroblast growth factors stimulate the mitogen-activated protein kinase signaling cascade in cardiac myocytes. The potential role of the cascade in the integration of two signaling pathways leading to myocyte hypertrophy. J Biol Chem. 1994;269:1110–1119. [PubMed] [Google Scholar]
- 6.Harder BA, Schaub MC, Eppenberger HM, Eppenberger-Eberhardt M. Influence of fibroblast growth factor (bFGF) and insulin-like growth factor (IGF-I) on cytoskeletal and contractile structures and on atrial natriuretic factor (ANF) expression in adult rat ventricular cardiomyocytes in culture. J Mol Cell Cardiol. 1996;28:19–31. doi: 10.1006/jmcc.1996.0003. [DOI] [PubMed] [Google Scholar]
- 7.Kaye D, et al. Role of transiently altered sarcolemmal membrane permeability and basic fibroblast growth factor release in the hypertrophic response of adult rat ventricular myocytes to increased mechanical activity in vitro. J Clin Invest. 1996;97:281–291. doi: 10.1172/JCI118414. [DOI] [PMC free article] [PubMed] [Google Scholar]
- 8.Hefti MA, Harder BA, Eppenberger HM, Schaub MC. Signaling pathways in cardiac myocyte hypertrophy. J Mol Cell Cardiol. 1997;29:2873–2892. doi: 10.1006/jmcc.1997.0523. [DOI] [PubMed] [Google Scholar]
- 9.Tomita Y, et al. Increased accumulation of acidic fibroblast growth factor in left ventricular myocytes of patients with idiopathic cardiomyopathy. Am Heart J. 1997;134:779–786. doi: 10.1016/s0002-8703(97)70064-4. [DOI] [PubMed] [Google Scholar]
- 10.Scheinowitz M, et al. Basic fibroblast growth factor induces myocardial hypertrophy following acute infarction in rats. Exp Physiol. 1998;83:585–593. doi: 10.1113/expphysiol.1998.sp004140. [DOI] [PubMed] [Google Scholar]
- 11.Izumo S, et al. Myosin heavy chain messenger RNA and protein isoform transitions during cardiac hypertrophy. Interaction between hemodynamic and thyroid hormone-induced signals. J Clin Invest. 1987;79:970–977. doi: 10.1172/JCI112908. [DOI] [PMC free article] [PubMed] [Google Scholar]
- 12.Schwartz K, et al. Alpha-skeletal muscle actin mRNA’s accumulate in hypertrophied adult rat hearts. Circ Res. 1986;59:551–555. doi: 10.1161/01.res.59.5.551. [DOI] [PubMed] [Google Scholar]
- 13.Schoenfeld JR, et al. Distinct molecular phenotypes in murine cardiac muscle development, growth, and hypertrophy. J Mol Cell Cardiol. 1998;30:2269–2280. doi: 10.1006/jmcc.1998.0787. [DOI] [PubMed] [Google Scholar]
- 14.Corda S, et al. Trophic effect of human pericardial fluid on adult cardiac myocytes. Differential role of fibroblast growth factor-2 and factors related to ventricular hypertrophy. Circ Res. 1997;81:679–687. doi: 10.1161/01.res.81.5.679. [DOI] [PubMed] [Google Scholar]
- 15.Scheinowitz M, Abramov D, Kotlyar A, Savion N, Eldar M. Continuous administration of insulin-like growth factor-I and basic fibroblast growth factor does not affect left ventricular geometry after acute myocardial infarction in rats. Int J Cardiol. 1998;63:217–221. doi: 10.1016/s0167-5273(97)00322-7. [DOI] [PubMed] [Google Scholar]
- 16.Zhou M, et al. Fibroblast growth factor 2 control of vascular tone. Nat Med. 1998;4:201–207. doi: 10.1038/nm0298-201. [DOI] [PMC free article] [PubMed] [Google Scholar]
- 17.Dono R, Texido G, Dussel R, Ehmke H, Zeller R. Impaired cerebral cortex development and blood pressure regulation in FGF-2–deficient mice. EMBO J. 1998;17:4213–4225. doi: 10.1093/emboj/17.15.4213. [DOI] [PMC free article] [PubMed] [Google Scholar]
- 18.Ortega S, Ittmann M, Tsang SH, Ehrlich M, Basilico C. Neuronal defects and delayed wound healing in mice lacking fibroblast growth factor 2. Proc Natl Acad Sci USA. 1998;95:5672–5677. doi: 10.1073/pnas.95.10.5672. [DOI] [PMC free article] [PubMed] [Google Scholar]
- 19.Hogan, B., Constantini, F., and Lacy, E. 1986. Manipulating the mouse embryo: a laboratory manual. Cold Spring Harbor Laboratory Press. Plainview, NY. 1–332.
- 20.Sahn DJ, DeMaria A, Kisslo J, Weyman A. Recommendations regarding quantitation in M-mode echocardiography: results of a survey of echocardiographic measurements. Circulation. 1978;58:1072–1083. doi: 10.1161/01.cir.58.6.1072. [DOI] [PubMed] [Google Scholar]
- 21.Devereux RB, et al. Echocardiographic assessment of left ventricular hypertrophy: comparison to necropsy findings. Am J Cardiol. 1986;57:450–458. doi: 10.1016/0002-9149(86)90771-x. [DOI] [PubMed] [Google Scholar]
- 22.Lorenz JN, Robbins J. Measurement of intraventricular pressure and cardiac performance in the intact closed-chest anesthetized mouse. Am J Physiol. 1997;272:H1137–H1146. doi: 10.1152/ajpheart.1997.272.3.H1137. [DOI] [PubMed] [Google Scholar]
- 23.Robbins J, Gulick J, Sanchez A, Howles P, Doetschman T. Mouse embryonic stem cells express the cardiac myosin heavy chain genes during development in vitro. J Biol Chem. 1990;265:11905–11909. [PubMed] [Google Scholar]
- 24.Sambrook, J., Fritsch, E.F., and Maniatis, T. 1989. Molecular cloning: a laboratory manual. Cold Spring Harbor Laboratory Press. Cold Spring Harbor, NY. 1–332.
- 25.Reiser PJ, Kline WO. Electrophoretic separation and quantitation of cardiac myosin heavy chain isoforms in eight mammalian species. Am J Physiol. 1998;274:H1048–H1053. doi: 10.1152/ajpheart.1998.274.3.H1048. [DOI] [PubMed] [Google Scholar]
- 26.Thoss K, Roth J. The use of fluorescein isothiocyanate labelled lectins for immuno-histological demonstration of saccharides. III. Studies by use of Ricinus communis lectin and wheat germ agglutinin. Exp Pathol (Jena) 1977;14:215–219. doi: 10.1016/s0014-4908(77)80069-0. [DOI] [PubMed] [Google Scholar]
- 27.D’Angelo DD, et al. Transgenic Galphaq overexpression induces cardiac contractile failure in mice. Proc Natl Acad Sci USA. 1997;94:8121–8126. doi: 10.1073/pnas.94.15.8121. [DOI] [PMC free article] [PubMed] [Google Scholar]
- 28.Sakata Y, Hoit BD, Liggett SB, Walsh RA, Dorn GW. Decompensation of pressure-overload hypertrophy in G alpha q–overexpressing mice. Circulation. 1998;97:1488–1495. doi: 10.1161/01.cir.97.15.1488. [DOI] [PubMed] [Google Scholar]
- 29.Engle SJ, et al. Transforming growth factor β1 suppresses nonmetastatic colon cancer at an early stage of tumorigenesis. Cancer Res. 1999;59:3379–3386. [PubMed] [Google Scholar]
- 30.Manning WJ, Wei JY, Katz SE, Litwin SE, Douglas PS. In vivo assessment of LV mass in mice using high-frequency cardiac ultrasound: necropsy validation. Am J Physiol. 1994;266:H1672–H1675. doi: 10.1152/ajpheart.1994.266.4.H1672. [DOI] [PubMed] [Google Scholar]
- 31.Gardin JM, Siri FM, Kitsis RN, Edwards JG, Leinwand LA. Echocardiographic assessment of left ventricular mass and systolic function in mice. Circ Res. 1995;76:907–914. doi: 10.1161/01.res.76.5.907. [DOI] [PubMed] [Google Scholar]
- 32.Hartley CJ, Michael LH, Entman ML. Noninvasive measurement of ascending aortic blood velocity in mice. Am J Physiol. 1995;268:H499–H505. doi: 10.1152/ajpheart.1995.268.1.H499. [DOI] [PubMed] [Google Scholar]
- 33.Hoit BD, Khoury SF, Kranias EG, Ball N, Walsh RA. In vivo echocardiographic detection of enhanced left ventricular function in gene-targeted mice with phospholamban deficiency. Circ Res. 1995;77:632–637. doi: 10.1161/01.res.77.3.632. [DOI] [PubMed] [Google Scholar]
- 34.Friberg P, Adams MA. Cardiac and vascular structural adaptation in experimental hypertension. Eur Heart J. 1990;11(Suppl. G):65–71. doi: 10.1093/eurheartj/11.suppl_g.65. [DOI] [PubMed] [Google Scholar]
- 35.Ganau A, et al. Patterns of left ventricular hypertrophy and geometric remodeling in essential hypertension. J Am Coll Cardiol. 1992;19:1550–1558. doi: 10.1016/0735-1097(92)90617-v. [DOI] [PubMed] [Google Scholar]
- 36.Ganau A, Devereux RB. Ventricular patterns in hypertensive patients: pathogenesis, treatment and prognosis. Prim Cardiol. 1994;20:19–27. [Google Scholar]
- 37.Mason IJ. The ins and outs of fibroblast growth factors. Cell. 1994;78:547–552. doi: 10.1016/0092-8674(94)90520-7. [DOI] [PubMed] [Google Scholar]
- 38.McNeil PL, Muthukrishnan L, Warder E, D’Amore PA. Growth factors are released by mechanically wounded endothelial cells. J Cell Biol. 1989;109:811–822. doi: 10.1083/jcb.109.2.811. [DOI] [PMC free article] [PubMed] [Google Scholar]
- 39.Clarke MS, Caldwell RW, Chiao H, Miyake K, McNeil PL. Contraction-induced cell wounding and release of fibroblast growth factor in heart. Circ Res. 1995;76:927–934. doi: 10.1161/01.res.76.6.927. [DOI] [PubMed] [Google Scholar]
- 40.Lembo G, Hunter JJ, Chien KR. Signaling pathways for cardiac growth and hypertrophy. Recent advances and prospects for growth factor therapy. Ann NY Acad Sci. 1995;752:115–127. doi: 10.1111/j.1749-6632.1995.tb17414.x. [DOI] [PubMed] [Google Scholar]
- 41.Quinkler W, et al. Isolation of heparin-binding growth factors from bovine, porcine and canine hearts. Eur J Biochem. 1989;181:67–73. doi: 10.1111/j.1432-1033.1989.tb14694.x. [DOI] [PubMed] [Google Scholar]
- 42.Kardami E, Fandrich RR. Basic fibroblast growth factor in atria and ventricles of the vertebrate heart. J Cell Biol. 1989;109:1865–1875. doi: 10.1083/jcb.109.4.1865. [DOI] [PMC free article] [PubMed] [Google Scholar]
- 43.Kardami E, et al. Regulation of basic fibroblast growth factor (bFGF) and FGF receptors in the heart. Ann NY Acad Sci. 1995;752:353–369. doi: 10.1111/j.1749-6632.1995.tb17444.x. [DOI] [PubMed] [Google Scholar]
- 44.Kardami E, et al. Biochemical and ultrastructural evidence for the association of basic fibroblast growth factor with cardiac gap junctions. J Biol Chem. 1991;266:19551–19557. [PubMed] [Google Scholar]
- 45.Casscells W, et al. Isolation, characterization, and localization of heparin-binding growth factors in the heart. J Clin Invest. 1990;85:433–441. doi: 10.1172/JCI114456. [DOI] [PMC free article] [PubMed] [Google Scholar]
- 46.Sasaki H, et al. Purification of acidic fibroblast growth factor from bovine heart and its localization in the cardiac myocytes. J Biol Chem. 1989;264:17606–17612. [PubMed] [Google Scholar]
- 47.Weiner HL, Swain JL. Acidic fibroblast growth factor mRNA is expressed by cardiac myocytes in culture and the protein is localized to the extracellular matrix. Proc Natl Acad Sci USA. 1989;86:2683–2687. doi: 10.1073/pnas.86.8.2683. [DOI] [PMC free article] [PubMed] [Google Scholar]
- 48.Engelmann GL, Dionne CA, Jaye MC. Acidic fibroblast growth factor and heart development. Role in myocyte proliferation and capillary angiogenesis. Circ Res. 1993;72:7–19. doi: 10.1161/01.res.72.1.7. [DOI] [PubMed] [Google Scholar]
- 49.Mason IJ, Fuller-Pace F, Smith R, Dickson C. FGF-7 (keratinocyte growth factor) expression during mouse development suggests roles in myogenesis, forebrain regionalisation and epithelial-mesenchymal interactions. Mech Dev. 1994;45:15–30. doi: 10.1016/0925-4773(94)90050-7. [DOI] [PubMed] [Google Scholar]
- 50.Beer HD, et al. Mouse fibroblast growth factor 10: cDNA cloning, protein characterization, and regulation of mRNA expression. Oncogene. 1997;15:2211–2218. doi: 10.1038/sj.onc.1201383. [DOI] [PubMed] [Google Scholar]
- 51.Tagashira S, Harada H, Katsumata T, Itoh N, Nakatsuka M. Cloning of mouse FGF10 and up-regulation of its gene expression during wound healing. Gene. 1997;197:399–404. doi: 10.1016/s0378-1119(97)00187-x. [DOI] [PubMed] [Google Scholar]
- 52.Hartung H, et al. Murine FGF-12 and FGF-13: expression in embryonic nervous system, connective tissue and heart. Mech Dev. 1997;64:31–39. doi: 10.1016/s0925-4773(97)00042-7. [DOI] [PubMed] [Google Scholar]
- 53.Miyake A, et al. Structure and expression of a novel member, FGF-16, on the fibroblast growth factor family. Biochem Biophys Res Commun. 1998;243:148–152. doi: 10.1006/bbrc.1998.8073. [DOI] [PubMed] [Google Scholar]
- 54.Maruoka Y, et al. Comparison of the expression of three highly related genes, Fgf8, Fgf17 and Fgf18, in the mouse embryo. Mech Dev. 1998;74:175–177. doi: 10.1016/s0925-4773(98)00061-6. [DOI] [PubMed] [Google Scholar]
- 55.Liu L, et al. Adult cardiomyocytes express functional high-affinity receptors for basic fibroblast growth factor. Am J Physiol. 1995;268:H1927–H1938. doi: 10.1152/ajpheart.1995.268.5.H1927. [DOI] [PubMed] [Google Scholar]
- 56.Harada K, et al. Pressure overload induces cardiac hypertrophy in angiotensin II type 1A receptor knockout mice. Circulation. 1998;97:1952–1959. doi: 10.1161/01.cir.97.19.1952. [DOI] [PubMed] [Google Scholar]
- 57.Parker TG, Chow KL, Schwartz RJ, Schneider MD. Differential regulation of skeletal alpha-actin transcription in cardiac muscle by two fibroblast growth factors. Proc Natl Acad Sci USA. 1990;87:7066–7070. doi: 10.1073/pnas.87.18.7066. [DOI] [PMC free article] [PubMed] [Google Scholar]
- 58.Schneider MD, McLellan WR, Black FM, Parker TG. Growth factors, growth factor response elements, and the cardiac phenotype. Basic Res Cardiol. 1992;87(Suppl. 2):33–48. doi: 10.1007/978-3-642-72477-0_4. [DOI] [PubMed] [Google Scholar]
- 59.Schneider MD, Kirshenbaum LA, Brand T, MacLellan WR. Control of cardiac gene transcription by fibroblast growth factors. Mol Reprod Dev. 1994;39:112–117. doi: 10.1002/mrd.1080390117. [DOI] [PubMed] [Google Scholar]
- 60.Buttrick PM, Kaplan M, Leinwand LA, Scheuer J. Alterations in gene expression in the rat heart after chronic pathological and physiological loads. J Mol Cell Cardiol. 1994;26:61–67. doi: 10.1006/jmcc.1994.1008. [DOI] [PubMed] [Google Scholar]
- 61.Calderone A, Takahashi N, Izzo NJJ, Thaik CM, Colucci WS. Pressure- and volume-induced left ventricular hypertrophies are associated with distinct myocyte phenotypes and differential induction of peptide growth factor mRNAs. Circulation. 1995;92:2385–2390. doi: 10.1161/01.cir.92.9.2385. [DOI] [PubMed] [Google Scholar]
- 62.King KL, et al. Phenylephrine, endothelin, prostaglandin F2alpha’ and leukemia inhibitory factor induce different cardiac hypertrophy phenotypes in vitro. Endocrine. 1998;9:45–55. doi: 10.1385/endo:9:1:45. [DOI] [PubMed] [Google Scholar]
- 63.Vikstrom KL, Bohlmeyer T, Factor SM, Leinwand LA. Hypertrophy, pathology, and molecular markers of cardiac pathogenesis. Circ Res. 1998;82:773–778. doi: 10.1161/01.res.82.7.773. [DOI] [PubMed] [Google Scholar]
- 64.Dorn GW, Robbins J, Ball N, Walsh RA. Myosin heavy chain regulation and myocyte contractile depression after LV hypertrophy in aortic-banded mice. Am J Physiol. 1994;267:H400–H405. doi: 10.1152/ajpheart.1994.267.1.H400. [DOI] [PubMed] [Google Scholar]


