Abstract
Tuberous sclerosis (TSC) is an autosomal dominant genetic disorder in which benign hamartomas develop in multiple organs, caused by mutations in either TSC1 or TSC2. We developed a murine model of Tsc2 disease using a gene targeting approach. Tsc2-null embryos die at embryonic days 9.5–12.5 from hepatic hypoplasia. Tsc2 heterozygotes display 100% incidence of multiple bilateral renal cystadenomas, 50% incidence of liver hemangiomas, and 32% incidence of lung adenomas by 15 months of age. Progression to renal carcinoma, fatal bleeding from the liver hemangiomas, and extremity angiosarcomas all occur at a rate of less than 10%. The renal cystadenomas develop from intercalated cells of the cortical collecting duct and uniformly express gelsolin at high levels, enabling detection of early neoplastic lesions. The tumor expression pattern of the mice is influenced by genetic background, with fewer large renal cystadenomas in the outbred Black Swiss background and more angiosarcomas in 129/SvJae chimeric mice. The slow growth of the tumors in the heterozygote mice matches the limited growth potential of the great majority of TSC hamartomas, and the influence of genetic background on phenotype correlates with the marked variability in expression of TSC seen in patients.
Introduction
Tuberous sclerosis (TSC) is an autosomal dominant tumor-suppressor gene syndrome, characterized by development of distinctive benign tumors (hamartomas) and malformations (hamartias) in multiple organ systems (1). The brain, skin, heart, and kidneys are commonly affected. TSC lesions occurring in the skin and kidney contain smooth muscle cells, endothelial cells, adipocytes, and large neuronal appearing cells. Despite this complex cellular architecture, kidney and other lesions in TSC appear to be clonal in nature, based on clonality and loss of heterozygosity (LOH) analyses (2–5).
Two genes have been identified that cause TSC: TSC1 on 9q34, encoding the protein hamartin; and TSC2 on 16p13, encoding the protein tuberin (6, 7). Tuberin may have functions as a GTPase-activating protein for the small GTPases rap1 and/or rab5 (8, 9) and also appears to be involved in cell-cycle control and transcriptional events (10–12). Functions for hamartin have not been elucidated, but hamartin occurs in a complex with tuberin and may serve to regulate and/or direct tuberin’s function to specific cellular compartments (13, 14).
More than 400 mutations have been identified in the TSC1 and TSC2 genes (1, 15–17). The great majority are inactivating, causing premature truncation of the protein, and include large genomic deletions of most or all of TSC2. Mutations in TSC1 and TSC2 cause clinical features that are nearly identical; therefore, one cannot distinguish on clinical grounds between TSC1 and TSC2 disease (15–17).
The Eker rat was first identified as a hereditary renal cancer model more than 40 years ago (18), and was recognized as carrying an insertional mutation in the rat Tsc2 gene shortly after the human TSC2 gene was identified (19, 20). An intronic transposition of a rat intracisternal A-particle into the rat Tsc2 locus causes the Eker rat phenotype and may lead to production of a residual truncated protein product.
To provide an alternative murine model for TSC2 disease in which the effects of gene disruption could be better characterized and compared with the Eker rat mutation, we generated a targeted, inactivated Tsc2 allele in the mouse.
Methods
Generation of a targeted Tsc2 allele in embryonic stem cells and mice.
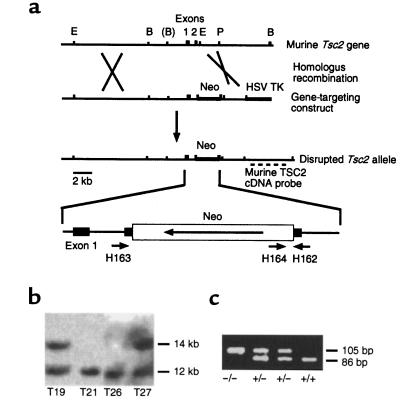
A murine Tsc2 genomic clone was isolated from a 129/Sv mouse λ phage library (21). Restriction enzyme digestion, Southern blotting, and sequence analysis were used to map this fragment. A gene targeting construct was made (Figure 1a) and electroporated into J1 embryonic stem (ES) cells, which were maintained on a feeder layer of embryonic fibroblasts in the presence of 500 U/mL leukemia inhibitory factor. Clones were selected with 200 mg/L G418 and 2 μM fialuridine (FIAU) and were minimally expanded, and their DNA was isolated and analyzed by Southern blot. Two ES clones that had undergone homologous recombination were injected into C57BL/6J or BALB/cJ blastocysts, followed by transfer to pseudopregnant female mice. Multiple chimeric offspring were obtained and were bred with either wild-type C57BL/6J or BALB/cJ mice (The Jackson Laboratory, Bar Harbor, Maine, USA) to produce F1 animals. F2 animals were generated by intercrossing of F1 heterozygotes.
Figure 1.
Generation of mice with a targeted, disrupted Tsc2 allele. (a) Genomic structure and creation of a targeting construct for the Tsc2 gene. E, EcoRI; B, BamHI; P, PstI. (b) Southern blot analysis of BamHI-digested ES cell DNA, demonstrating disruption of the Tsc2 gene in 2 of 4 clones: T19 and T27. (c) PCR genotyping of the induced mutation in the Tsc2 gene.
The Tsc2 disrupted allele was also introduced into outbred Black Swiss mice (Taconic Farms, Germantown, New York, USA) by serial backcross breeding. Animals obtained after the third generation of backcross (N3) were studied.
Southern blot and PCR genotype analyses of ES cells and mice.
Tail snips were used to prepare DNA for Southern blot and PCR analysis from live-born mice (21). Embryo or yolk sac fragments were used for analysis of embryos. A 337-bp murine TSC2 cDNA fragment corresponding to coding exons 5–8, which were not contained in the targeting construct, was used as a probe. PCR genotyping was performed by simultaneous amplification of both wild-type Tsc2 and insertion-derived alleles using 3 primers — H162-CAAACCCACCTCCTCAAGCTTC, H163-AATGCGGCCTCAACAATCG, and H164-AGACTGCCTTGGGAAAAGCG (Figure 1a) — in a 35-cycle PCR reaction using AmpliTaq Gold (Perkin-Elmer Corp., Norwalk, Connecticut, USA). Products were H163/H162-86 bp (wild type) and H164/H162-105 bp (mutant), and were analyzed on 3% Nusieve agarose gels (FMC Bioproducts, Rockland, Maine, USA).
Animal care and necropsy procedures.
All procedures were carried out in accordance with the Guide for the Humane Use and Care of Laboratory Animals, and these studies were approved by the Harvard Medical Area Standing Committee on Animals. Embryonic age was determined by tracking vaginal plug formation and by inspection of limb bud development. Embryo viability was determined by the presence of cardiac contractions for embryos age embryonic day 9 (E9) and older. Eight Tsc2-null embryos were serially sectioned in the sagittal plane for histological review.
Necropsy analysis included full autopsy with examination and sectioning of brain, pituitary gland, heart, lungs, kidney, liver, spleen, intestinal tract, bladder, and gonads. Kidneys were cut into 5 dorsoventral sections for histological examination.
mAb preparation and immunoblotting.
An 1,100-bp cDNA encoding the COOH-terminal fragment of human tuberin was expressed in the pQE30 vector, leading to production of a 6× His-tagged 30-kDa fragment, which was purified in 8 M urea on an Ni2+ resin. mAb’s against this recombinant fragment of tuberin were produced according to standard procedures (22). Hybridoma clones secreting anti-tuberin antibodies were identified by ELISA and confirmed by immunoblotting, including analysis of cells transfected to overexpress tuberin (data not shown). One hybridoma antibody, mAb 5E8, detected murine tuberin robustly in immunoblot analyses, which were performed as described (23).
Immunohistochemistry.
Immunohistochemistry was performed on paraffin-embedded sections as described (23). Antibodies were as follows: anti–murine gelsolin (23); anti–COOH-terminal peptide of human tuberin (C-20; Santa Cruz Biotechnology Inc., Santa Cruz, California, USA); anti-adseverin (23); anti–water channel AQP-2 (courtesy of D. Brown, Massachusetts General Hospital Renal Unit, Boston, Massachusetts, USA); anti–Na+-H+-ATPase (courtesy of D. Brown); anti–von Willebrand factor antibody, and a Cy-3–labeled monoclonal anti–smooth muscle actin antibody (both from Sigma Chemical Co., St. Louis, Missouri, USA). Controls were nonimmune serum (gelsolin, AQP-2, H+-ATPase, C-20, von Willebrand factor, smooth muscle actin), preimmune serum (adseverin), and preincubation with an excess of peptide antigen (C-20). Secondary antibody was FITC-labeled goat anti-rabbit antibody (ICN Pharmaceuticals, Costa Mesa, California, USA).
FITC-stained sections were examined using an Olympus BH2 epi-fluorescence microscope, and pictures were taken with a 35-mm camera (Olympus, Melville, New York, USA). Photographic slides were digitized by scanning with a Polaroid SprintScan 35 (Polaroid Corp., Cambridge, Massachusetts, USA) slide scanner and were image-processed to achieve natural colors using Adobe Photoshop 4.0 software (Adobe Systems Inc., Mountain View, California, USA).
LOH analyses.
Tumors and cysts were isolated from Tsc2 heterozygote mice either by direct dissection of large lesions or by dissection of paraffin-embedded sections under ×100 magnification using a tungsten needle. Paraffin DNA preparations were diluted to achieve robust PCR amplification for genotyping. On heterozygote samples, the primers gave a consistent, equal ratio of the 2 alleles. Thus, when the wild-type allele was present at less than 50% of the mutant allele, we judged this as evidence of LOH.
Statistics.
Fisher’s exact test for count data (applied by Anne Sevin [Harvard School of Public Health, Boston, Massachusetts, USA], using the S-plus statistical package) was used for comparison of tumor frequencies among different cohorts of mice.
Results
Generation of mice with a targeted, disrupted Tsc2 gene.
A 12-kb murine Tsc2 genomic fragment was used to make a Tsc2 gene targeting construct, by insertion of a neomycin resistance (Neo) cassette into the second coding exon of Tsc2 (Figure 1a). Two of 35 neomycin and FIAU-resistant ES clones obtained after electroporation of ES cells (21) demonstrated evidence of homologous recombination by Southern blot analysis using a Tsc2 cDNA probe (Figure 1, a and b). These 2 clones were injected into blastocysts to obtain chimeric male offspring, which were bred with C57BL/6 or BALB/c females. Germline transmission of the Tsc2 mutation by both ES cell lines was confirmed by Southern blot and PCR genotyping analyses (Figure 1c). Subsequent studies indicated that animals derived from the 2 independent ES cell lines had indistinguishable phenotypes, indicating that the engineered Tsc2 mutation, not some collateral genetic event, was causing the phenotype. Initially, mice heterozygous for the mutation had no apparent phenotype when compared with their wild-type littermates.
The homozygous Tsc2 mutation is embryonic lethal.
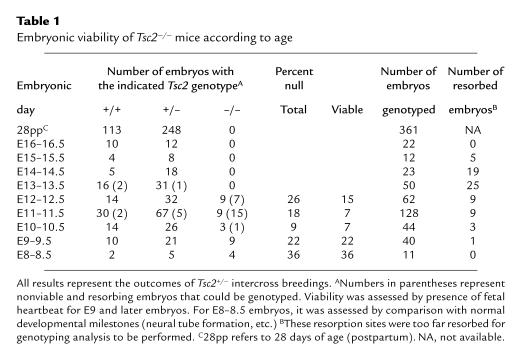
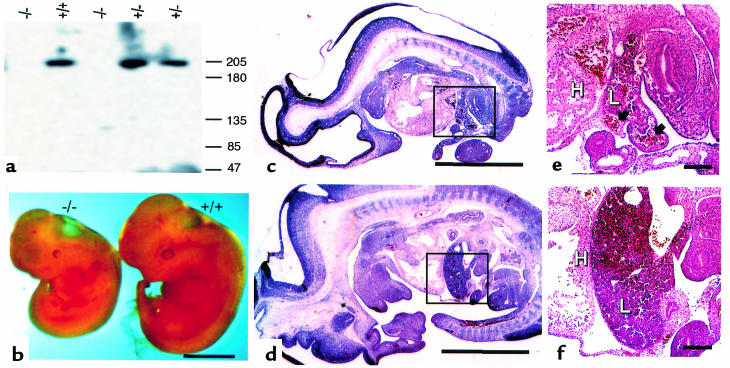
No live-born homozygous mutant mice were found among heterozygote intercrosses, indicating that the engineered Tsc2 mutation had a recessive lethal phenotype. Because of this observation and others described below, we refer to the targeted Tsc2 allele as Tsc2–. To determine the developmental age at which embryonic death occurred, embryos were obtained from Tsc2+/– × Tsc2+/– breedings at E8–16.5 (Table 1). No viable Tsc2–/– embryos were observed beyond E12.5. At E10–12.5, Tsc2–/– embryos were identified, but the proportion was decreased from the expected 1 in 4, and the majority (23/44, 52%) were nonviable. At E8-9.5, Tsc2–/– embryos were seen at the expected frequency, and all appeared to be viable. The 200-kDa tuberin protein was present in Tsc2+/+ and Tsc2+/– embryo extracts and cultures, but not in Tsc2–/– embryo extracts or cultures, as determined by immunoblot analysis (Figure 2a). As the gene was disrupted in the second coding exon, it is unlikely that any truncated protein is produced from the Tsc2– allele.
Table 1.
Embryonic viability of Tsc2–/– mice according to age
Figure 2.
Analysis of Tsc2–/– embryos. (a) Immunoblot analysis demonstrating lack of tuberin expression in null embryos using mAb 5E8. (b) Gross anatomy of Tsc2–/– embryos. (c–f) Histology of Tsc2–/– (c and e) and wild-type (d and f) embryos. (c and d) Full embryo section, identical magnification. Insets indicate area of view enlarged in e and f. (e and f) Liver and adjacent organs, identical magnification. H, heart; L, liver. The Tsc2–/– embryo is overall smaller, and the liver is markedly hypoplastic with dilated sinusoids (arrows) in contrast to the normal liver. Scale bars are 2 mm (b–d) and 200 μm (e and f).
Viable E8–12.5 Tsc2–/– embryos were less developed to a variable extent, typically by 1–2 embryonic days, in comparison with Tsc2+/+ and Tsc2+/– littermates (Figure 2b). These differences were more marked in the Tsc2–/– embryos that survived to E11.5 and E12.5. In addition, Tsc2–/– embryos typically were paler and edematous in gross appearance, and often had pericardial effusions. Exencephaly was seen in 13 (43%) of 30 viable Tsc2–/– E9–12.5 embryos, but it was never seen in Tsc2+/+ and Tsc2+/– matched littermates. Histological analysis of viable Tsc2–/– E9–11.5 embryos demonstrated a markedly hypoplastic liver, with poor development of other abdominal organs, absence of the diaphragm, and a normal size heart that was shifted inferiorly (Figure 2, c and d). The liver and other abdominal organs had dilated vascular channels (Figure 2, e and f). Embryonic death appeared to be due to severe liver hypoplasia with secondary growth retardation and circulatory failure from anemia.
Tsc2+/– mice develop renal, liver, lung, and extremity tumors.
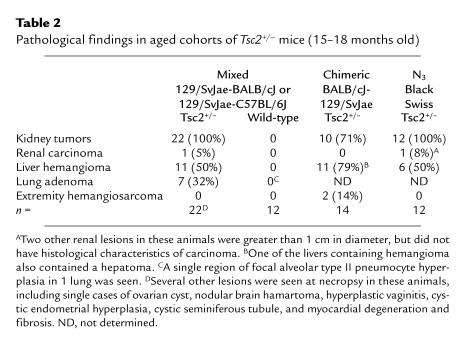
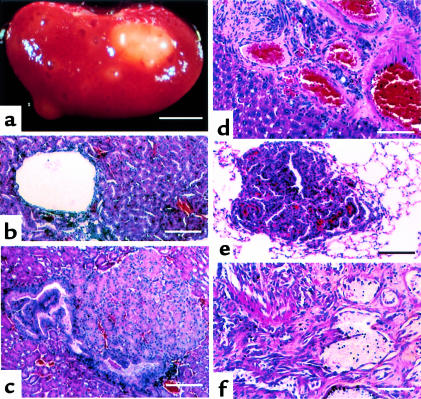
Although survival and development of newborn Tsc2+/– mice was normal, several different tumor types appeared as these animals aged (Table 2). The initial cohort studied in detail consisted of 23 F1 animals in a 50:50 mixed 129/SvJae-BALB/cJ or 129/SvJae-C57BL/6J background. All Tsc2+/– mice developed renal cysts and adenomas by 15 months of age (Figure 3, a–c), as discussed in detail below. Liver hemangiomas were also seen at high frequency (50% by 15 months of age), consisting of dilated vascular channels with aberrant cuboidal-columnar endothelial and smooth muscle cells (Figure 3d), as confirmed by immunohistochemical staining for von Willebrand factor and smooth muscle actin (data not shown). In about 25% of mice 15 months of age, the lesions were large, compressing and compromising normal liver parenchyma. Three of 150 animals maintained until 12 months of age died abruptly and were found to have had massive intraperitoneal bleeding from a liver hemangioma.
Table 2.
Pathological findings in aged cohorts of Tsc2+/– mice (15–18 months old)
Figure 3.
Tumors occurring in Tsc2+/– mice. (a–c) Renal lesions. (a) Gross external appearance, age 15 months. (b) Cyst lesion. (c) Solid adenoma. (d) Liver hemangioma. (e) Lung adenoma. (f) Angiosarcoma of extremity. Scale bars are 4 mm (a), 60 μm (b, c, and e), and 25 μm (d).
Lung tumors also developed in about a third (7/22) of Tsc2+/– mice. These lesions were alveolar adenomas (Figure 3e) and were less than 3 mm in diameter, except for a single lesion in which the diameter was 1.2 cm. They had no clinical consequences for the mice observed thus far.
Angiosarcomas were seen in 10 (7%) of 150 animals maintained until age 12 months. These lesions occurred on the extremities of the mice, being seen in the foot (5 cases), tail (4 cases), and lip (1 case). Histologically, they were invasive sarcomas, with proliferative small cells, aberrant vascular channels, and destruction of bone (Figure 3f). No distant metastases of these lesions were seen, and they grew slowly, doubling in size in 3–6 months.
No comparable lesions were seen in a detailed histological analysis of 12 wild-type F2 generation mice (Table 2).
Pathological and developmental analysis of renal lesions in Tsc2–/– mice.
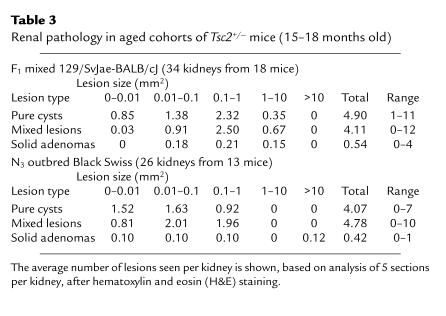
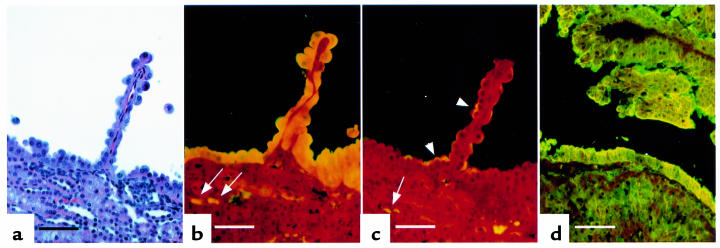
Macroscopic renal cysts and adenomas were seen in every kidney of 15-month-old Tsc2+/– mice (Figure 3a). At histological evaluation of 5 transverse sections per kidney, 2–23 (average, 9.8) lesions were seen exclusively in the cortical region of the kidney (Table 3). We apply the term cystadenomas to these lesions, as they appear to consist of a continuous histological spectrum including pure cysts (Figure 3b), cysts partially filled with papillary fronds of adenomatous growth (Figure 4a), and solid adenomas (Figure 3c). The majority of cystadenomas were pure cysts or cysts with papillary growth.
Table 3.
Renal pathology in aged cohorts of Tsc2+/– mice (15–18 months old)
Figure 4.
Histology and immunohistochemistry of a kidney cyst with papillary projection and of a renal carcinoma. (a) Hematoxylin and eosin stain. Note cyst-lining epithelium. (b) Immunolocalization of gelsolin. (c) Immunolocalization of Na+-H+-ATPase. High-level gelsolin expression (b) and weaker Na+-H+-ATPase expression (c) are seen in the cells lining the cyst and papillary projection. Cortical collecting duct intercalated cells (β type) that express gelsolin (b) and Na+-H+-ATPase (c) are indicated by arrows. (d) Expression of gelsolin in a renal carcinoma. Gelsolin was expressed throughout this tumor, but it was particularly highly expressed in cells lining a cystic space. Scale bars are 30 μm.
Rarely, cystadenomas had a more dense cellular architecture, with cytoplasmic and nuclear atypia, and were expansile, occupying a major portion of the kidney — consistent with progression to renal carcinoma (Figure 4d). None of 150 mice less than 1 year of age had any clinical evidence of these tumors. Two cancers have been found in mice in the mixed 129/SvJae-BALB/cJ or 129/SvJae-C57BL/6J backgrounds, 1 of which was metastatic to the lung.
The cells lining most cysts had a columnar morphology, in contrast to the cuboidal epithelial cells seen in normal renal tubules (Figure 4a), and were atypically rounded up at the apical pole. The epithelial cells making up the solid adenomas were also more columnar and larger, distinct from normal renal tubular epithelial cells (Figure 3c and Figure 5c). To attempt to determine the cellular origin of the cells comprising the cystadenomas, we examined the expression of a series of proteins that are typically expressed in limited segments of the renal tubule (23). Gelsolin expression was found to be uniformly high in the epithelial cells of all cystadenomas and renal carcinomas (Figure 4, b and d) and expression of the Na+-H+-ATPase was also usually seen (Figure 4c). In contrast, neither adseverin nor aquaporin-2 was expressed in any cystadenoma (data not shown). This distinctive staining pattern suggested that the cell of origin of all cystadenomas was the intercalated cell of the cortical collecting duct, as this is the only normal renal tubular cell type whose expression profile matches this profile.
Figure 5.
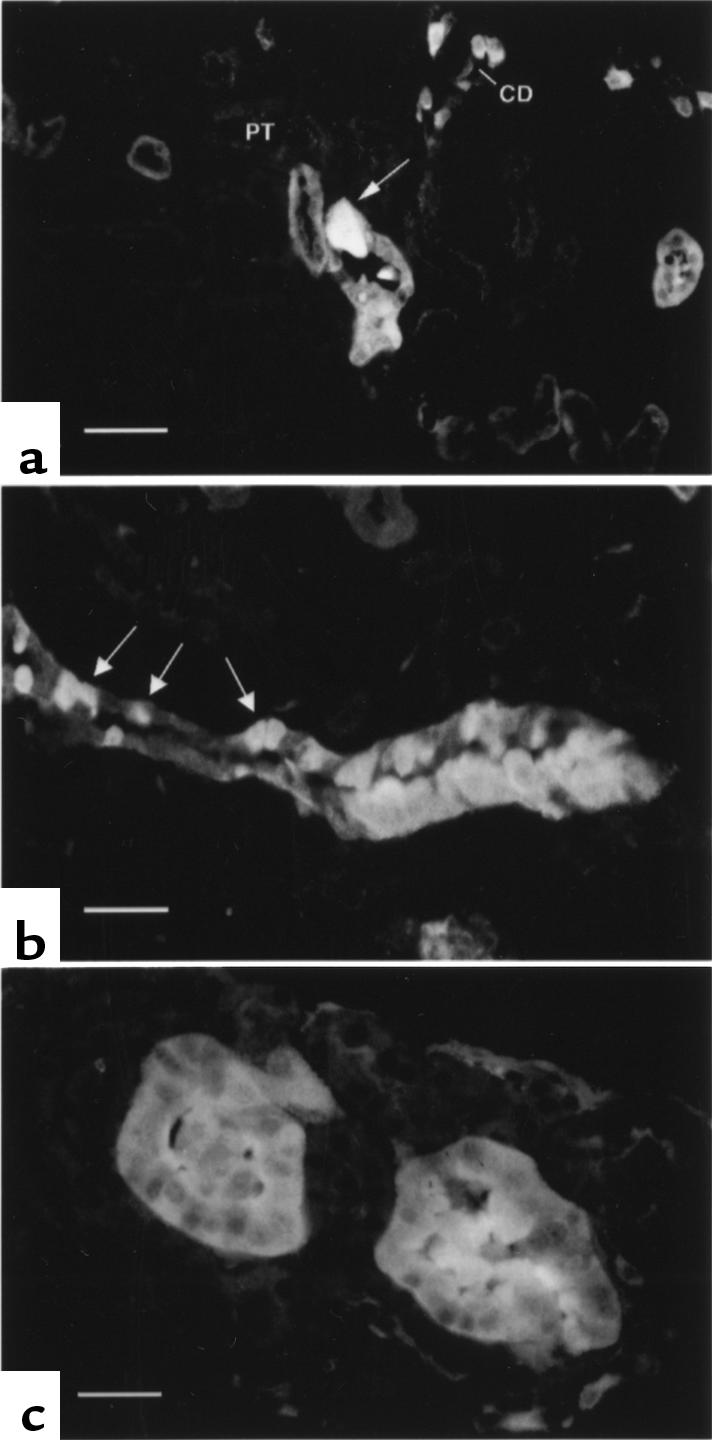
Detection of early renal neoplastic lesions using gelsolin immunolocalization. (a) A single atypical cortical collecting duct cell with intense gelsolin staining in an otherwise normal cortical collecting duct. Proximal tubules (PT) and cortical collecting ducts (CD) are indicated. (b) A cluster of atypical cells highly expressing gelsolin are seen in a cortical collecting duct that also contains normal tubular cells. Normal intercalated cells are indicated by arrows. (c) An early-stage solid adenoma shows high-level gelsolin expression in all cells. Scale bars are 25 μm (a and b) and 15 μm (c).
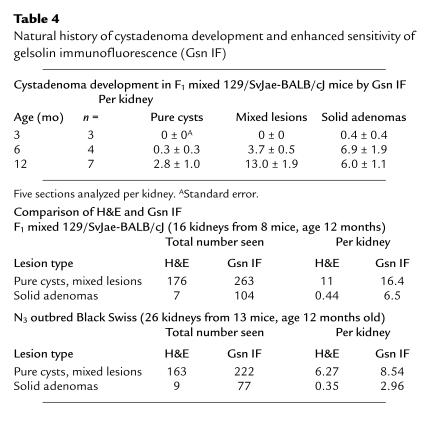
To confirm this interpretation, we examined the kidneys of Tsc2+/– mice at 3, 6, and 12 months of age by routine histology as well as staining for gelsolin expression. Gelsolin immunohistochemistry permitted the detection of rare single abnormal renal cortical tubular cells that could be identified as being distinct from normal tubular cells (Figure 5a). These cells expressed more gelsolin than any normal renal cell and were found exclusively in the cortical collecting duct. They had an increased cell size and distinctive shape that contrasted with surrounding normal tubular cells — including intercalated cells, from which they appeared to be derived, based on their morphologic appearance and gelsolin expression. They were not seen in normal (Tsc2+/+) kidney (23).
Clusters of atypical, gelsolin-positive tubular cells were also seen at relatively high frequency in the kidneys of Tsc2+/– mice beyond the age of 6 months. In some sections, these cell clusters were seen to occupy a portion of a cortical collecting duct that included some normal cells (Figure 5b); in other sections, they comprised an entire tubule consisting of hyperplastic cells (Figure 5c). The number of cystadenomas steadily increased as the mice aged (Table 4), likely reflecting the progressive growth of these abnormal proliferative cells. However, few large lesions developed even in older mice, indicating a slow growth rate. Gelsolin immunohistochemistry permitted the identification of many more proliferative lesions of all types, particularly solid adenomas, indicating its utility as a sensitive marker of tumor development (Table 4).
Table 4.
Natural history of cystadenoma development and enhanced sensitivity of gelsolin immunofluorescence (Gsn IF)
Loss of expression of tuberin occurs in renal cystadenomas and other lesions.
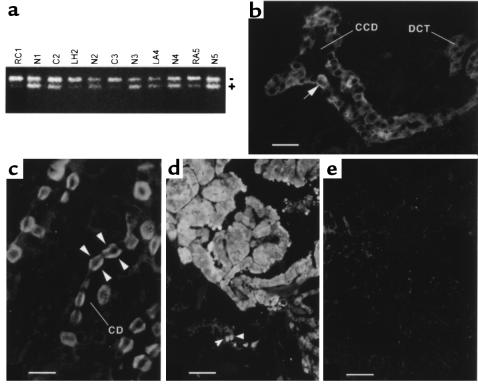
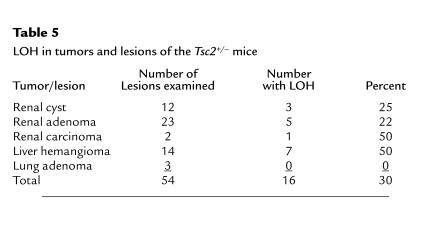
Because TSC2 has been shown to act as a tumor-suppressor gene both in patients with TSC and in the Eker rat, we expected that tuberin expression would be completely lost by genetic or epigenetic mechanisms in the tumors of Tsc2+/– mice. We looked for loss of the Tsc2+ allele (LOH) in lesions from Tsc2+/– mice by PCR analysis. LOH was seen in 16 (30%) of 54 lesions analyzed, including 9 (24%) of 37 renal cystadenomas and carcinomas, and 7 (50%) of 14 liver hemangiomas (Figure 6a and Table 5).
Figure 6.
Loss of tuberin expression in Tsc2+/– lesions. (a) LOH PCR analysis. The upper band (–) represents the targeted allele; the lower band (+), the wild-type allele. RC, renal carcinoma; C, cyst; LH, liver hemangioma; N, normal control tissue; LA, lung adenoma; RA, renal adenoma. Numbers 1–5 are the animal numbers. Those scored as showing LOH are RC1, LH2, C3, and RA5. (b) Immunolocalization of tuberin in mouse kidney cortex. Tuberin was expressed in intercalated cells (arrow), and to a lesser extent in principal cells, of cortical collecting ducts (CCD) and distal convoluted tubule (DCT). (c) Tuberin expression in intercalated cells of medullary collecting ducts (CD), localized to both the apical and basolateral poles (arrowheads). (d) Expression of gelsolin in a cystadenoma. Intercalated cells of adjacent collecting ducts that also express gelsolin are indicated by arrowheads. (e) Parallel section to b, showing absence of tuberin expression in a cystadenoma. Scale bars are 20 μm (b), 10 μm (c), and 40 μm (d and e).
Table 5.
LOH in tumors and lesions of the Tsc2+/– mice
We also looked for loss of tuberin expression by immunohistochemistry. In normal mouse kidney, tuberin expression was restricted to intercalated cells, and to a lesser extent, principal cells, of the cortical collecting duct and distal convoluted tubule (Figure 6b), and to intercalated cells of the medullary collecting ducts (Figure 6c). The expression of tuberin in cortical collecting duct intercalated cells clearly matched well with the identification of these cells as the cell of origin of the cysts and adenomas that occur in Tsc2+/– mice.
Tuberin expression was not seen in the great majority of cystadenomas (Figure 6, d and e), but low-level expression was occasionally noted. This is also consistent with the 2-hit mechanism of tumor development in the Tsc2+/– mice.
Gelsolin expression is also high in other tumors occurring in the Tsc2+/– mice.
Because gelsolin expression was a highly sensitive and specific marker of the earliest stage of renal cystadenoma development, we examined gelsolin expression in other lesions developing in the Tsc2+/– mice. Gelsolin was highly expressed in liver hemangiomas, lung adenomas, and angiosarcomas (data not shown). This was particularly striking in the liver, where gelsolin expression is absent in hepatocytes and most other cell types. Similar to analysis in the kidney, gelsolin expression in the hemangiomas permitted identification of these lesions in some sections when morphologic features alone were inconclusive.
Expression of the Tsc2+/– phenotype is strain-dependent.
We initiated an analysis for potential strain-specific modifier alleles of the Tsc2+/– phenotype by breeding the Tsc2– allele into outbred Black Swiss mice. At the third backcross (N3: 87.5% Black Swiss, 12.5% mixed 129/SvJae-BALB/cJ), Tsc2+/– animals were aged and compared with the original cohort of Tsc2+/– animals. N3 Tsc2+/– Black Swiss mice displayed similar numbers of tumors at histological analysis, compared with the mixed 129/SvJae-BALB/cJ animals, with 2 differences (Table 3). First, no cystadenomas of 1–10 mm2 size were seen in the Black Swiss cohort (26 kidneys examined), whereas an average of 1.17 of these lesions were seen per kidney in the mixed 129/SvJae-BALB/cJ mice (P < 0.001 by Fisher’s exact test). Second, 3 of the Black Swiss mice had large solid adenomatous lesions occupying the majority of 1 kidney (>10 mm2), 1 of which displayed both cellular features and invasion of normal structures, consistent with progression to carcinoma. No tumors of this size were seen in the original F1 cohort observed to this age (P = 0.076 by Fisher’s exact test).
Thirteen chimeric animals were also followed up longitudinally for 15 months. The pathological findings among these animals were similar to those of the full Tsc2+/– mice, with the exception that angiosarcomas were more frequent, occurring in 2 (14%) of 14 animals (Table 2; P = 0.14 by Fisher’s exact test) compared with 0 of 22 in the F1 generation.
Discussion
We have generated an inactivated allele of the Tsc2 gene in mice, demonstrated that Tsc2–/– is embryonic lethal, and shown that the Tsc2+/– mice develop a diverse set of neoplastic growths. The findings are of interest in considering the function of tuberin, and in comparison with TSC patients, the Eker (Tsc2+/i) rat (18, 24, 25), and another, recently described murine Tsc2 knockout (26).
A hallmark of TSC is that malignant progression of hamartomas in either a biologic or pathological manner is unusual (1). Brain subependymal hamartomas may grow during childhood, and then usually stabilize or even regress with calcification. They occasionally enlarge to the point of requiring surgical removal due to obstructive hydrocephalus (1, 27). Renal and other TSC angiomyolipomas generally have limited growth potential and only occasionally enlarge with complications of bleeding or renal function compromise (28). Rarely (<5%) do patients with TSC develop malignant tumors of the kidney, and these appear to occur primarily as malignant progression of angiomyolipomas and are distinct from conventional renal cell carcinoma (29, 30).
Although the spectrum of pathology seen in the Tsc2+/– mice clearly differs from that in patients, there is good concordance with the relatively slow growth rate of the tumors seen and with the limited conversion to biologic and pathological malignancy. There are at least 100 cystadenomas per kidney in 15-month-old Tsc2+/– mice (Table 4). In contrast, only 3 of 150 animals observed to the age of 12 months developed pathological renal carcinoma, and only 1 of these developed lung metastases. Similarly, the lung, liver, and extremity tumors all generally display a relatively slow growth rate. Thus, the tumors that develop in TSC patients and those that develop in Tsc2+/– mice have similar biologic behavior.
Our findings contrast in some ways with those made in the Eker rat (18, 24, 25, 31). Renal cystadenomas are seen at similar frequency in the Eker (Tsc2+/i) rat, but Eker rat hemangiomas occur in the spleen and uterus, not the liver (25). Eker rats also develop pituitary tumors and cerebral hamartomas (25, 31), lesions that we have not seen to date in the Tsc2+/– mice. Lung tumors and extremity angiosarcomas have not been reported in the Eker rat. These differences are likely due to genetic differences between the mouse and rat, rather than to differences in the expression and function of tuberin in the 2 species. The high degree of similarity suggests that the Eker rat mutation is inactivating. Our characterization of tumor development and progression in Tsc2+/– mice is similar to, but extends, the findings of Kobayashi et al. (26).
The site-specific tumorigenesis in Tsc2+/– mice presumably reflects those cells that require tuberin function for cell growth control and in which inactivation of the second Tsc2 allele occurs. Our studies indicate that LOH for the normal Tsc2 allele is often seen (30%; Table 5) in the tumors and cysts from Tsc2+/– mice, but is not uniform, suggesting that other mechanisms of inactivation of the second allele also occur. We have shown that tuberin is most highly expressed in intercalated cells of the cortical and medullary collecting ducts of the kidney, and that tuberin expression is uniformly downregulated in cystadenomas, consistent with a critical role of tuberin in growth control for intercalated cells, which are the progenitor cells for the cystadenomas. Similar findings on tuberin expression in rat cortical collecting duct intercalated cells have been made by others (V. Ramesh and D. Brown, unpublished observations).
It appears that malignant progression of renal cystadenomas to carcinoma requires additional genetic or epigenetic events that further dysregulate cell growth control, given the high incidence of multiple renal cystadenomas in Tsc2+/– mice and the low rate of development of renal carcinoma. The observations are reminiscent of the APC mouse, in which numerous intestinal adenomatous polyps develop and individually progress to carcinoma at a very slow rate, fitting with a model in which tuberin functions as a “gatekeeper” in regulating the earliest steps in cell growth control and tumorigenesis (32).
Several developmental abnormalities were found in the Tsc2–/– embryos in comparison with matched littermates, including a developmental delay of 1–2 days, delay in neural tube closure, mild cardiac anomalies, and marked hepatic hypoplasia. The hepatic hypoplasia is most striking among these findings, and we suspect that it is the cause of global developmental delay and death. The cardiac changes and vascular dilatation probably reflect severe anemia due to poor liver function and are not a primary defect, in contrast to the findings of Kobayashi et al. (26). This observation suggests a previously unsuspected critical function of tuberin in liver development.
We found that gelsolin is a sensitive and specific protein marker for renal cystadenomas and carcinomas. This appears to reflect the cell of origin of these lesions, but may also be due to a transcriptional effect of the loss of tuberin function, as cystadenoma cells usually had a higher level of gelsolin expression than any other normal renal cell. We also saw gelsolin expression in the liver, extremity, and lung tumors of these mice. Gelsolin is widely expressed in many cell types, although not uniformly in the kidney (23), and has been observed to be downregulated during tumorigenesis of the breast, bladder, and lung in humans and mice (33–36). Whether gelsolin expression is necessary for cystadenoma development can now be tested by analysis of Tsc2+/–gsn–/– mice (21). Nonetheless, gelsolin immunohistochemistry will be helpful in delineating cystadenoma onset and progression.
We have provided evidence for strain-specific differences in the tumor phenotype of the heterozygote mice. Peripheral angiosarcomas were seen more frequently in the chimeric animals, suggesting that the gene defect in 129/SvJae strain background confers a higher incidence of this particular tumor. Moreover, we have seen strong evidence for strain differences in the rate of development of renal cystadenomas between mixed backgrounds and N3 Black Swiss outbred mice (Table 3). Further analysis in more defined genetic backgrounds is required, but the results are consistent with the high variability of TSC within families (1), suggesting the existence of modifier genes.
Acknowledgments
This research was supported by the National Tuberous Sclerosis Association, the March of Dimes, and the National Institutes of Health (grant NS31535). We thank Ervin Meluleni, Jenny Bandura, and Johnny Lee for technical assistance; Silvio Litovsky (Children’s Hospital, Boston, Massachusetts, USA) and Rod Bronson (Tufts University Medical School, Boston, Massachusetts, USA) for assistance with embryonic pathology; Walter Witke for assistance with ES cell culture; and Vijaya Ramesh and Dennis Brown (Massachusetts General Hospital, Boston, Massachusetts, USA) for sharing unpublished data.
References
- 1.Gomez, M., Sampson, J., and Whittemore, V. 1999. The tuberous sclerosis complex. Oxford University Press. Oxford, United Kingdom. 340 pp.
- 2.Henske EP, et al. Loss of tuberin in both subependymal giant cell astrocytomas and angiomyolipomas supports a two-hit model for the pathogenesis of tuberous sclerosis tumors. Am J Pathol. 1997;151:1639–1647. [PMC free article] [PubMed] [Google Scholar]
- 3.Henske EP, et al. Allelic loss is frequent in tuberous sclerosis kidney lesions but rare in brain lesions. Am J Hum Genet. 1996;59:400–406. [PMC free article] [PubMed] [Google Scholar]
- 4.Carbonara C, et al. Apparent preferential loss of heterozygosity at TSC2 over TSC1 chromosomal region in tuberous sclerosis hamartomas. Genes Chromosomes Cancer. 1996;15:18–25. doi: 10.1002/(SICI)1098-2264(199601)15:1<18::AID-GCC3>3.0.CO;2-7. [DOI] [PubMed] [Google Scholar]
- 5.Green AJ, Smith M, Yates JR. Loss of heterozygosity on chromosome 16p13.3 in hamartomas from tuberous sclerosis patients. Nat Genet. 1994;6:193–196. doi: 10.1038/ng0294-193. [DOI] [PubMed] [Google Scholar]
- 6.The European Chromosome 16 Tuberous Sclerosis Consortium. Identification and characterization of the tuberous sclerosis gene on chromosome 16. Cell. 1993;75:1305–1315. doi: 10.1016/0092-8674(93)90618-z. [DOI] [PubMed] [Google Scholar]
- 7.van Slegtenhorst M, et al. Identification of the tuberous sclerosis gene TSC1 on chromosome 9q34. Science. 1997;277:805–808. doi: 10.1126/science.277.5327.805. [DOI] [PubMed] [Google Scholar]
- 8.Xiao GH, Shoarinejad F, Jin F, Golemis EA, Yeung RS. The tuberous sclerosis 2 gene product, tuberin, functions as a Rab5 GTPase activating protein (GAP) in modulating endocytosis. J Biol Chem. 1997;272:6097–6100. doi: 10.1074/jbc.272.10.6097. [DOI] [PubMed] [Google Scholar]
- 9.Wienecke R, Konig A, DeClue JE. Identification of tuberin, the tuberous sclerosis-2 product. Tuberin possesses specific Rap1GAP activity. J Biol Chem. 1995;270:16409–16414. doi: 10.1074/jbc.270.27.16409. [DOI] [PubMed] [Google Scholar]
- 10.Tsuchiya H, Orimoto K, Kobayashi K, Hino O. Presence of potent transcriptional activation domains in the predisposing tuberous sclerosis (Tsc2) gene product of the Eker rat model. Cancer Res. 1996;56:429–433. [PubMed] [Google Scholar]
- 11.Soucek T, Yeung RS, Hengstschlager M. Inactivation of the cyclin-dependent kinase inhibitor p27 upon loss of the tuberous sclerosis complex gene-2. Proc Natl Acad Sci USA. 1998;95:15653–15658. doi: 10.1073/pnas.95.26.15653. [DOI] [PMC free article] [PubMed] [Google Scholar]
- 12.Henry KW, et al. Tuberous sclerosis gene 2 product modulates transcription mediated by steroid hormone receptor family members. J Biol Chem. 1998;273:20535–20539. doi: 10.1074/jbc.273.32.20535. [DOI] [PubMed] [Google Scholar]
- 13.van Slegtenhorst M, et al. Interaction between hamartin and tuberin, the TSC1 and TSC2 gene products. Hum Mol Genet. 1998;7:1053–1058. doi: 10.1093/hmg/7.6.1053. [DOI] [PubMed] [Google Scholar]
- 14.Plank TL, Yeung RS, Henske EP. Hamartin, the product of the tuberous sclerosis 1 (TSC1) gene, interacts with tuberin and appears to be localized to cytoplasmic vesicles. Cancer Res. 1998;58:4766–4770. [PubMed] [Google Scholar]
- 15.Young JM, et al. A mutation screen of the TSC1 gene reveals 26 protein truncating mutations and 1 splice site mutation in a panel of 79 tuberous sclerosis patients. Ann Hum Genet. 1998;62:203–213. doi: 10.1046/j.1469-1809.1998.6230203.x. [DOI] [PubMed] [Google Scholar]
- 16.Kwiatkowska J, et al. Comprehensive mutational analysis of the TSC1 gene: observations on frequency of mutation, associated features, and nonpenetrance. Ann Hum Genet. 1998;62:277–285. doi: 10.1046/j.1469-1809.1998.6240277.x. [DOI] [PubMed] [Google Scholar]
- 17.Jones AC, et al. Comprehensive mutation analysis of TSC1 and TSC2 and phenotypic correlations in 150 families with tuberous sclerosis. Am J Hum Genet. 1999;64:1305–1315. doi: 10.1086/302381. [DOI] [PMC free article] [PubMed] [Google Scholar]
- 18.Eker R, Mossige J, Johannessen JV, Aars H. Hereditary renal adenomas and adenocarcinomas in rats. Diagn Histopathol. 1981;4:99–110. [PubMed] [Google Scholar]
- 19.Yeung RS, et al. Predisposition to renal carcinoma in the Eker rat is determined by germ-line mutation of the tuberous sclerosis 2 (TSC2) gene. Proc Natl Acad Sci USA. 1994;91:11413–11416. doi: 10.1073/pnas.91.24.11413. [DOI] [PMC free article] [PubMed] [Google Scholar]
- 20.Kobayashi T, Hirayama Y, Kobayashi E, Kubo Y, Hino O. A germline insertion in the tuberous sclerosis (Tsc2) gene gives rise to the Eker rat model of dominantly inherited cancer. Nat Genet. 1995;9:70–74. doi: 10.1038/ng0195-70. [DOI] [PubMed] [Google Scholar]
- 21.Witke W, et al. Hemostatic, inflammatory, and fibroblast responses are blunted in mice lacking gelsolin. Cell. 1995;81:41–51. doi: 10.1016/0092-8674(95)90369-0. [DOI] [PubMed] [Google Scholar]
- 22.Azuma T, Witke W, Stossel TP, Hartwig JH, Kwiatkowski DJ. Gelsolin is a downstream effector of rac for fibroblast motility. EMBO J. 1998;17:1362–1370. doi: 10.1093/emboj/17.5.1362. [DOI] [PMC free article] [PubMed] [Google Scholar]
- 23.Lueck A, Brown D, Kwiatkowski D. The actin-binding proteins adseverin and gelsolin are both highly expressed but differentially localized in kidney and intestine. J Cell Sci. 1998;111:3633–3643. doi: 10.1242/jcs.111.24.3633. [DOI] [PubMed] [Google Scholar]
- 24.Everitt J, Goldsworthy T, Wolf D, Walker C. Hereditary renal cell carcinoma in the Eker rat: a rodent familial cancer syndrome. J Urol. 1992;148:1932–1936. doi: 10.1016/s0022-5347(17)37087-8. [DOI] [PubMed] [Google Scholar]
- 25.Kubo Y, et al. Allelic loss at the tuberous sclerosis (Tsc2) gene locus in spontaneous uterine leiomyosarcomas and pituitary adenomas in the Eker rat model. Jpn J Cancer Res. 1995;86:828–832. doi: 10.1111/j.1349-7006.1995.tb03092.x. [DOI] [PMC free article] [PubMed] [Google Scholar]
- 26.Kobayashi T, et al. Renal carcinogenesis, hepatic hemangiomatosis, and embryonic lethality caused by a germ-line Tsc2 mutation in mice. Cancer Res. 1999;59:1206–1211. [PubMed] [Google Scholar]
- 27.Shepherd CW, Scheithauer BW, Gomez MR, Altermatt HJ, Katzmann JA. Subependymal giant cell astrocytoma: a clinical, pathological, and flow cytometric study. Neurosurgery. 1991;28:864–868. [PubMed] [Google Scholar]
- 28.Ewalt DH, Sheffield E, Sparagana SP, Delgado MR, Roach ES. Renal lesion growth in children with tuberous sclerosis complex. J Urol. 1998;160:141–145. [PubMed] [Google Scholar]
- 29.Al-Saleem T, et al. Malignant tumors of the kidney, brain, and soft tissues in children and young adults with the tuberous sclerosis complex. Cancer. 1998;83:2208–2216. [PubMed] [Google Scholar]
- 30.Sampson JR, Patel A, Mee AD. Multifocal renal cell carcinoma in sibs from a chromosome 9 linked (TSC1) tuberous sclerosis family. J Med Genet. 1995;32:848–850. doi: 10.1136/jmg.32.11.848. [DOI] [PMC free article] [PubMed] [Google Scholar]
- 31.Yeung RS, Katsetos CD, Klein-Szanto A. Subependymal astrocytic hamartomas in the Eker rat model of tuberous sclerosis. Am J Pathol. 1997;151:1477–1486. [PMC free article] [PubMed] [Google Scholar]
- 32.Kinzler, K., and Vogelstein, B. 1998. Familial cancer syndromes: the role of caretakers and gatekeepers. In The genetic basis of human cancer. B. Vogelstein and K. Kinzler, editors. McGraw-Hill. New York, NY. 241–242.
- 33.Shieh DB, et al. Cell motility as a prognostic factor in stage I non-small cell lung cancer: role of gelsolin expression. Cancer. 1999;85:47–57. doi: 10.1002/(sici)1097-0142(19990101)85:1<47::aid-cncr7>3.0.co;2-l. [DOI] [PubMed] [Google Scholar]
- 34.Dosaka-Akita H, et al. Frequent loss of gelsolin expression in non-small cell lung cancers of heavy smokers. Cancer Res. 1998;58:322–327. [PubMed] [Google Scholar]
- 35.Asch HL, et al. Widespread loss of gelsolin in breast cancers of humans, mice, and rats. Cancer Res. 1996;56:4841–4845. [PubMed] [Google Scholar]
- 36.Tanaka M, et al. Gelsolin: a candidate for suppressor of human bladder cancer. Cancer Res. 1995;55:3228–3232. [PubMed] [Google Scholar]


