

Significance
How cells position their proteins is still an open question. Here, we propose a physical description of centrosomes, which are membraneless organelles involved in cell division. In our model, centrosome material occurs in a soluble form and a form that tends to form droplets by phase separation. We find that an autocatalytic chemical transition between these forms quantitatively accounts for our experimental data. Importantly, a catalytic activity of the centrioles, which are located inside centrosomes, can control centrosome nucleation and suppress Ostwald ripening to allow for two equal-sized centrosomes to coexist in the cell. Consequently, our example shows how the combination of chemical reactions and phase separation can be used to control the formation of liquid-like compartments in cells.
Abstract
Centrosomes are highly dynamic, spherical organelles without a membrane. Their physical nature and their assembly are not understood. Using the concept of phase separation, we propose a theoretical description of centrosomes as liquid droplets. In our model, centrosome material occurs in a form soluble in the cytosol and a form that tends to undergo phase separation from the cytosol. We show that an autocatalytic chemical transition between these forms accounts for the temporal evolution observed in experiments. Interestingly, the nucleation of centrosomes can be controlled by an enzymatic activity of the centrioles, which are present at the core of all centrosomes. This nonequilibrium feature also allows for multiple stable centrosomes, a situation that is unstable in equilibrium phase separation. Our theory explains the growth dynamics of centrosomes for all cell sizes down to the eight-cell stage of the Caenorhabditis elegans embryo, and it also accounts for data acquired in experiments with aberrant numbers of centrosomes and altered cell volumes. Furthermore, the model can describe unequal centrosome sizes observed in cells with perturbed centrioles. We also propose an interpretation of the molecular details of the involved proteins in the case of C. elegans. Our example suggests a general picture of the organization of membraneless organelles.
How cells organize their interior is still an open question (1). For instance, the size, the count, and the position of cellular substructures must be controlled to ensure proper function. Indeed, the size of many cell organelles, such as the mitotic spindle, centrosomes, and the nucleus, is correlated with cell size, bringing up the question of how cells both determine and adjust the size of their substructures (2, 3). An interesting situation arises in the case of non–membrane-bound organelles, e.g., the mitotic spindle, Cajal bodies, or germ granules, where the flux of material across the interface between the organelle and the cytosol is not controlled by an enclosing membrane (4, 5). Instead, these structures often consist of many different components exchanging quickly with the surrounding cytosol, while maintaining a well-defined spatial organization. This turnover suggests that elastic stresses can relax and are thus unimportant for dynamics on long time scales, which is a characteristic property of complex fluids. In the case of germ granules it has been shown that their behavior can be explained by considering them as liquid droplets (6). Other cell organelles are also good candidates for a description as drop-like objects (4). In the case of metaphase spindles, a theoretical description based on liquid crystal properties led to predictions of spindle size as a function of kinetic parameters that was confirmed experimentally (7).
Centrosomes are examples of organelles without a membrane that can occur in varying sizes. However, the mechanisms regulating their size and their growth kinetics are not understood (8). Centrosomes play a key role in organizing the microtubule network of the cell, most notably the mitotic spindle during cell division (9). In particular, it has been shown that in the nematode Caenorhabditis elegans, centrosome size directly sets the length of the mitotic spindle (10). Generally, centrosomes consist of a pair of centrioles embedded in a matrix of pericentriolar material (PCM). This structure has a dynamic life cycle in cells: Centrioles are duplicated (11, 12) and two centrosomes grow by accumulating PCM to organize the mitotic spindle. After anaphase, centrosomes disassemble and each daughter cell inherits one pair of centrioles after cell division. The proteins required for this centrosome cycle are known (13) and at least one of them was shown to be limiting for centrosome size in C. elegans (14). Furthermore, the centrioles also influence the assembly of PCM (15), many centrosome proteins turn over quickly (8), and the PCM is permeable and permits the diffusion of a number of proteins (16).
The nucleation and growth of centrosomes has been thoroughly examined in the early divisions in C. elegans embryos (14). Here, as in all systems, centrosome growth always begins at centriole pairs. Because there are only two centriole pairs, there are only two centrosomes in a cell. After nucleation, centrosome size follows a sigmoidal growth curve (14). Importantly, the growth rate and the final centrosome size depend on the size of the cell. In the divisions of early C. elegans embryos, all material has been provided by the mother, and no new material is made during the course of cell divisions (17). Therefore, the same components are reused in subsequent divisions by a process of growth and disassembly. This has led to the hypothesis that centrosome size is determined by a limiting component that is depleted from the cytosol as centrosomes grow (14). Centrosomes then disassemble at the end of cell division and the components are available for the next cell cycle. Centrosome formation has all the hallmarks of a nucleation and growth process, but currently the physical nature of the centrosome and its dynamics are not understood (8). Centrosomes are complex objects that consist of many components. However, only a few components are required for their formation (13), which allows us to seek for a simplified, minimal description to highlight essential properties. In general, any theory of centrosome growth must explain the following key features: (i) Nucleation at centrioles must be extremely reliable. Thus, there must be a mechanism to suppress nucleation in the cytosol, whereas nucleation at the centrioles must be guaranteed. (ii) The sigmoidal growth curve must be accounted for. (iii) The coexisting centrosomes must be stable, spherical, and of similar size, whereas components can both exchange with the cytosol and internally rearrange. (iv) The size of the centrosome must depend on cell size. In this paper, we develop a physical description that can quantitatively account for these centrosome properties.
Physical Description of Centrosomes as Active Droplets
Centrosome growth is an aggregation process of a condensed phase of PCM components, which segregate from the cytosol. The aggregation process leads to a centrosome phase that coexists with the cytosol and does rearrange internally. This implies that the centrosome phase is viscoelastic, such that on long timescales it behaves as a liquid-like material. Thus, in our picture, centrosome material phase separates from the cytosol. Because centrosome growth requires kinase activity (14), the most likely scenario is that two phosphorylation states of PCM components have different assembly properties (Fig. 1). The phosphorylation reaction permits the cell to regulate assembly and disassembly of centrosomes. We propose a simplified model of centrosome assembly based on the idea that PCM is made of subunits that can exist in two different forms: (i) building blocks that dissolve in the cytosol (we call this form A) and (ii) droplet material that phase separates from the cytosol and produces centrosomes (we call this form B). In the case of C. elegans centrosomes, these two forms could be related to different conformations of the same structural protein, e.g., spindle defect protein-5 (SPD-5). Phosphorylation mediated by kinases like PLK-1 could then change the conformation of the structural protein and thereby influence its physical properties (Fig. 1).
Fig. 1.

Representation of a centrosome consisting of centrioles (blue) surrounded by a dense phase (orange) of PCM. In our model, the PCM components exist in two conformations: a form A that dissolves in the cytosol (globular shape) and a form B that segregates from the cytosol in a droplet phase (elongated shape). The dynamics of the system are governed by diffusion of the components and transitions between the A and B forms in the bulk and at the centrioles. (Lower Right) Phosphorylating the PCM components (open white circles becoming solid black circles) could induce a conformational change, which exposes binding sites (dark red patches). (Lower Left) Schematic representation of a cell with two centrosomes.
An important question is to understand why centrosome material aggregates only around centrioles. This implies that the centrioles act as a nucleator and at the same time spontaneous nucleation in the cytosol is suppressed. Either the centrioles could act as a passive nucleator in a so-called heterogeneous nucleation while the chemical transition from form A to form B happens away from the centrioles or the centrioles themselves could act as an active nucleator by catalyzing the chemical transition from A to B. To address such questions, we next develop the basic physical equations for centrosome assembly involving diffusion, chemical transitions, and phase separation.
Reaction–Diffusion Kinetics.
We first consider the diffusion of the forms A and B of PCM components. The local composition of the cytosol and the droplets is characterized by the volume fractions ϕA of soluble building blocks and ϕB of droplet material. The components can diffuse and undergo chemical reactions in the cytosol and in the droplets. The droplets are separated from the cytosol by an interface region, which for simplicity we consider to be infinitely thin and describe separately. The diffusion constants DA and DB of the two forms may then in general differ between the droplets and the cytosol. The diffusion and the chemical transitions can be described by reaction–diffusion equations,
| [1a] |
| [1b] |
which are valid both inside and outside of droplets, but not at the interface between droplets and cytosol (see below). Here, the chemical reactions A ⇌ B, which convert the material between form A and form B, are quantified by the rate s. This rate depends on the local composition and enters as a sink in Eq. 1a and as a source in Eq. 1b. We propose the simple form of the bulk reaction terms
| [2] |
where kAB and kBA are the rate constants for the first-order reactions A → B and B → A, respectively. The coefficient k in the last term describes the bimolecular reaction A + B → 2B. This accounts for a possible autocatalytic mechanism, where the presence of droplet material B catalyzes its own production from form A. Note that the autocatalytic reaction will typically dominate inside the droplet, where the form B is enriched. Eq. 2 contains the lowest-order contributions of reactions that can account for droplet growth.
The reaction–diffusion equations cause diffusive fluxes, which can be discussed most easily in a spherical symmetry around the centriole pair, where the volume fractions depend on the radial distance r. In this case, the total volume flux of form i passing a spherical shell at distance r is given by
| [3] |
where Ji has units of volume per time and i = A, B.
The effect of the centriole pair is to introduce a boundary condition at r = a, where a is the radius of the sphere representing the centriole pair. We set a = 75 nm, which is half the length of a single centriole (12). If centrioles play only a passive role, we would impose no-flux boundary conditions on their surface. However, motivated by the fact that the structure of the centrioles can influence centrosome size (15), we propose that centrioles can also produce droplet material; i.e., they catalyze the chemical reaction A → B in our model. This reaction induced by the centrioles is quantified by the total volume per unit time of PCM components that is converted from form A to form B. We write this flux as QϕA(a), which implies a first-order reaction at the centrioles, where the coefficient Q describes the centriolar enzymatic activity. The amount of PCM components is conserved, yielding
| [4] |
which is a boundary condition for Eqs. 1a and 1b.
We assume that the total amount of PCM components in the cell is constant and impose no-flux conditions at the system boundary. Material conservation then implies
| [5] |
where Vc is the total volume of the cell and denotes the average volume fraction of the PCM components in the system.
Phase Separation of Droplet Material.
So far, the reaction–diffusion system given in Eqs. 1a and 1b together with the activity at the centrioles can create a locally increased concentration of form B that gradually decreases at larger distances from the centrioles. However, we have not yet accounted for the interface that separates the PCM phase from the cytosol.
Formation of a PCM phase can be accounted for by phase separation of form B from the cytosol. Considering the centrosome as a droplet phase that separates from the cytosol implies that across the centrosome surface different volume fractions of PCM components coexist inside and outside the centrosome. The approximation of local thermodynamic equilibrium implies that the chemical potential can be defined locally and is a continuous function in space. This also holds across the interface between the droplet and the cytosol and introduces a boundary condition at the interface. Additionally, the pressure difference between the inside and outside is given by the Laplace pressure 2γ/R, which is generated by the surface tension γ of the curved interface. Here, the mean curvature of the interface is R−1, where R is the radius of the spherical droplet representing the centrosome. Using these thermodynamic principles, we can obtain conditions for the volume fractions of form B inside and outside the droplet, which we call and , respectively. These volume fractions are of the form
| [6] |
where ψ− and ψ+ are the volume fractions that would occur at a flat interface and the coefficients β− and β+ describe the effects of the Laplace pressure on the volume fractions at the interface (Appendix: Phase Separation in a Ternary Fluid).
In our model, form A is soluble in the cytosol and for simplicity has the same physical properties as cytosol with respect to the phase separation process. Therefore, the volume fraction ratio of form A and cytosol is the same inside and outside of the droplet. This can be expressed as
| [7] |
(Appendix: Phase Separation in a Ternary Fluid). Droplet growth is driven by the addition of droplet material. Changes in volume can thus be related to the volume fluxes of the B form in and out of the droplet. This leads to the droplet growth rate (Appendix: Droplet Growth Kinetics)
| [8] |
where the volume fluxes and at the droplet surface are the limits of Eq. 3 approaching the interface from the inside and outside, respectively. The material conservation at the interface also yields a boundary condition for the flux of the soluble material A (Appendix: Droplet Growth Kinetics, Eq. 19). The flux outside the droplet surface results from diffusion in the cytosol. Given a volume fraction of the B component far from the droplet, this flux can be approximated as (Appendix: Droplet Growth Kinetics)
| [9] |
The flux of droplet material is thus driven by the difference between the volume fraction at the droplet interface and the fraction far away. This expression is valid for droplets small compared with a characteristic length set by the chemical reactions, R ≪ (DB/kBA)1/2 (Appendix: Droplet Growth Kinetics).
We have thus developed a general framework of centrosome assembly, which involves an insoluble form B that phase separates and forms PCM droplets with a sharp interface to the cytosol (Eqs. 6 and 7). Such droplets grow by accumulating droplet material (Eq. 8). Droplet material B is produced from the soluble form A by chemical reactions that can occur both in the bulk and at the centrioles (Eqs. 1, 2, and 4). Form A is thus depleted from the cytosol until a steady-state centrosome is formed.
Nucleation and Growth of PCM Droplets
We now consider whether the four key features of centrosome assembly can be accounted for, using the reaction–diffusion and phase separation equations that we established. To examine this, we consider several possible assembly scenarios and eliminate those that do not account for centrosome behavior in C. elegans. To recap, centrosomes in C. elegans nucleate at centrioles, where they first grow slowly and then accelerate before reaching a plateau (Introduction).
Catalytic Centrioles Can Reliably Nucleate Centrosomes.
One way to achieve reliable nucleation is that form B is created at the centrioles by the catalytic activity Q, but not in the cytosol. The simplest case corresponds to Q > 0, setting both the first-order reaction rate and the autocatalytic reaction rate to zero (kAB = 0, k = 0) and keeping kBA > 0. Droplets are then nucleated and grow around the centrioles if the production of droplet material at the active centrioles, quantified by the flux QϕA(a), is strong enough to overcome the loss of droplet material via the efflux given by Eq. 9. As a result, a characteristic centriole activity
| [10] |
exists, beyond which nucleation is guaranteed and growth occurs (Appendix: Droplet Growth Kinetics). Because form B is not produced in the bulk, homogeneous and heterogeneous nucleation away from the centrioles is suppressed.
After nucleation, droplets grow and the cytosol is depleted of form A until a steady state is reached. In the simple case of fast diffusion and ignoring surface tension effects, the droplet volume V evolves as (kAB = 0, k = 0)
| [11] |
Here, N is the number of droplets growing simultaneously and defines the relaxation rate to steady state (Fig. 2A). Note that this growth curve is not sigmoidal and cannot account for the experimental results. In addition, diffusion-limited material insertion at the centrioles is a slow process, because building blocks A have to be transported to the small centrioles by diffusion. The resulting growth duration can be estimated as τD ∼ Vc/(4πaDA) ∼ 2,000 s (Appendix: Droplet Growth Kinetics), which is longer than the observed time of about 500 s (14). Here, we used a typical diffusion constant found for centrosome proteins (18) and a typical cell volume Vc = 104 μm3 (14). Consequently, enzymatic activity at the centrioles alone can account for neither the sigmoidal growth curve nor the observed rate of centrosome assembly. However, centriole activity can lead reliably to centrosome nucleation.
Fig. 2.
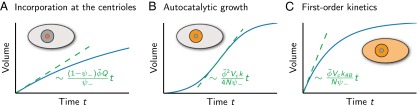
Droplet volume (blue solid lines) as a function of time for three scenarios of reaction-limited droplet growth. (A) Droplet growth by centriole activity. Droplet material is produced at the centrioles only (orange region). (B) Autocatalytic droplet growth. Droplet material is produced inside the droplet only. (C) Droplet growth by a first-order reaction A → B corresponding to droplet material production in the whole cell. The maximal volume growth rate for each case is indicated by dashed lines, and their corresponding time dependence is given (green).
Autocatalytic Assembly Leads to Sigmoidal Growth.
How can we account for the fast, sigmoidal growth of centrosomes? Sigmoidal growth is reminiscent of logistic growth processes observed in population dynamics or autocatalytic growth in general (19). We therefore consider the production of form B driven by autocatalytic assembly (k > 0, kAB = 0). In this case, form B would be generated by a second-order reaction A + B → 2B that depends on the concentration of already existing B. In the case of C. elegans centrosomes, such an autocatalytic reaction could be caused by a kinase that catalyzes the production of B and is localized within the centrosome. In the simple case of strong phase separation and vanishing surface tension, the droplet material of form B is then produced only inside the droplet itself. The resulting growth reads
| [12] |
where and t0 is a parameter setting the volume at t = 0. This growth exhibits a sigmoidal shape, because as the droplets grow larger they can recruit new material at a higher rate, until the material runs out (Fig. 2B and Appendix: Droplet Growth Kinetics).
We also considered whether a simple first-order reaction could account for sigmoidal centrosome growth. If droplet material is produced only via a first-order reaction (kAB > 0, k = 0, Q = 0), the droplet volume relaxes exponentially to a steady-state value and is not sigmoidal (Fig. 2C). In addition, because droplet material is in this case produced everywhere, unwanted heterogeneous and homogeneous nucleation in the cytosol is possible. Therefore, we propose that centrosome growth is driven by an autocatalytic reaction.
Centriole Activity Can Nucleate Autocatalytic Droplets.
Although the autocatalytic assembly can account for the sigmoidal growth, it cannot account for nucleation. This is because droplet formation requires the B form, which in the autocatalytic case can be produced only if existing B form is already present. Consequently, the autocatalytic process strongly suppresses droplet nucleation. Thus, we asked whether centriole-driven formation of form B is sufficient to nucleate autocatalytically growing centrosomes.
To address this question, we determined the steady states of a single, autocatalytic droplet (Fig. 3). In the case of passive centrioles and no surface tension (Q = 0, γ = 0), a steady state exists beyond a minimum fraction of PCM components (Fig. 3, solid green line) with a radius R that increases for larger . The effect of surface tension (Fig. 3, orange solid line) is the appearance of a second steady state with a smaller radius, which is unstable (Fig. 3, orange dotted line). The radius of the unstable steady state is called the critical radius. Droplets smaller than this radius disappear and only larger droplets grow autocatalytically until the stable steady state is reached. Because of the existence of a critical radius, homogeneous and heterogeneous nucleation is strongly suppressed. A sufficiently strong catalytic activity of the centrioles, Q > Qc, leads to the behavior described by the solid blue line in Fig. 3, where all steady states are stable. As a consequence, small droplets always grow and nucleation is reliably induced by the catalytic activity of the centrioles. The value of Qc is again given by Eq. 10 (Appendix: Droplet Growth Kinetics). Therefore, autocatalytic growth combined with a centriole activity leads to a situation where nucleation can be reliably controlled by centrioles and growth is sigmoidal, as observed in C. elegans embryos.
Fig. 3.

Radii of stationary, autocatalytic droplets as a function of the average volume fraction of PCM components for different values of surface tension γ and centriole activity Q. Solid lines indicate stable steady states, and dotted lines correspond to unstable states. Steady states were obtained by solving Eqs. 1–8 in a spherical geometry and the associated stability was obtained by linear stability analysis. The gray area marks the centrioles of radius a = 75 nm. Additional model parameter values are Vc = 104 μm3, ψ− = 0.1, ψ+ = 0, , kAB = 0, k = 100 s−1, kBA = 10−3 s−1, and .
Parameter Estimation for C. elegans Centrosomes.
We next wanted to see whether we could account for the quantitative shape of the growth curves measured in vivo by incorporating known parameters. This also allows us to estimate parameter values that are not yet known.
Some model parameters are known from experimental studies. Decker et al. (14) measured the volume Vc of cells in different early stages of development (Table 1). Diffusion constants for the centrosomal protein PLK-1 ranging from about 1 to were reported (18). These observations motivate our choice, . The rate constant of the reaction converting droplet material back to soluble building blocks, kBA ∼ 10−3 s−1, is estimated from the longest reported turnover time of centrosomal proteins (8). Not known are the other chemical reaction rate constants, the parameters associated with surface tension effects, the average fraction of PCM components in the system, and the volume fractions ψ− and ψ+ of the form B inside and outside the centrosome. We consider strong segregation of the B form, ψ+ = 0, but ψ− = 0.1, permitting other components to enter the centrosome phase.
Table 1.
Measured cell volumes Vc and final centrosome volumes V (mean ± standard deviation) of C. elegans embryos
| Cell | Stage | Vc | V(t = 150 s) | Vc/V |
| P0 | 1 cell | 22,000 μm3 | (11.5 ± 2.0) μm3 | 1,900 |
| AB | 2 cells | 12,700 μm3 | (7.6 ± 1.6) μm3 | 1,700 |
| P1 | 2 cells | 8,600 μm3 | (6.5 ± 1.0) μm3 | 1,300 |
| ABa | 4 cells | 6,200 μm3 | (4.2 ± 1.1) μm3 | 1,500 |
| ABp | 4 cells | 6,200 μm3 | (3.9 ± 1.1) μm3 | 1,600 |
| EMS | 4 cells | 4,400 μm3 | (3.5 ± 0.6) μm3 | 1,300 |
| P2 | 4 cells | 4,400 μm3 | (3.2 ± 1.0) μm3 | 1,400 |
| P3 | 8 cells | 2,200 μm3 | (2.4 ± 0.5) μm3 | 920 |
Several of the unknown parameters can be estimated by comparing the theory to the experimentally obtained growth curves. We used data obtained in the original experiments reported in ref. 14 and performed additional experiments of the same type to increase the sample size. A simultaneous fit of the numerical solutions to Eqs. 1–8 to experimental data of different cell stages is shown in Fig. 4A. Fit parameters were the autocatalytic reaction rate constant k, the average fraction of PCM components in the system, and the initial centrosome volumes (Materials and Methods). Using this fitting approach, we arrived at parameter estimates (Table 2), which account for the growth curves of C. elegans centrosomes quantitatively.
Fig. 4.
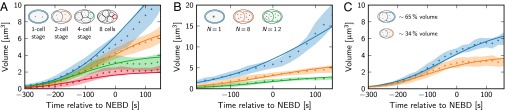
Comparison of the theory (lines) to experimental data (dots, mean; shaded area indicates standard deviation) of centrosome growth in C. elegans. The centrosome volume is shown as a function of time. Time t = 0 corresponds to nuclear envelop breakdown (NEBD). (A) Wild-type data for several cell sizes ranging from the one- to the eight-cell stage with cell volumes given in Table 1 (sample size n = 64, 54, 56, 51, from top to bottom). (B) Data from cells with an aberrant number N of centrosomes [N = 1, zyg-1(b1) embryos; N = 8, 12, zyg-1(it29) embryos; sample size n = 15, 16, 12, from top to bottom]. (C) Data from ani-2(RNAi) embryos with altered cell volumes (quantified fraction of wild-type volume is indicated; sample size n = 12, 18, from top to bottom). In A, the autocatalytic reaction rate constant k = 100 s−1, the average fraction of PCM components , and the initial centrosome volumes V0 are determined by a fit of theoretical curves to the data. k and are used in B and C, where the initial centrosome volumes are determined by a fit to the data. Vc is an additional fit parameter in C. All other model parameters have only a weak influence and are taken from Table 2.
Table 2.
Model parameters used to describe centrosome growth in C. elegans embryos
| Quantity | Symbol | Value | Comment |
| Centriole size, radius of sphere | a | 75 nm | Half the length of a single centriole (12) |
| Diffusion constants | DA, DB | Typical diffusion constant of centrosomal protein (18) | |
| Rate constant for reaction B → A | kBA | 10−3 s−1 | Estimated turnover rate of centrosome components (8) |
| Rate constant for reaction A → B | kAB | 0 s−1 | Neglected, because the reaction cannot explain growth dynamics |
| Autocatalytic reaction rate constant | k | 100 s−1 | Determined from fit to experimental data (Fig. 4) |
| Volume fraction of PCM in droplet | ψ− | 0.1 | Rough estimate for porous centrosome matrix (18) |
| Fraction of PCM in cytosol for γ = 0 | ψ+ | 0 | Strong segregation of the B form |
| Average fraction of PCM components | 2 × 10⁻⁴ | Determined from fit to experimental data (Fig. 4) | |
| Centriolar enzymatic activity | Q | Largest order of magnitude still showing sigmoidal growth | |
| Surface tension parameter in cytosol | 5 × 10⁻¹¹ m | Chosen such that Qc(γβ+) < Q | |
| Surface tension parameter in droplet | 0 | Negligible influence; assumed for simplicity |
The values of the centriole activity Q and the parameter γβ+ describing the effects of surface tension cannot be determined from this fit, because they do not influence the shape of the growth curve. As discussed above, these parameters play an important role for centrosome nucleation. From the experimental data we can determine upper bounds for Q and γβ+. In particular, a sigmoidal growth curve implies that autocatalytic assembly dominates over centriole activity, Q ≪ kVψ−. From the observation that centrosomes with volumes as small as V ∼ 0.3 μm3 show sigmoidal growth, we estimate . At the same time, Q must be larger than Qc given by Eq. 10 to ensure that droplets nucleate around centrioles. Because Qc depends on γβ+, this provides the additional upper bound . We chose parameters Q and γβ+ consistent with these requirements. The complete set of parameters is given in Table 2.
The values of these parameters can be changed in vivo by studying mutant conditions. We thus next test whether we can understand the centrosome growth in mutants by modifying relevant parameters in our model. Fig. 4B shows a fit of the model to data obtained from mutant cells with an aberrant number of centrosomes (14), using the parameter values of Table 2, the observed number N of centrosomes, and only the initial volumes as fit parameters. Furthermore, we compare the model to data from experiments where the cell volume has been changed (14). Using the initial centrosome volumes and the cell volume Vc as fit parameters shows that in these experiments the cell volume is indeed reduced (Fig. 4C). Fig. 4 thus shows that our model can quantitatively account for the observed growth curves in wild-type embryos and under conditions where we changed key parameters experimentally.
Suppression of Ostwald Ripening.
So far, we have explained the controlled nucleation of centrosomes and their sigmoidal growth, which are two key features of centrosome assembly in C. elegans. Additionally, Decker et al. have shown that centrosomes in the same cell have the same size (14). Considering centrosomes as liquid droplets then raises the question of how two centrosomes can be stable and have the same size. In passive systems, Ostwald ripening would make it difficult for droplets to coexist. This is because two equal-sized droplets are unstable and one grows at the expense of the other until a thermodynamic equilibrium is reached (20). However, we find that in our model Ostwald ripening can be suppressed, because of nonequilibrium conditions created by the chemical reactions (Fig. 5). Multiple droplets are stable if Q is larger than Qstab, which can be approximated as
| [13] |
(Fig. 5 and Appendix: Autocatalytic Growth of Multiple Droplets). The centrioles can therefore prevent Ostwald ripening. This effect can be understood qualitatively by considering two droplets of unequal size with identical centriole activities Q. The total volume of both droplets relaxes quickly to a steady-state value set by the available amount of droplet material but is essentially independent of Q. The material influx caused by centriole activity is more important for small droplets than for large ones and thus promotes the growth of small droplets. Thus, for sufficiently large Q, the small droplet can grow at the expense of the large droplet until both have the same stable size (Appendix: Autocatalytic Growth of Multiple Droplets).
Fig. 5.

Stability diagram of a pair of centrosomes as a function of the average fraction of PCM components and the centriole activity Q. Two centrosomes are stable and have the same volume in the green region. Conversely, one centrosome grows at the expense of the other in the blue region. The dashed line indicates the threshold Qstab given in Eq. 13 and parameter values are given in Table 2. Insets show schematics of the centrosome volumes as a function of time in the respective regions. These dynamics and the associated stability are obtained from a numerical analysis of a simplified model of centrosome growth (Appendix: Autocatalytic Growth of Multiple Droplets).
Because multiple droplets are stable and have the same size if their centriole activity Q is equal, Eq. 12 applies also for N > 1. This results in a steady-state volume V in the limit of large t,
| [14] |
Decker et al. have shown that the total volume of all centrosomes in a cell, NV, is proportional to the cell volume Vc (14). This observed scaling is captured by our model.
Multiple Centrosomes with Unequal Sizes.
We showed that two droplets tend to have equal size if the catalytic activity Q is equal in both droplets and larger than Qstab given by Eq. 13. Interestingly, it was shown experimentally by perturbing centrioles that centrosomes can have unequal sizes whereas their total volume is unchanged (14, 15). In these experiments, the larger centrosome contains a single, full-sized centriole, and the smaller centrosome contains a single, incomplete centriole (15). The fact that the second centriole is incomplete suggests that its enzymatic activity Q2 is smaller than that of the complete centriole, because it may not localize the same amount of catalyst at its surface. We thus next test whether different catalytic activities of the centrioles are sufficient to explain the observed differences in the growth dynamics of two centrosomes with structurally different centrioles. Neglecting surface tension effects and assuming fast diffusion for simplicity, we find that the ratio V1/V2 of centrosome volumes is given by the ratio Q1/Q2 of the centriole activities, whereas the total volume V1 + V2 depends only weakly on Q1 and Q2 (Appendix: Autocatalytic Growth of Multiple Droplets). Our theory explains the observed growth curves quantitatively, using the ratio Q1/Q2 as a fit parameter (Fig. 6). Our study thus suggests that compromising the centrioles in experiments changes their catalytic activity.
Fig. 6.

Radii of two centrosomes with unequal centrioles as a function of time. The solid lines show a fit of the theory to the experimental data (squares and circles) obtained in the two-cell stage (AB cell) of C. elegans where the protein SAS-4 has been partly depleted. Fit parameters are the catalytic activity Q2 of the centriole pair of the smaller centrosome, the average fraction of PCM components, and the time of growth initiation. The remaining parameters are taken from Table 2. The theoretical growth curve obtained with the same parameters in the symmetric case, , is also shown (gray).
Discussion
It is long been known that centrosomes have an amorphous structure formed by assembly and disassembly of PCM components. However, the principles governing centrosome dynamics and the mechanisms of centrosome assembly remain unclear. What type of material is the centrosome made of? How do the subunits from the cytosol become incorporated in the PCM? Here, we show that a model based on the idea of centrosomes forming around centrioles by autocatalytic growth of a PCM droplet phase in the cytosol can quantitatively account for key features of centrosome growth in C. elegans.
The model has three key ingredients: (i) The PCM components can exist either in a soluble or in an insoluble form; (ii) the interconversion between the two forms is driven by the catalytically active centrioles and by an autocatalytic chemical reaction; and (iii) the insoluble form tends to phase separate from the cytosol. This PCM phase corresponds to the droplet phase in the model. In C. elegans, the known components required for centrosome growth are the polo-like kinase PLK-1 (14) and the coiled-coil proteins SPD-5 and SPD-2 (21, 22). It seems likely that SPD-5 and SPD-2 are proteins that can phase separate from the cytosol to form the PCM matrix after a phosphorylation reaction and that the kinase PLK-1 mediates this conversion. More experiments are needed to assess the biochemical details and identify the nature of the autocatalytic mechanism. To test our model, it would also be interesting to measure material properties of the PCM, e.g., its viscosity and the surface tension of the interface with the cytosol. Note that the droplet description used here does not account for more structured protein assemblies, e.g., interphase centrosomes (23) or spindle pole bodies (24).
One of the issues arising when considering the centrosome as a droplet phase is the fact that PCM accumulates only at centrioles and accidental nucleation in the cytosol is absent. If centrosome formation were dependent only on homogeneous or heterogeneous nucleation and growth, spontaneous nucleation might occasionally occur in the cytosol. This spontaneous nucleation could be rare because surface tension suppresses the growth of small droplets. However, in our model nucleation is suppressed even more strongly because the autocatalytic growth does not allow the spontaneous production of centrosome material. Because of this suppression of nucleation in the cytosol, the centriole activity is required to initiate droplet growth. The combination of autocatalytic growth and catalytically active centrioles thus ensures controlled nucleation.
Another issue arising when considering the centrosome as a droplet phase is that two centrosomes do coexist. This is interesting because Ostwald ripening would lead in passive systems to the growth of a larger droplet at the expense of smaller droplets. Even if two droplets have the same size initially, this state would be unstable. Our model accounts for the absence of this instability in the case of centrosomes, because of the effect of centriole activity that suppresses Ostwald ripening. Importantly, this suppression also ensures that both centrosomes have a similar size even in the presence of large fluctuations during growth.
In our model, the centriole activity plays a double role: It reliably controls the droplet nucleation and it suppresses Ostwald ripening. Thereby, our model provides a robust mechanism by which centrioles control the location and timing of centrosome formation, whereas the centrosome size is determined by the limiting amount of PCM components in the cell and thus by the cell volume (3). It might be interesting to test these ideas in other organisms, too. For instance, centrosome growth is not sigmoidal in Drosophila, where centrioles control the rate of PCM accumulation (25, 26). In this case, a scenario relying only on catalytically active centrioles may provide a suitable description.
The centrosome joins a growing class of biological compartments that have liquid-like properties driven by the colloidal nature of biological macromolecules (4, 27, 28). The phase separation process that controls the formation of these compartments also leads to a clear interface between them and the surrounding cytosol. Such phase-separated compartments in the cytosol therefore provide specific chemical environments and permit the cell to separate different chemical reactions in space without using a membrane. These biological examples provide a paradigm for a class of nonequilibrium emulsions that couple phase separation with chemical reactions. There is a growing interest in physics and chemistry to study chemical reactions that couple to phase separation. Interesting phenomena including stable emulsions and pattern formation have been reported (29–31). The example from biology discussed here brings additional elements to such systems, namely the autocatalytic growth and chemically induced nucleation.
Materials and Methods
Experimental Data.
Centrosome sizes were measured in γ-tubulin::GFP cell lines, using live imaging as described earlier (14). The acquired image stacks were analyzed by a custom-made algorithm (32). Some of the data that we analyze have already been published in ref. 14. The data shown in Fig. 4B were obtained from zyg-1 mutants and have already been shown in figure 3A and 3B of ref. 14. For the data shown in Fig. 4 A and C we used experimental data already presented in figure 1C and 1D of ref. 14, supplemented by data from additional experiments of the same type to improve statistics. The data shown in Fig. 6 result from an experiment reported in ref. 14. The full time course of the two unequal centrosome radii shown as a function of time is presented here, to our knowledge, for the first time. The experimental methods and the methods to determine centrosome volume have been described previously in ref. 14. Cell volumes shown in Table 1 were taken from ref. 14.
Numerical Solution of the Theoretical Model and Fitting.
Fitting was used to compare the theoretical model to the experimental data as described in the main text. The theoretical model given by Eqs. 1–8 was solved numerically in a spherical geometry with radial symmetric volume fractions. The moving boundary conditions at the droplet surface were implemented using an adaptive discretization scheme (33). In the case of N droplets, we approximated the solution for the individual droplets by simulating a single droplet with a reduced system volume of Vc/N, where Vc is the cell volume. The fitting was done by adjusting parameters until the sum of squared differences between the numerical solution and measured data was minimized.
Appendix: Phase Separation in a Ternary Fluid
Flory–Huggins Free Energy.
We discuss the centrosome using a ternary fluid description involving soluble PCM building blocks A, PCM droplet material B, and all other components described together as cytosol C. We introduce two volume fractions ϕA and ϕB, such that ϕC = 1 − ϕA − ϕB, and consider a simplified Flory–Huggins free energy density (34, 35),
| [15] |
where ν is a molecular volume. Here, the interaction characterized by the coefficient χ > 0 can induce phase separation of droplet material B from the building blocks A and the cytosol C.
Thermodynamics of Two-Phase Coexistence.
The conditions for equilibrium at the interface between two coexisting phases read
| [16a] |
| [16b] |
| [16c] |
where ϕ− and ϕ+ denote the volume fractions at the interface inside and outside the droplet, respectively. Here, μi(ϕA, ϕB) = ∂f(ϕA, ϕB)/∂ϕi for i = A, B, γ denotes the surface tension, and H is the mean curvature of the interface. For the free energy density in Eq. 15, condition Eq. 16a reads
| [17] |
This is equivalent to , corresponding to Eq. 7. In the case ϕA ≪ ϕC, the volume fractions that result from Eqs. 16b and 16c can be expanded to first order in H,
| [18] |
where ψ− and ψ+ are the equilibrium volume fractions at a flat interface and we defined with .
Appendix: Droplet Growth Kinetics
Droplet Growth Rate.
The volume growth rate dV/dt can be obtained in a spherical geometry by considering a small shell of thickness 2ε in the range R − ε < r < R + ε around the droplet interface. The volume occupied by form B in this shell is . Fluxes of form B across the shell boundaries change with a rate , where JB is given in Eq. 3. If the interface moves with a speed with respect to the fixed shell, the rate of change of the volume of form B in the shell is . Equating both expressions of leads in the limit of small ε to Eq. 8 for the droplet growth rate , where and . A similar argument for the building blocks of form A leads to
| [19] |
where , , , and are defined correspondingly.
Surface Fluxes of Droplet Material.
The fluxes and at the droplet surface set the droplet growth rate (Eq. 8). We can obtain a simplified expression for the flux for steady states of the concentration field in a spherical geometry. At the droplet interface at r = R, we have . For large r ≫ R, ϕB(r) approaches the bulk volume fraction . Using Eq. 1b, considering kAB = 0, and neglecting the autocatalytic reaction outside the droplet where ϕB is small, we have
| [20] |
where α = (DB/kBA)1/2 is a characteristic length. The flux at the droplet surface becomes
| [21] |
For the parameters given in Table 2, α ∼ 70 μm, which is larger than centrosomes. For such small droplets (R ≪ α), we obtain Eq. 9. The flux inside at the droplet interface can be estimated for small droplets with constant volume fraction ϕB(r) ∼ ψ− for r < R as
| [22] |
Here, is an approximation for the volume fraction of form A inside the droplet (Eq. 7), and is the bulk volume fraction of form A outside the droplet.
Droplet Nucleation.
We investigate nucleation by discussing the growth dynamics of small droplets and the size of critical droplets. Critical droplets are small droplets in a steady state that is unstable. We can discuss steady-state droplets using the balance of material fluxes at the interface of the droplet, which obey (Eq. 8). Using Eqs. 21 and 22, we can estimate the steady-state droplet radius for the case where no chemical reactions occur (Q = 0, k = 0, kAB = 0, kBA = 0). Linear stability analysis reveals that this steady state is unstable. Rcrit is thus a critical radius such that droplets with R < Rcrit shrink and disappear. This case without chemical reactions corresponds to classical nucleation theory, where nucleation is suppressed by surface tension γ.
Droplets can be nucleated in a controlled manner by catalytically active centrioles (Q > 0, k = 0, kAB = 0, kBA > 0). This can be shown most easily in the limit of strong phase separation (ψ+ = 0) and for large cells, , such that most droplet components are in their soluble form A (, ). The steady-state droplet volume then reads
| [23] |
for Q > Qc with denoting the nucleation threshold. The corresponding steady states are stable droplets nucleated reliably by the centriole activity. For Q ≤ Qc, V vanishes and droplets shrink and disappear. No critical droplet size exists in this case.
The same arguments can also be used to discuss the case where centrosomes are nucleated by centriole activity and grow autocatalytically (Q > 0, k > 0, kAB = 0, kBA > 0). For Q > Qc the system reaches a stable steady-state droplet volume, which is independent of Q and given in Eq. 14 of the main text. No critical droplet size exists and nucleation by centriole activity is reliable. For Q < Qc, the steady-state volume of small droplets is
| [24] |
For these droplets are unstable and thus correspond to the critical radius Rcrit = (3Vcrit/4π)1/3. Nucleation by the centriole activity is thus not successful for Q < Qc. Note that for small k Eq. 24 approaches the situation described by Eq. 23 discussed above, which also leads to reliable nucleation only for Q > Qc.
Shape of Volume Growth Curves.
We can obtain simplified expressions for the droplet volume as a function of time if the droplet growth rate is limited by chemical reactions. In this case, for large diffusion coefficient DB, the flux becomes independent of DB. This expression follows from the material balance for fast diffusion in a steady state with . The droplet growth rate dV/dt, given by Eq. 8 together with Eq. 22, for the simple case of strong segregation (ψ+ = 0) with γ = 0 obeys
| [25] |
where , , and we used for simplicity the limit of large cells Vc ≫ NVψ−.
We can distinguish three different scenarios:
-
i)Growth driven by centriole activity (Q > 0, k = 0, kAB = 0): In this case, with a growth rate , which leads to
where V(0) is the volume at t = 0.[26]
-
ii)Autocatalytic growth (Q = 0, k > 0, kAB = 0): In this case, dV/dt ≈ 2λBV − ζV2, where and ζ = [(1 − ψ−)ψ−Nk]/Vc. For λB > 0, the droplet volume increases as
where t0 is an integration constant setting the initial volume V(0).[27]
-
iii)Growth by chemical reactions with first-order kinetics (Q = 0, k = 0, kAB > 0): In this case, we have , which is solved by
with λC = kAB + kBA.[28]
We also discuss the case where droplet growth is limited by diffusion of form A to the centrioles with large catalytic activity Q (k = 0, kAB = 0, kBA = 0). For simplicity, we consider a spherical geometry, γ = 0, and ψ+ = 0. In this case, ϕA(a, t) = 0 at the centrioles. The time-dependent solutions to Eq. 1a are
| [29] |
where αk are positive real solutions to with Rc = (3Vc/4π)1/3. The coefficients bk follow from the initial condition . The droplet volume is V = VB/ψ− with
| [30] |
The slowest mode has a relaxation rate , with
| [31] |
for a ≪ Rc. This is slower than the diffusion rate across the cell, , because the material not only has to traverse the cell volume but also has to reach the small target region of size a.
Appendix: Autocatalytic Growth of Multiple Droplets
We investigate multiple droplets that are nucleated by centriole activity and grow autocatalytically (Q > 0, k > 0, kAB = 0, kBA > 0). The growth rate dVi/dt of the ith droplet is given by Eq. 8 together with Eqs. 21 and 22. In the simple case of strong phase separation (ψ+ = 0), taking into account finite surface tension γ, we obtain
| [32] |
where .
Suppression of Ostwald Ripening by Centriole Activity.
We investigate the late stage of droplet growth, where the total droplet volume and thus also the fractions and have reached their steady-state values after a time . A linear stability analysis of Eq. 32 around the symmetric steady state Vi = V with small perturbations of amplitude εi, Vi = V + εieλt, leads to the perturbation growth rate
| [33] |
To investigate stability, we need to determine the steady-state volume fractions and . For fast diffusion . follows from Eq. 32 in steady state, . Finally, for equal centriole activities Qi = Q, we obtain
| [34] |
If λ is positive, equal-sized droplets are unstable and Ostwald ripening occurs. This is the case for large surface tension γ. However, for large enough kBA and finite Q, λ can become negative. In this case equal droplets are stable and Ostwald ripening is suppressed. Note that this simplified argument applies if λB > |λ|, which is the case for the parameter values given in Table 2.
Growth of Centrosomes with Different Centriole Activities.
We consider droplet growth described by Eq. 32 in the case of different centriole activities Qi. For simplicity we neglect surface tension effects (γ = 0), consider strong segregation (ψ+ = 0), and approximate the volume fractions of the A form as , where is the total droplet volume. The total droplet volume in steady state to linear order in reads
| [35] |
where . For autocatalytic growth k ≫ Qtot/(ηVc) and the dependence of Vtot on the centriole activity Qtot can thus be neglected. However, differences in centriole activities have a strong influence on the volume differences of droplets. For two droplets, Eq. 32 implies
| [36] |
Thus, V1/V2 is time independent if V1/V2 = Q1/Q2. If droplet growth is initiated by activating centrioles at time t = 0, corresponding to the initial condition Vi(t = 0) = 0, we obtain unequal volume growth of both droplets, Vi(t) = Vtot(t)⋅Qi/Qtot.
Supplementary Material
Acknowledgments
We thank Chiu Fan Lee, Clifford P. Brangwynne, Oliver Wüseke, Michael Kuhn, and Jeff Woodruff for helpful discussions and Simone Reber, Justin Bois, Chiu Fan Lee, and Nathan W. Goehring for a critical reading of the manuscript. This work was supported by the Max Planck Society, MitoSys, and the Alexander-von-Humboldt Foundation under Max Planck Research Award 018878.
Footnotes
The authors declare no conflict of interest.
This article is a PNAS Direct Submission.
References
- 1.Travis J. Mysteries of the cell. How does the cell position its proteins? Science. 2011;334(6059):1048–1049. doi: 10.1126/science.334.6059.1048. [DOI] [PubMed] [Google Scholar]
- 2.Chan YH, Marshall WF. Scaling properties of cell and organelle size. Organogenesis. 2010;6(2):88–96. doi: 10.4161/org.6.2.11464. [DOI] [PMC free article] [PubMed] [Google Scholar]
- 3.Goehring NW, Hyman AA. Organelle growth control through limiting pools of cytoplasmic components. Curr Biol. 2012;22(9):R330–R339. doi: 10.1016/j.cub.2012.03.046. [DOI] [PubMed] [Google Scholar]
- 4.Brangwynne C. Soft active aggregates: Mechanics, dynamics and self-assembly of liquid-like intracellular protein bodies. Soft Matter. 2011;7:3052–3059. [Google Scholar]
- 5.Hyman AA, Brangwynne CP. Beyond Stereospecificity: Liquids and Mesoscale Organization of Cytoplasm. Dev Cell. 2011;21(1):14–16. doi: 10.1016/j.devcel.2011.06.013. [DOI] [PubMed] [Google Scholar]
- 6.Brangwynne CP, et al. Germline P granules are liquid droplets that localize by controlled dissolution/condensation. Science. 2009;324(5935):1729–1732. doi: 10.1126/science.1172046. [DOI] [PubMed] [Google Scholar]
- 7.Reber SB, et al. XMAP215 activity sets spindle length by controlling the total mass of spindle microtubules. Nat Cell Biol. 2013;15(9):1116–1122. doi: 10.1038/ncb2834. [DOI] [PubMed] [Google Scholar]
- 8.Mahen R, Venkitaraman AR. Pattern formation in centrosome assembly. Curr Opin Cell Biol. 2012;24(1):14–23. doi: 10.1016/j.ceb.2011.12.012. [DOI] [PubMed] [Google Scholar]
- 9.Bornens M. The centrosome in cells and organisms. Science. 2012;335(6067):422–426. doi: 10.1126/science.1209037. [DOI] [PubMed] [Google Scholar]
- 10.Greenan G, et al. Centrosome size sets mitotic spindle length in Caenorhabditis elegans embryos. Curr Biol. 2010;20(4):353–358. doi: 10.1016/j.cub.2009.12.050. [DOI] [PubMed] [Google Scholar]
- 11.Gönczy P. Towards a molecular architecture of centriole assembly. Nat Rev Mol Cell Biol. 2012;13(7):425–435. doi: 10.1038/nrm3373. [DOI] [PubMed] [Google Scholar]
- 12.Pelletier L, O’Toole E, Schwager A, Hyman AA, Müller-Reichert T. Centriole assembly in Caenorhabditis elegans. Nature. 2006;444(7119):619–623. doi: 10.1038/nature05318. [DOI] [PubMed] [Google Scholar]
- 13.Boxem M, et al. A protein domain-based interactome network for C. elegans early embryogenesis. Cell. 2008;134(3):534–545. doi: 10.1016/j.cell.2008.07.009. [DOI] [PMC free article] [PubMed] [Google Scholar]
- 14.Decker M, et al. Limiting amounts of centrosome material set centrosome size in C. elegans embryos. Curr Biol. 2011;21(15):1259–1267. doi: 10.1016/j.cub.2011.06.002. [DOI] [PubMed] [Google Scholar]
- 15.Kirkham M, Müller-Reichert T, Oegema K, Grill S, Hyman AA. SAS-4 is a C. elegans centriolar protein that controls centrosome size. Cell. 2003;112(4):575–587. doi: 10.1016/s0092-8674(03)00117-x. [DOI] [PubMed] [Google Scholar]
- 16.Dammermann A, Maddox PS, Desai A, Oegema K. SAS-4 is recruited to a dynamic structure in newly forming centrioles that is stabilized by the gamma-tubulin-mediated addition of centriolar microtubules. J Cell Biol. 2008;180(4):771–785. doi: 10.1083/jcb.200709102. [DOI] [PMC free article] [PubMed] [Google Scholar]
- 17.Schierenberg E. 2006. Embryological variation during nematode development. WormBook, 10.1895/wormbook.1.55.1. Available at www.wormbook.org.
- 18.Mahen R, Jeyasekharan AD, Barry NP, Venkitaraman AR. Continuous polo-like kinase 1 activity regulates diffusion to maintain centrosome self-organization during mitosis. Proc Natl Acad Sci USA. 2011;108(22):9310–9315. doi: 10.1073/pnas.1101112108. [DOI] [PMC free article] [PubMed] [Google Scholar]
- 19.Tsoularis A, Wallace J. Analysis of logistic growth models. Math Biosci. 2002;179(1):21–55. doi: 10.1016/s0025-5564(02)00096-2. [DOI] [PubMed] [Google Scholar]
- 20.Voorhees P. Ostwald ripening of two-phase mixtures. Annu Rev Mater Sci. 1992;22:197–215. [Google Scholar]
- 21.Pelletier L, et al. The Caenorhabditis elegans centrosomal protein SPD-2 is required for both pericentriolar material recruitment and centriole duplication. Curr Biol. 2004;14(10):863–873. doi: 10.1016/j.cub.2004.04.012. [DOI] [PubMed] [Google Scholar]
- 22.Hamill DR, Severson AF, Carter JC, Bowerman B. Centrosome maturation and mitotic spindle assembly in C. elegans require SPD-5, a protein with multiple coiled-coil domains. Dev Cell. 2002;3(5):673–684. doi: 10.1016/s1534-5807(02)00327-1. [DOI] [PubMed] [Google Scholar]
- 23.Lüders J. The amorphous pericentriolar cloud takes shape. Nat Cell Biol. 2012;14(11):1126–1128. doi: 10.1038/ncb2617. [DOI] [PubMed] [Google Scholar]
- 24.Jaspersen SL, Winey M. The budding yeast spindle pole body: Structure, duplication, and function. Annu Rev Cell Dev Biol. 2004;20:1–28. doi: 10.1146/annurev.cellbio.20.022003.114106. [DOI] [PubMed] [Google Scholar]
- 25.Conduit PT, et al. Centrioles regulate centrosome size by controlling the rate of Cnn incorporation into the PCM. Curr Biol. 2010;20(24):2178–2186. doi: 10.1016/j.cub.2010.11.011. [DOI] [PubMed] [Google Scholar]
- 26.Conduit PT, et al. The centrosome-specific phosphorylation of Cnn by Polo/Plk1 drives Cnn scaffold assembly and centrosome maturation. Dev Cell. 2014;28(6):659–669. doi: 10.1016/j.devcel.2014.02.013. [DOI] [PMC free article] [PubMed] [Google Scholar]
- 27.Brangwynne CP, Mitchison TJ, Hyman AA. Active liquid-like behavior of nucleoli determines their size and shape in Xenopus laevis oocytes. Proc Natl Acad Sci USA. 2011;108(11):4334–4339. doi: 10.1073/pnas.1017150108. [DOI] [PMC free article] [PubMed] [Google Scholar]
- 28.Li P, et al. Phase transitions in the assembly of multivalent signalling proteins. Nature. 2012;483(7389):336–340. doi: 10.1038/nature10879. [DOI] [PMC free article] [PubMed] [Google Scholar]
- 29.Carati D, Lefever R. Chemical freezing of phase separation in immiscible binary mixtures. Phys Rev E Stat Phys Plasmas Fluids Relat Interdiscip Topics. 1997;56:3127–3136. [Google Scholar]
- 30.Tran-Cong Q, Harada A. Reaction-induced ordering phenomena in binary polymer mixtures. Phys Rev Lett. 1996;76(7):1162–1165. doi: 10.1103/PhysRevLett.76.1162. [DOI] [PubMed] [Google Scholar]
- 31.Mikhailov AS, Ertl G. Nonequilibrium microstructures in reactive monolayers as soft matter systems. ChemPhysChem. 2009;10(1):86–100. doi: 10.1002/cphc.200800277. [DOI] [PubMed] [Google Scholar]
- 32.Jaensch S, Decker M, Hyman AA, Myers EW. Automated tracking and analysis of centrosomes in early Caenorhabditis elegans embryos. Bioinformatics. 2010;26(12):i13–i20. doi: 10.1093/bioinformatics/btq190. [DOI] [PMC free article] [PubMed] [Google Scholar]
- 33.Crank J. Free and Moving Boundary Problems. Oxford: Clarendon Press; 1987. [Google Scholar]
- 34.Flory P. Thermodynamics of high polymer solutions. J Chem Phys. 1942;10(1):51–61. [Google Scholar]
- 35.Huggins M. Solutions of long chain compounds. J Chem Phys. 1941;9(5):440. [Google Scholar]