

Significance
Northern forests have sequestered a substantial amount of carbon dioxide from the atmosphere during the past several decades. This large carbon (C) sink usually is considered to be driven by tree regrowth after stand-replacing disturbance and growth enhancement due to environmental changes, but the relative contribution between these two processes remains unclear. In this study, we evaluate the contribution of growth enhancement induced by environmental changes to biomass C sink in Japan’s forests and demonstrate that this growth enhancement accounts for 8.4–21.6% of biomass C sink in four major plantations from 1980 to 2005. This finding highlights that global environmental changes can stimulate tree growth and thus enhance forest C sequestration over a broad geographical scale.
Keywords: biomass carbon sink, forest age, forest inventory
Abstract
Forests in the middle and high latitudes of the northern hemisphere function as a significant sink for atmospheric carbon dioxide (CO2). This carbon (C) sink has been attributed to two processes: age-related growth after land use change and growth enhancement due to environmental changes, such as elevated CO2, nitrogen deposition, and climate change. However, attribution between these two processes is largely controversial. Here, using a unique time series of an age-class dataset from six national forest inventories in Japan and a new approach developed in this study (i.e., examining changes in biomass density at each age class over the inventory periods), we quantify the growth enhancement due to environmental changes and its contribution to biomass C sink in Japan’s forests. We show that the growth enhancement for four major plantations was 4.0∼7.7 Mg C⋅ha−1 from 1980 to 2005, being 8.4–21.6% of biomass C sequestration per hectare and 4.1–35.5% of the country's total net biomass increase of each forest type. The growth enhancement differs among forest types, age classes, and regions. Our results provide, to our knowledge, the first ground-based evidence that global environmental changes can increase C sequestration in forests on a broad geographic scale and imply that both the traits and age of trees regulate the responses of forest growth to environmental changes. These findings should be incorporated into the prediction of forest C cycling under a changing climate.
Recent studies indicate that forests in the middle and high latitudes of the northern hemisphere have functioned as a significant sink for atmospheric carbon dioxide (CO2) over the past decades (1–4). This carbon (C) sink results from two major processes: age-related growth (regrowth) after land use change and growth enhancement due to environmental changes (simply called “growth enhancement” hereafter), such as elevated CO2, nitrogen (N) deposition, and climate change (5–13). These two processes have contrasting implications for predicting the magnitude of future C sequestration in forest ecosystems. Forest C storage may be expected to saturate during the late stage of stand development if forests simply are regrowing after stand-replacing disturbance (14). In contrast, the future C storage potential of forests will be highly uncertain if tree growth has been altered by environmental changes (13, 15–17). Individual-level observation reveals that tree growth rate increases continuously with tree age or size for most tropical and temperate tree species (18), but environmental change, such as climate warming without an increase in precipitation, might reduce the growth rates of trees (19). Thus, knowledge of the relative contribution of tree regrowth and growth enhancement to C accumulation in forest ecosystems across a broad geographical scale is critical for predicting future C sequestration in land ecosystems and planning strategies to mitigate the increase of atmospheric CO2 concentration (5, 11, 13, 20).
During the past decade, the relative contribution of these two mechanisms to C accumulation in forest ecosystems has received considerable attention (5, 6, 11, 12), but attribution between these two is largely controversial (7–9, 13, 15, 16) because of a lack of available data and appropriate methodology (11, 21). For example, simulation results from land surface models revealed that growth enhancement might account for 25–75% of terrestrial C sink in the United States (6, 21), but ground-based studies demonstrated that only about 2.0% of the aboveground biomass increase was the result of environmentally enhanced growth in five states of the eastern United States (5). The conflicting results highlight that more observations are required to distinguish the relative contribution of tree regrowth and growth enhancement to C sequestration in forest ecosystems (11, 12).
Forest inventories, widely collected and designed to be statistically valid by many countries, are recognized as the best ground-based observations for quantifying the size, spatial patterns, and changes of forest C stock at regional, national, and global scales (22–24). Although the inventory data in most countries of the world cannot be used to evaluate the relative contribution of age-related tree regrowth and environmentally enhanced growth to forest C sink because of a lack of data on stand age, fortunately, those in Japan contain detailed information on stand age for major forest types for each region since the 1980s (for details, see Materials and Methods), and thus offer a unique opportunity to evaluate growth enhancement due to environmental change and its contribution to forest C accumulation at a large scale. Here, using a systematic, fine time series of age-class data obtained from six forest inventories (1980, 1985, 1990, 1995, 2000, and 2005) (25, 26) and forest type-specific biomass expansion factor (BEF) (Table S1 and Materials and Methods), we distinguish the relative contribution and its regional variation of tree regrowth and growth enhancement to biomass C accumulation for major planted forest types in Japan from 1980 to 2005.
The reasoning is that forest types of the same age class and with similar management regimes across different inventory periods should have a similar biomass density (biomass per area) under equilibrium environmental conditions (i.e., atmospheric CO2 concentration, N deposition, and climate). Thus, if the biomass density of forests of the same age class varies through time (or across different inventory periods), then the variation, either increasing or decreasing biomass density, should be induced by environmental changes (Fig. 1). We can assess the impact of environmental changes on forest growth by examining differences in forest biomass density for the same age class but over different inventory periods.
Fig. 1.
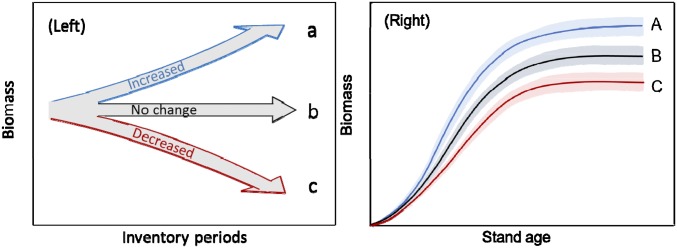
A conceptual diagram showing changes in biomass density induced by environmental change. (Left) Conceptually, environmental change may lead to (a) an increase, (b) no change, or (c) a decrease in biomass density of a forest stand at a given age class over different inventory periods. The assumption in the approach is that at a similar management regime over time, forest stands of similar age will have the same standing biomass, and any differences from the standing biomass at the initial period for a given age are the result of environmental changes. The arrows simply imply the direction of the changes and do not necessarily show a monotonic increase or decrease in biomass density; it might increase for a time then decrease, or it might vary back and forth. (Right) Corresponding with Left, environmental change may lead to (A) an increase, (B) no change, or (C) a decrease in biomass density of a forest type across all age classes in a certain inventory period. The shaded bands represent the fluctuations in growth in different age classes.
Considering that natural forests have multiple dominant tree species of different ages, here we focused on four major plantations in the country: Japanese cedar (Cryptomeria japonica), Japanese cypress (Chamaecyparis obtusa), Japanese red pine (Pinus densiflora), and Japanese larch (Larix leptolepis) plantations. To address regional differences in the response of forest growth to environmental change, following the forest inventory (25), we divided the country into eight regions: Hokkaido, Tohoku, Kanto, Chubu, Kinki, Chugoku, Shikoku, and Kyushu-Okinawa (Materials and Methods).
Results
Biomass C Accumulation.
Biomass density in all four planted forest types had significantly increased from 1980 to 2005 (Table 1; for more details, see Tables S2–S5). This growth was partitioned between two processes: age-related tree growth and environmentally induced enhancement. Japanese cedar plantation increased from 42.0 to 89.5 Mg C⋅ha−1 (1 Mg = 106 g), Japanese cypress from 40.1 to 77.2 Mg C⋅ha−1, Japanese red pine from 29.2 to 58.3 Mg C⋅ha−1, and Japanese larch from 34.2 to 69.9 Mg C⋅ha−1, with a net increase of 47.5, 37.1, 38.3, and 35.7 Mg C⋅ha−1, respectively. As a result, total biomass C stock showed a large net gain of 212.4, 112.1, 23.9, and 32.9 Tg C (1 Tg = 1012 g) for cedar, cypress, red pine, and larch forests, respectively.
Table 1.
Forest area, total biomass stock, and biomass density in different periods for four major planted forest types in Japan
| Year | Change over 1980–2005 | |||||||
| Forest type | Item | 1980 | 1985 | 1990 | 1995 | 2000 | 2005 | |
| C. japonica | Area, 106 ha | 4.27 | 4.44 | 4.51 | 4.49 | 4.43 | 4.37 | 0.1 |
| Total biomass, Tg C | 179.1 | 228.3 | 265.7 | 300.5 | 355.5 | 391.5 | 212.4 | |
| Biomass density, Mg C⋅ha−1 | 42 | 51.4 | 59 | 67 | 80.3 | 89.5 | 47.5 | |
| C. obtusa | Area, 106 ha | 2.04 | 2.29 | 2.42 | 2.49 | 2.51 | 2.51 | 0.47 |
| Total biomass, Tg C | 81.7 | 106.1 | 125.9 | 147.1 | 174.3 | 193.8 | 112.1 | |
| Biomass density, Mg C⋅ha−1 | 40.1 | 46.4 | 52 | 59 | 69.5 | 77.2 | 37.1 | |
| P. densiflora | Area, 106 ha | 1.18 | 1.08 | 1.02 | 0.97 | 0.89 | 0.86 | −0.08 |
| Total biomass, Tg C | 34.4 | 40 | 44.8 | 48.9 | 55.1 | 58.3 | 23.9 | |
| Biomass density, Mg C⋅ha−1 | 29.2 | 37.2 | 44 | 50.4 | 62 | 67.6 | 38.3 | |
| L. leptolepis | Area, 106 ha | 1.1 | 1.09 | 1.08 | 1.07 | 1.04 | 1.01 | −0.09 |
| Total biomass, Tg C | 37.7 | 47.7 | 54 | 60.2 | 67.5 | 70.6 | 32.9 | |
| Biomass density, Mg C⋅ha−1 | 34.2 | 43.9 | 50 | 56.4 | 64.9 | 69.9 | 35.7 | |
Environmentally Enhanced Growth and Its Contribution to Forest C Accumulation.
The changes in biomass density of a forest type at a given age class, except young forests, exhibited substantial increases over the inventory periods from 1980 to 2005 (Fig. 2), suggesting that tree growth in Japan has been enhanced by environmental changes for most stands of the plantations. This enhanced growth was largely age dependent within a certain forest type, although the ages most sensitive to enhanced growth varied among forest types. For Japanese cedar forests (Fig. 2A), there was no environmentally enhanced growth before the eighth age class (or 40 y old); that is, annual mean growth enhancement per area for an age class (GEPAi; for the details, see Materials and Methods) was about zero, then increased rapidly and remained at a value of 0.3∼0.5 Mg C⋅ha−1⋅y−1. For Japanese cypress forests (Fig. 2B), the annual mean GEPAi was small, about 0.3 Mg C⋅ha−1⋅y−1 after the fifth age class (25 y old). For red pine forests (Fig. 2C), the annual mean GEPAi did not change significantly at ages <20 y (the fourth age class), reached a maximum (0.63 Mg C⋅ha−1⋅y−1) at the 10th age class (50 y old), and then declined. For larch forests (Fig. 2D), the annual mean GEPAi increased rapidly after the third age class and peaked (0.84 Mg C⋅ha−1⋅y−1) at the 13th age class (65 y old), but had small values (0.08∼0.12 Mg C⋅ha−1⋅y−1) between the ninth and 11th age classes.
Fig. 2.

Environmentally induced annual changes in biomass density (biomass per area) with various age classes for four major plantations in Japan during the period 1980–2005. The numbers are obtained from annual mean GEPAi for each age class (Eq. 6 in Materials and Methods). Each age class represents 5 y. Minus or plus value shows negative or positive effects of environmental changes on forest growth. (A) Japanese cedar, (B) Japanese cypress, (C) Japanese red pine, and (D) Japanese larch plantations.
The growth enhancement varied widely among forest types. The highest rate of growth enhancement was observed in larch forests, with an average growth enhancement per area (GEPA) of 7.7 Mg C⋅ha−1 across all age classes over the period 1980–2005; that in other forest types showed a small range of 4.0–4.8 Mg C⋅ha−1 (Table 2 and Table S6). The relative contribution of the growth enhancement to the total increase in biomass density (Rgepa) showed the same order: the largest in larch forests (21.6%) and the smallest in cedar plantation (8.4%), suggesting a large difference in the contribution of environmental enhancement to forest growth among various forest types (for details on GEPA and Rgepa, see Materials and Methods).
Table 2.
Country total contribution of environmentally enhanced growth to biomass carbon accumulation for four major plantations in Japan during 1980–2005
| Forest type | NBIPA, Mg C⋅ha−1 | GEPA, Mg C⋅ha−1 | Rgepa, % | NBI, Tg C | TGE, Tg C | Rge, % |
| C. japonica | 47.5 | 4.0 | 8.4 | 212.3 | 8.7 | 4.1 |
| C. obtusa | 37.1 | 4.1 | 11.0 | 112.0 | 11.6 | 10.4 |
| P. densiflora | 38.3 | 4.8 | 12.6 | 23.9 | 8.5 | 35.5 |
| L. leptolepis | 35.7 | 7.7 | 21.6 | 32.9 | 11.4 | 34.7 |
Using these rates and the total area of each forest type, we estimated total growth enhancement (TGE) and its contribution to total forest C accumulation across the country. The cypress and larch forests presented a similar, large TGE value (11.6 and 11.4 Tg C, respectively), and the other two forest types (cedar and red pine forests) showed a similar, small TGE (8.7 and 8.5 Tg C) (Table 2). Overall, the relative contribution (Rge) of TGE to total biomass C accumulation [net biomass increase (NBI)] was largest in red pine forests (35.5%), with a similar value in larch forest (34.7%), and smallest in cedar forest (only 4.1%) (for details on TGE and Rge, see Materials and Methods).
Regional Patterns of Growth Enhancement.
Although environmental changes have stimulated tree growth at the national scale, there were large regional differences in this enhancement (Fig. 3 and Table S6). For example, environmental changes stimulated the growth of red pine forest in northern regions (i.e., Tohoku, Kanto, Chubu, and Kinki) but inhibited its growth in southern areas (i.e., Shikoku, Chugoku, and Kyushu-Okinawa) (Fig. 3C), probably as the result of increased damage by disease and insect outbreaks under warmer and more humid environments in southern regions (25). Similarly, the contribution of growth enhancement to biomass C accumulation in larch forest tended to decrease from north to south, with more than 50% of Rgepa in Hokkaido and about 10% in Chubu (Fig. 3D). Regional distribution of the effects of environmental changes on total tree growth (Rge) showed patterns similar to those of Rgepa (Fig. S1), although there were greater variations in the former because of differences in forest area in different regions.
Fig. 3.

Regional differences in environmentally induced growth for four major plantations in Japan, described as the contribution of growth enhancement per hectare to the total increase in biomass density (Rgepa). (A) Japanese cedar, (B) Japanese cypress, (C) Japanese red pine, (D) Japanese larch plantations, and (E) map of Japan showing the regional divisions used in this study. Following Japanese inventories, the country was divided into eight regions: Hokkaido (HKD), Tohoku (THK), Kanto (KTO), Chubu (CHB), Kinki (KNK), Chugoku (CGK), Shikoku (SHK), and Kyushu-Okinawa (KYS-OKA).
Discussion
This analysis is, to our knowledge, the first to distinguish the relative contribution of age-related tree regrowth and environmentally enhanced growth to biomass C accumulation at a large scale. Our results demonstrate that age-related tree regrowth was the principle mechanism responsible for biomass C uptake in Japan’s major plantations but that environmentally induced growth enhancement also made a substantial contribution to C sequestration. As indicated in Table 2, the four plantations sequestrated environmentally enhanced C of 4.0∼7.7 Mg⋅ha−1 over 25 y (1980–2005). If we assume the estimates are average enhancement rates for the northern forests in the middle and high latitudes and simply translate these rates into the northern forests (a total area of 1,780 × 106 ha; see ref 27), then these forests sequestrated a total of 7.1∼13.7 Pg C over the period 1980–2005, or 0.28∼0.55 Pg C per year (1 Pg = 1015 g). This is a substantial amount relative to a total C sink of 1.2 Pg·y−1 for the world’s boreal and temperate forests (3), demonstrating the importance of environmentally enhanced forest growth in mitigating the rise in atmospheric CO2 concentration and global warming (13). However, as shown in Figs. 2 and 3, the fraction of C accumulation due to growth enhancement differed by forest type, forest age, and region. The overall fraction was estimated at 8.4–21.6% per hectare and 4.1–35.5% for the country total for the four plantations (Table 2 and Table S6).
What environmental changes explain this observed growth enhancement? To explore this issue, we compared the temporal changes in biomass density for given age classes over different inventory periods for each forest type (Fig. 4A) with the temporal trends in environmental factors (CO2, N deposition, and climate) over the country during 1980–2005 (Fig. 4B). As noted, the changes in biomass density increased significantly from 1980 to 2005 for all four forest types (P < 0.05; Fig. 4A). Further, Japan has experienced dramatic environmental changes during the past decades, with a continuous increase in atmospheric CO2 concentration, a significantly warming climate, and substantial N input into land ecosystems (Fig. 4B); that is, there are strong agreements between the biomass change and environmental trends over the study period for each forest type. A general linear model (GLM) analysis suggests that the four environmental variables explain >99% of the variations in enhanced growth for all four forest types, with elevated CO2 explaining the largest proportion of the variations (Table 3).
Fig. 4.

Comparison between temporal changes in biomass density at given age classes and temporal trends in environmental variables over the study periods. (A) Changes in overall mean biomass density at 5–15 age classes over six inventory periods from 1980 to 2005 for all four forest types. Young age-class stands (fewer than five age classes) were excluded from this analysis because the numbers in initial growth stages are small and may not be influenced by environmental changes (Fig. 2). Biomass density at given age classes (i.e., age-excluded growth) exhibits a significant increase for all forest types. (B) Temporal trends in environmental variables (CO2 concentration, N deposition, MAT, and AP) over the whole country during 1980–2005. All variables except AP showed a significant increase over 25 y. Solid lines indicate a statistically significant increase at P < 0.05, and dashed lines reflect a nonsignificant change. For the data of environmental variables, see Materials and Methods.
Table 3.
Summary of the results obtained from a GLM showing the integrative effects of elevated CO2, N deposition, and climatic change on tree growth across different inventory periods for four major plantations in Japan
| Environmental variable | ||||||
| Forest type | Result* | CO2 | N | MAT | AP | Residuals |
| C. japonica | MS | 35,908*** | 205.25 | 40.3 | 2.24 | 11.99 |
| SS, % | 99.25 | 0.57 | 0.11 | 0.01 | 0.07 | |
| C. obtusa | MS | 32,028*** | 57.64 | 11.37 | 1.37 | 3.32 |
| SS, % | 99.76 | 0.18 | 0.04 | 0.00 | 0.02 | |
| P. densiflora | MS | 17,720*** | 208.92 | 24.91 | 3.12 | 15.22 |
| SS, % | 98.51 | 1.16 | 0.14 | 0.02 | 0.17 | |
| L. leptolepis | MS | 21,591*** | 189.59 | 29.72 | 0.01 | 7.05 |
| SS, % | 98.93 | 0.87 | 0.14 | 0.00 | 0.06 | |
To match biomass density data at the 5-y inventory interval, the corresponding 5-y averaged values of the four environmental variables were calculated and used for the GLM analysis. df, degree of freedom; MS, mean squares; SS, proportion of variances explained by the variable.
df = 1 for all variables and residuals.
P < 0.001.
The results suggest that all the environmental changes stimulated tree growth over the study period, consistent with other findings. Elevated CO2 concentrations cause C fertilization of trees (28, 29), and natural N deposition increases soil N availability and plant N uptake and thus stimulates vegetation growth (30, 31). In addition, Japan is under an oceanic humid climate (32), and therefore warming climate can stimulate biomass C accumulation either through its direct effects on increased rates of photosynthesis and longer growing seasons or through indirect effects on increased nutrient availability due to increased rates of litter decomposition and N mineralization (33).
Our approach is sensitive to changes in management practices, but although practices may have varied locally, they should not have exerted substantial effects on the national-scale analysis. Moreover, national forestry management policies and regimes have not changed substantially over the past several decades in the country (34). For example, there were no significant changes in standing biomass at young-age classes over the different inventory periods (Table S7), suggesting similar silvicultural treatments (e.g., planting density and nurturing); management practices for stand density were similar throughout stand development (Ishikawa Agriculture and Forestry Research Center; http://www.pref.ishikawa.lg.jp/ringyo/); and commercial harvests did not vary over time, because most of the wood consumed in Japan is imported (34). In addition, as shown in Fig. 4 and Table 3, a strong correlation (P < 0.001) between increased biomass density and changes in environmental variables implies no significant effect of management on our analysis.
Our results have several implications. First, the significant contribution of environmentally enhanced growth to the forest biomass C sink emphasizes that C accumulation in forest ecosystems will not necessarily attenuate at a predictable rate as forests mature. Second, to reduce the uncertainties in predicting future C dynamics in forest ecosystems, land surface models should not only consider land-use history, but also account for key physiological processes governing the fate of C sequestration in forest ecosystems, such as the effects of CO2 fertilization, N deposition, and climate warming on vegetation growth. Third, the responses to environmental variability highlight that both stand age and tree traits regulate the sensitivity of the responses of forest growth to global environmental changes. These features should be incorporated into land surface models when predicting future forest C dynamics under a changing environment.
Materials and Methods
Forest Inventory Data.
In this study, forest inventory data were used to investigate the spatial–temporal pattern of forest growth and its response to global environmental changes from 1980 to 2005. Japan has conducted a systematic forest inventory since the 1960s but has consistently reported area and volume of major forest types at each age class in each region (prefecture) only from 1980. In Japan’s forest inventory program, there are 10,000 permanent plots (1,000 m2, 31.62 m × 31.62 m) with a 1-km × 1-km grid. The inventory provides information on forest ownership, tree species, age class, diameter at breast height, tree height, and volume. Forest is defined as an area with 20% or more crown cover for government-owned forests and more than 30% crown cover for community and privately owned forests. The error of timber volume at the country scale is less than 3% (25). According to the forest inventory, natural forests tend to have more tree species with different ages whereas plantations generally have only a few species of similar age. Therefore, this study focused on the biomass C sink and its driving environmental factors for Japan’s plantations. The forest inventory recorded the area and volume of four coniferous plantations (Cryptomeria japonica, Chamaecyparis obtusa, Pinus densiflora, and Larix leptolepis) for each age class during 1980–2005. Among the four plantations, forest inventories reported the area and volume in each prefecture for every age class (i.e., 5, 10, 15, 20, and so on). Thus, the average volume of each age class in each prefecture, each region, and the whole country can be calculated for each of the six inventory periods (1980, 1985, 1990, 1995, 2000, and 2005).
BEF and Biomass Estimation.
Given that forest inventory reports only timber volume rather than biomass of the whole forest, BEF is needed to convert volume into biomass. It has been shown that BEF may be expressed as a function of volume (24, 26, 35, 36). Using 942 sets of field measurement data on forest biomass and volume, Fang et al. (26) developed the functions for estimating BEF values for main forest types in Japan (Eq. 1 and Table S1). These functions are independent of stand density, age class, and site. These BEF values may be used for estimating living biomass of the stand, including leaves, fruits, branches, stems, and roots of all woody plants. Forest floor materials are not included in the BEF values because the available data are very scarce and highly variable among studies;
| [1] |
where x is stand volume and a and b are regression coefficients. BEF approaches the constant a when stand volume increases.
Using Eq. 1, BEF can be applied to forest inventory data to estimate regional- or national-scale forest biomass (37). For a particular forest type, regional biomass can be estimated by the following equation:
| [2] |
where Y is total biomass in a particular region and Ai, xi, and BEFi are the total area, volume per unit area, and BEF value for prefecture i in this region.
Estimation of National and Regional Total Biomass Across All Age Classes.
The national total biomass for a particular forest type was calculated using Eq. 3. Similarly, we can further calculate the national total biomass (NBj, Eq. 4) and its average biomass density (BDj, Eq. 5) for this forest type at age class j. The biomass density at each age class (BDi) in the whole country may be used further to compare growth differences among different age classes (Tables S2–S5). Likewise, the regional biomass density at each age class for a particular forest type can be calculated. In the forest inventory, Japan was divided into eight regions: Hokkaido, Tohoku, Kanto, Chubu, Kinki, Chugoku, Shikoku, and Kyushu-Okinawa. We calculated the biomass density at each age class in each region and compared growth differences among regions:
| [3] |
| [4] |
| [5] |
where NB is the total national biomass for a particular forest type during a specific inventory period; Aij, xij, and BEFij are area, volume per unit area, and BEF value of this forest type in prefecture i and at age class j; n is the number of age classes; m is the number of prefectures; and Aj is the total area of the forest type at age class j.
Calculation of Growth Enhancement Due to Environmental Changes.
At the national or regional scale, if a particular forest type has a similar management regime across different periods, is under relatively constant environmental conditions (i.e., atmospheric CO2 concentration, N deposition, and climate), and appears to be at an equilibrium state, then the overall mean biomass density (ρ) of this forest at a particular age class but different periods should be constant (i.e., ∂ρ/∂t = 0). If ρ changes in different periods, it should be caused by environmental changes. In response to a changing environment, forest biomass density might increase, decrease, or keep relatively stable (no change) across different periods (for details, see legend of Fig. 1). We thus can assess the impact of environmental changes on forest biomass density (biomass per area) simply by investigating changes in biomass density at the same age class but over different inventory periods. If we conduct this analysis for all age classes, we can get environment-induced growth enhancement at different age classes.
The following equation was used to calculate the response of biomass density at a given age class to environmental factors during the study period (a total of six inventory periods during the 25 y from 1980 to 2005):
| [6] |
where GEPAi (growth enhancement per area for an age class) is the environment-induced change in biomass density at age class i during the study period 1980–2005, indicating the magnitude of response of forest biomass density at age class i to environmental changes. BDij is biomass density at age class i and in period j: when i is 1, 2, 3, … n, age is 5, 10, 15, … 5n accordingly; when j is 1, 2, 3, 4, and 5, the period is year 1985, 1990, 1995, 2000, and 2005, respectively. BDi0 stands for biomass density at age class i and in the beginning year (1980) of the study period. Annual mean GEPAi (megagrams of C per hectare per year) in the main text (and Fig. 2) is calculated by dividing GEPAi by the length of the study periods (in most cases, 25 y in this study).
The age-class averaged growth enhancement per area (GEPA) during 1980–2005 thus can be expressed as
| [7] |
the TGE due to environmental changes for a particular forest type can be quantified further as
| [8] |
where BDij and Aij represent biomass density and area of this forest type at age class i and in inventory period j, respectively, whereas BDi0 and Ai0 stand for biomass density and forest area at age class i and in year 1980, respectively.
Estimation of Relative Contribution of Environmental Changes.
The relative contribution of environmental changes to total forest biomass C sink (Rge, %) was calculated as the ratio of environment-induced TGE to total NBI during the inventory period. In addition, the relative contribution of environmental changes to growth enhancement per area (Rgepa, %) was determined as the ratio of environment-induced GEPA to average net biomass increase per area across all age classes (NBIPA) during the inventory period:
| [9] |
| [10] |
| [11] |
| [12] |
where NB1980 and NB2005 represent total biomass of this forest type in years 1980 and 2005, respectively, and BD1980 and BD2005 are biomass density in years 1980 and 2005, respectively.
Data of Environmental Variables.
In this study, we used four environmental variables: mean annual temperature (MAT), annual precipitation (AP), atmospheric CO2 concentration, and N deposition. MAT and AP during the period 1980–2005 were averaged from 138 climatic stations across the country (Japan Meteorological Agency; http://ds.data.jma.go.jp/ghg/kanshi/ghgp/co2_e.html). Annual CO2 concentrations for 1987–2005 were averaged from three stations in Japan (Ryori, Minamitorishima, and Yonagunijima) (Japan Meteorological Agency; http://ds.data.jma.go.jp/obd/stats/data/en/smp/index.html). The CO2 concentrations were extended back to 1980 by regressing the Mauna Loa CO2 data against each of the three stations (Pearson’s r2: 0.9995, 0.9994, and 0.9993 for Ryori, Minamitorishima, and Yonagunijima, respectively). For wet N deposition, we used a nationwide monitoring database (Japan Acid Deposition System) that was started in 1983 (38). Mean annual wet N deposition data across the country were derived from all available observations.
Statistical Analysis.
We performed ordinary least squares regression to examine temporal changes in biomass density in the four major plantations among different inventory periods, as well as temporal variability in environmental variables across the country during the period 1980–2005. We then conducted a GLM analysis to evaluate their comprehensive effects on biomass changes over different inventory periods. All statistical analyses were conducted using SPSS 13.0 (39).
Supplementary Material
Acknowledgments
We thank L. Y. Chen for preparing Fig. 1 and two anonymous reviewers for helpful comments on a previous version of the manuscript. This work was funded by the National Natural Science Foundation of China (31321061 and 31330012), the National Basic Research Program of China on Global Change (2010CB950600), and the Chinese Academy of Sciences (XDA05050300).
Footnotes
The authors declare no conflict of interest.
This article is a PNAS Direct Submission.
This article contains supporting information online at www.pnas.org/lookup/suppl/doi:10.1073/pnas.1402333111/-/DCSupplemental.
References
- 1.Goodale L, et al. Forest carbon sinks in the northern hemisphere. Ecol Appl. 2002;12(3):891–899. [Google Scholar]
- 2.Bonan GB. Forests and climate change: Forcings, feedbacks, and the climate benefits of forests. Science. 2008;320(5882):1444–1449. doi: 10.1126/science.1155121. [DOI] [PubMed] [Google Scholar]
- 3.Pan Y, et al. A large and persistent carbon sink in the world’s forests. Science. 2011;333(6045):988–993. doi: 10.1126/science.1201609. [DOI] [PubMed] [Google Scholar]
- 4.Fang J, et al. Forest biomass carbon sinks in East Asia, with special reference to the relative contributions of forest expansion and forest growth. Glob Change Biol. 2014;20(6):2019–2030. doi: 10.1111/gcb.12512. [DOI] [PubMed] [Google Scholar]
- 5.Caspersen JP, et al. Contributions of land-use history to carbon accumulation in U.S. forests. Science. 2000;290(5494):1148–1151. doi: 10.1126/science.290.5494.1148. [DOI] [PubMed] [Google Scholar]
- 6.Schimel D, et al. Contribution of increasing CO2 and climate to carbon storage by ecosystems in the United States. Science. 2000;287(5460):2004–2006. doi: 10.1126/science.287.5460.2004. [DOI] [PubMed] [Google Scholar]
- 7.Joos F, Prentice IC, House JI. Growth enhancement due to global atmospheric change as predicted by terrestrial ecosystem models: Consistent with US forest inventory data. Glob Change Biol. 2002;8(4):299–303. [Google Scholar]
- 8.Vetter M, et al. Partitioning direct and indirect human-induced effects on carbon sequestration of managed coniferous forests using model simulations and forest inventories. Glob Change Biol. 2005;11(5):810–827. [Google Scholar]
- 9.Albani M, Medvigy D, Hurtt GC, Moorcroft PR. The contributions of land-use change, CO2 fertilization, and climate variability to the eastern US carbon sink. Glob Change Biol. 2006;12(12):2370–2390. [Google Scholar]
- 10.Magnani F, et al. The human footprint in the carbon cycle of temperate and boreal forests. Nature. 2007;447(7146):848–850. doi: 10.1038/nature05847. [DOI] [PubMed] [Google Scholar]
- 11.McMahon SM, Parker GG, Miller DR. Evidence for a recent increase in forest growth. Proc Natl Acad Sci USA. 2010;107(8):3611–3615. doi: 10.1073/pnas.0912376107. [DOI] [PMC free article] [PubMed] [Google Scholar]
- 12.Hember RA, et al. Accelerating regrowth of temperate-maritime forests due to environmental change. Glob Change Biol. 2012;18(6):2026–2040. [Google Scholar]
- 13.Shevliakova E, et al. Historical warming reduced due to enhanced land carbon uptake. Proc Natl Acad Sci USA. 2013;110(42):16730–16735. doi: 10.1073/pnas.1314047110. [DOI] [PMC free article] [PubMed] [Google Scholar]
- 14.Nabuurs G, et al. First signs of carbon sink saturation in European forest biomass. Nat Clim Change. 2013;3:792–796. [Google Scholar]
- 15.Luyssaert S, et al. Old-growth forests as global carbon sinks. Nature. 2008;455(7210):213–215. doi: 10.1038/nature07276. [DOI] [PubMed] [Google Scholar]
- 16.Lewis SL, et al. Changing ecology of tropical forests: Evidence and drivers. Annu Rev Ecol Evol Syst. 2009;40:529–549. [Google Scholar]
- 17.Anderson-Teixeira KJ, et al. Altered dynamics of forest recovery under a changing climate. Glob Change Biol. 2013;19(7):2001–2021. doi: 10.1111/gcb.12194. [DOI] [PubMed] [Google Scholar]
- 18.Stephenson NL, et al. Rate of tree carbon accumulation increases continuously with tree size. Nature. 2014;507(7490):90–93. doi: 10.1038/nature12914. [DOI] [PubMed] [Google Scholar]
- 19.Jump AS, et al. Rapid climate change-related growth decline at the southern range edge of Fagus sylvatica. Glob Change Biol. 2006;12(11):2163–2174. [Google Scholar]
- 20.Canadell JG, et al. Factoring out natural and indirect human effects on terrestrial carbon sources and sinks. Environ Sci Policy. 2007;10(4):370–384. [Google Scholar]
- 21.Houghton RA, Hackler JL, Lawrence KT. The U.S. carbon budget: Contributions from land-use change. Science. 1999;285(5427):574–578. doi: 10.1126/science.285.5427.574. [DOI] [PubMed] [Google Scholar]
- 22.Brown SL, Schroeder PE. Spatial patterns of aboveground production and mortality of woody biomass for eastern U.S. forests. Ecol Appl. 1999;9(3):968–980. [Google Scholar]
- 23.Kurz WA, Apps MJ. A 70-year retrospective analysis of carbon fluxes in the Canadian forest sector. Ecol Appl. 1999;9(2):526–547. [Google Scholar]
- 24.Fang J, Chen A, Peng C, Zhao S, Ci L. Changes in forest biomass carbon storage in China between 1949 and 1998. Science. 2001;292(5525):2320–2322. doi: 10.1126/science.1058629. [DOI] [PubMed] [Google Scholar]
- 25.Japan Agency of Forestry . Forest Resources of Japan 1995. Tokyo: Japan Agency of Forestry; 2000. [Google Scholar]
- 26.Fang JY, et al. Biomass carbon accumulation by Japan’s forests from 1947-1995. Global Biogeochem Cycles. 2005;19:GB2004. doi: 10.1029/2004GB002253. [DOI] [Google Scholar]
- 27.Fang JY, et al. Overestimated biomass carbon pools of the northern mid- and high latitude forests. Clim Change. 2006;74(1-3):355–368. [Google Scholar]
- 28.Beedlow PA, et al. Rising atmospheric CO2 and carbon sequestration in forests. Front Ecol Environ. 2004;2(6):315–322. [Google Scholar]
- 29.Norby RJ, et al. Forest response to elevated CO2 is conserved across a broad range of productivity. Proc Natl Acad Sci USA. 2005;102(50):18052–18056. doi: 10.1073/pnas.0509478102. [DOI] [PMC free article] [PubMed] [Google Scholar]
- 30.Hyvönen R, et al. The likely impact of elevated [CO2], nitrogen deposition, increased temperature and management on carbon sequestration in temperate and boreal forest ecosystems: A literature review. New Phytol. 2007;173(3):463–480. doi: 10.1111/j.1469-8137.2007.01967.x. [DOI] [PubMed] [Google Scholar]
- 31.Reay S, et al. Global nitrogen deposition and carbon sinks. Nat Geosci. 2008;1:430–437. [Google Scholar]
- 32.Kira T. Forest ecosystems of east Asia and southeast Asia in a global perspective. Ecol Res. 1991;6(2):185–196. [Google Scholar]
- 33.Rustad LE, et al. A meta analysis of the response of soil respiration, net nitrogen mineralization, and aboveground plant growth to experimental ecosystem warming. Oecologia. 2001;126(4):543–562. doi: 10.1007/s004420000544. [DOI] [PubMed] [Google Scholar]
- 34.Forest Agency of Japan . Annual Report on Forest and Forestry in Japan. Tokyo: Forestry Agency; 2002. [Google Scholar]
- 35.Brown SL, Lugo AE. Aboveground biomass estimates for tropical moist forests of Brazilian Amazon. Interciencia. 1992;17(1):8–18. [Google Scholar]
- 36.Schroeder P, et al. Biomass estimation for temperate broadleaf forests of the United States using inventory data. Forest Sci. 1997;43(3):424–434. [Google Scholar]
- 37.Fang JY, Chen AP. Dynamic forest biomass carbon pools in China and their significance. Acta Bot Sin. 2001;43(9):967–973. [Google Scholar]
- 38.Morino Y, et al. Temporal variations of nitrogen wet deposition across Japan from 1989 to 2008. J Geophys Res. 2011;116:D06307. [Google Scholar]
- 39.SPSS Inc 2012. SPSS 13.0 (SPSS Inc., Chicago)
Associated Data
This section collects any data citations, data availability statements, or supplementary materials included in this article.