Significance
PvuII and XbaI polymorphisms at the estrogen receptor-α (ERα) intron 1 are associated with several estrogen-dependent pathologies including cancers. Here, we demonstrate that these SNPs map within a pausing site of Pol II elongation, a block that is cyclically released producing an oscillatory expression of ERα during cell division. The protoncogene c-MYB is part of this oscillator modulating the amplitude of ERα fluctuations in the presence of different SNP haplotypes. During breast cancer progression toward a hormone refractory phenotype, Pol II pausing contributes to turn off ERα synthesis highlighting the clinical relevance of the mechanism. Furthermore, the wide range of physio-pathological conditions associated with these SNPs, indicates this oscillator as a novel level of regulation of the hormonal signal throughout the body.
Keywords: steroid receptors, genetic polymorphisms, oscillatory gene expression, polymerase blockage, transcriptional oscillators
Abstract
Decades of studies provided a detailed view of the mechanism of estrogen receptor-α (ERα) regulated gene transcription and the physio-pathological relevance of the genetic programs controlled by this receptor in a variety of tissues. However, still limited is our knowledge on the regulation of ERα synthesis. Preliminary observations showed that the expression of ERα is cell cycle regulated. Here, we have demonstrated that a well described polymorphic sequence in the first intron of ERα (PvuII and XbaI) has a key role in regulating the ERα content in cycling cells. We have shown that the RNA Pol II (Pol II) elongation is blocked at the polymorphic site and that the proto-oncogene c-MYB modulates the release of the pausing polymerase. It is well known that the two SNPs are associated to an increased risk, progression, survival and mortality of endocrine-related cancers, here we have demonstrated that the c-MYB-dependent release of Pol II at a specific phase of the cell cycle is facilitated by the px haplotype, thus leading to a higher ERα mitogenic signal. In breast cancer, this mechanism is disrupted when the hormone refractory phenotype is established; therefore, we propose this oscillator as a novel target for the development of therapies aimed at sensitizing breast cancer resistant to hormonal treatments. Because PvuII and XbaI were associated to a broad range physio-pathological conditions beside neoplastic transformation, we expect that the ERα oscillator contributes to the regulation of the estrogen signal in several tissues.
Estrogen receptor-α (ERα) is a member of the intracellular receptor superfamily expressed in a wide variety of tissues where it mediates a multiplicity of estrogen effects on reproductive, skeletal, vascular and metabolic systems. ERα human gene is dispersed over a region of more than 250 Kb in the long arm of chromosome 6 where hundreds of single nucleotide polymorphisms (SNPs) were identified. Among these, the restriction fragment length polymorphisms (RFLPs) PvuII (p/P or IVS-397C/T or rs2234693, intron 1 nucleotide position 33,836) and XbaI (x/X or IVS-351A/G or rs9340799, intron 1 nucleotide position 33,882) were reported to be genetically linked to several phenotypic traits and disorders influenced by estrogens. For hormone-dependent cancers, association studies demonstrated linkage of these polymorphisms to: (i) breast cancer risk (1), survival (2), and mortality associated to hormone treatment (3); (ii) insurgence of ductal type carcinoma (4); (iii) age of breast cancer onset (5–7); (iv) predisposing factors (7), such as mammographic density (8), age of menarche, and menopause (9); and (v) endometrial (10) and prostate cancer risks (11). The functional role of PvuII and XbaI SNPs in affecting these pathological phenotypes remains to be elucidated. The location of these polymorphisms at the intron 1/exon 2 boundary suggests their potential involvement in the regulation of ERα transcription. Indeed, the sequence spanning the PvuII polymorphism was demonstrated in vitro to bind the proto-oncogene c-MYB therein proposed as a potential regulator of ERα expression (12). However, others molecular genetics studies could not conclusively demonstrate an association between the PvuII site and receptor contents in human breast cancers so far (1, 13) or even obtained opposite results (14). However, ERα status is a valuable prognostic and predictive biomarker in the management of breast cancer patients (15). It is current belief that ERα mediates E2-induced growth in endocrine cancers, thus, the receptor synthesis is a plausible checkpoint in neoplastic transformation. The aim of the present study was to assess the extent to which PvuII and XbaI control ERα synthesis and how this is critical for neoplastic transformation. Our work, by decrypting the functional role of PvuII and XbaI polymorphic sites, provide an unexpected link among control of Pol II elongation, oscillatory gene expression and hormonal tumorigenesis.
Results
Blockage of Transcription Elongation at the First Intron of ERα.
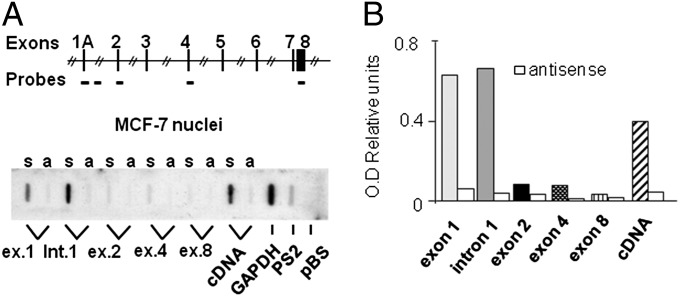
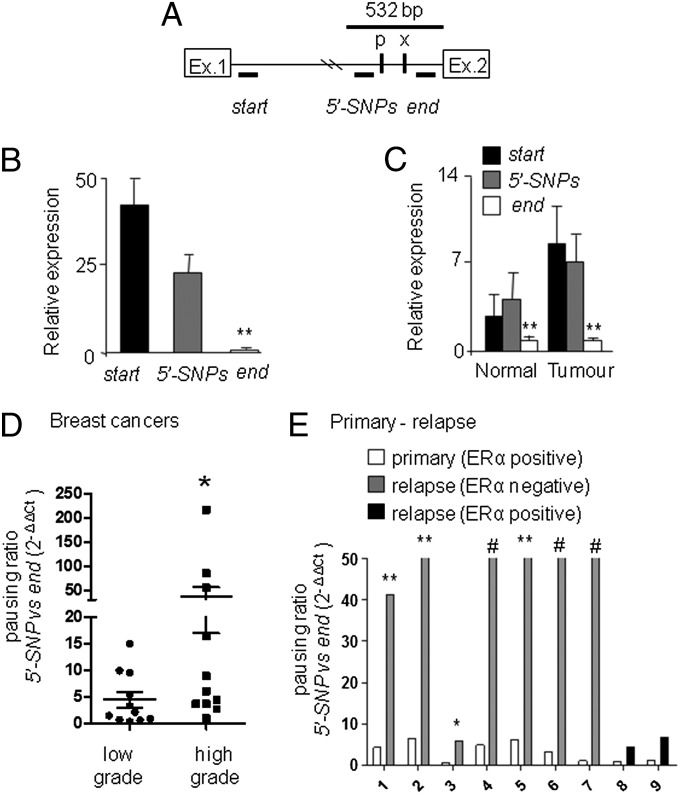
To gain insight on PvuII/XbaI involvement in the regulation of ERα transcription, we carried out a series of run on assays in MCF-7 breast cancer cells. We used as run on probes either the entire ERα coding sequence or five DNA fragments mapping within the receptor genomic locus in sense and antisense orientations. No antisense transcript was found. Sense transcripts were detected in exon 1 and intron 1, but, not in exon 2, 4 and 8 (Fig. 1). Similar results were obtained in T47D, another breast cancer cell line (SI Appendix, Fig. S1). As control of hybridization capability of the probes, run on experiments were also done on nuclei of SK-ER3 cells constitutively expressing a full length ERα cDNA: in this case, all probes were equally able to detect the corresponding transcripts (SI Appendix, Fig. S1C). These data suggested the presence of an arrest of Pol II transcriptional elongation at intron 1. To map the site responsible for the hypothesized Pol II arrest, we used semiquantitative real-time PCR to measure the relative concentrations of nuclear transcripts containing selected intron 1 sequences in MCF-7 cells (Fig. 2 A and B). Consistent with the run on data (Fig. 1), transcripts carrying the 5′ intron 1 region (start amplicon) were found to be significantly more represented (33-fold) than those carrying the 3′ (end amplicon). The levels of nuclear RNA containing the amplicon located immediately upstream the SNPs (5′-SNP) were also significantly higher (14-fold) than the transcripts containing the end amplicon, pointing to a major block of transcription within the 532-bp sequence containing the two RFLPs (Fig. 2B). Similar enrichment of the amplicons 5′ the SNPs were found in human normal and neoplastic endometrium (Fig. 2C). In accordance with these observations, Hah and collaborators reported accumulation of nuclear transcripts at the intron 1-exon 2 boundary using a global run on and sequencing approach (16). These results prompted us to analyze the nuclear transcripts from a larger biological sample size including low-grade (n = 11) and high-grade (n = 11) human breast cancers (SI Appendix, Table S1). To obtain an absolute measure of the primary transcripts containing the 5′-SNP and end amplicons, we carried out a quantitative PCR (qPCR) using the standard curve procedure (SI Appendix, Fig. S2A) to measure the transcriptional blockage in breast cancer cell lines (SI Appendix, Fig. S2B) and in human breast samples (Fig. 2D and SI Appendix, Table S1). Pol II pausing was clearly present in the cell lines and in about 80% of the tumor samples. The magnitude of the pausing ratio appeared to be significantly more pronounced in high grade than in low grade tumors (Fig. 2D), although quite variable. To normalize the genetic background variability, we measured the pausing ratio within the same patient in the primary tumor and in the subsequent relapse. Seven pairs of ERα-positive primary tumors/ERα-negative relapses and two pairs of ERα-positive primary tumors/ERα-positive relapses were analyzed (SI Appendix, Table S2): we observed a major, statistically significant, increase (from 10 to more than 100 times) of the Pol II blockage (Fig. 2E and SI Appendix, Table S2) during relapse to ERα-negative tumors, whereas only a nonsignificant trend to increase was observed in the ERα-positive recurrences, suggesting that this mechanism may play a role in the development of ER negative, hormone-refractory lesions.
Fig. 1.
Block to transcription elongation at ERα intron 1. (A) The inserted scheme represents the human ERα locus with the genomic position of the run on probes (Upper). Autoradiography of the run on assay on MCF-7 cells (Lower). Probe identity is indicated; s, single strand probes detecting sense transcripts; a, single strand probes antisense transcripts. (B) Optical density (OD) analysis of the autoradiographic signals; bars represent the signals derived from sense transcripts normalized on the probe length vs. GAPDH signal; white bars represent the signal generated by antisense transcripts.
Fig. 2.
The Pol II block of transcription involves the PvuII and XbaI polymorphisms and is modulated during breast cancer progression. (A) Scheme of the real-time PCR amplicons mapping within intron 1; P = PvuII and x = Xba1 RFLPs. (B) Relative amount of the primary transcripts containing the amplified sequences, bars are the average values ± mean SE (SEM) of the fold enrichment versus the end amplicons. **P < 0.01 both start and the 5′-SNPs versus the end amplicon. (C) Same as (B) on RNA samples obtained from normal and neoplastic human endometrium. **P < 0.01 both start or 5′-SNPs versus the end amplicon. (D) Pausing is calculated as the ratio between the absolute number of transcripts containing the 5′SNP and end amplicons measured by quantitative real-time PCR from low and high grade breast cancers. Bars are average values ± SEM *P < 0.05 calculated on the pausing ratio of high versus low grade tumors with the Mann Whitney test. (E) The pausing ratio defined as in (D) in primary breast cancers (white bars) and relapses (dark gray or black bars) from n. 9 individuals; bars are averages values ± SEM. #, in these cases, the end amplicon could not be detected, the pausing ratio was higher than 50 times; **P < 0.01 pausing rate of relapse versus primary breast tumors. All data were collected in at least two independent experiments performed in triplicate. Student t test was applied to determine statistical significance.
Release of Pol II Blockage Is Regulated During Cell Cycle and Correlates with ERα Oscillatory Expression.
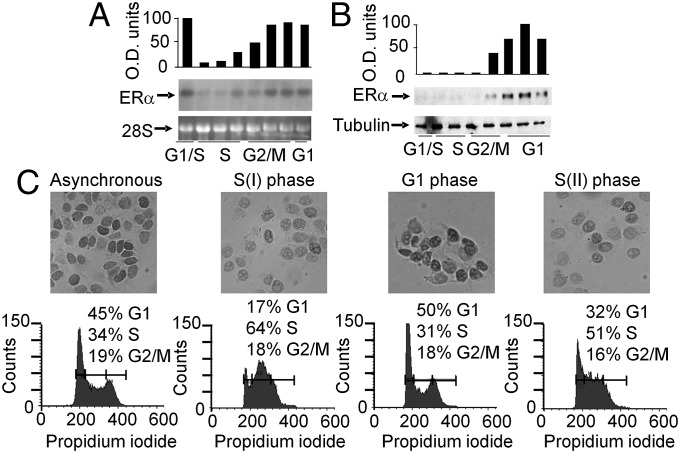
Oscillations of ERα expression is known to occur during cell division (17–19). In accordance to receptor fluctuation, our immunocytochemistry studies in clones of MCF-7 showed a heterogeneous distribution of the receptor, indicating that ERα expression could be cell cycle-modulated (SI Appendix, Fig. S3A); interestingly, this heterogeneity is also often found in human endometrial and breast cancer specimens and is used as a parameter for scoring tissues for patient classification (15). We postulated that the mechanism of Pol II block and release involving the intronic region could be responsible of the ERα oscillatory expression during cell cycle. By arresting the cell cycle at different phases, we initially showed that the ERα content significantly decreased at the G1/S transition (SI Appendix, Fig. S3B). To investigate the kinetics of ERα fluctuation, the experiment was repeated by measuring ERα expression at different times after removal of the synchronizing agent. Upon thymidine removal, 60–70% of the cells synchronously reached the S-phase and returned in G1 20–24 h later as demonstrated by cytofluorimetry (Fig. 3). ERα mRNA was low during the entire S phase and significantly increased in G2/M and G1 after thymidine removal (Fig. 3A); consistent with this observation, ERα protein was low in S-phase, increased in G1 and again decreased in the second S phase as demonstrated by Western blot and immunocytochemistry studies (Fig. 3 B and C and SI Appendix, Fig. S3C). Similar oscillatory mRNA and protein expression was observed in synchronized ZR 75.1 cells (SI Appendix, Fig. S4). To correlate the Pol II block with the ERα mRNA fluctuations during the cell cycle, we carried run on assays with nuclei of MCF-7 cells at different cell cycle phases (Fig. 4): In G1/S, transcription was barely detectable along the whole locus; the transcription blockage observed in S phase was released in late S/G2 phase (13 h after thymidine withdrawal) and resumed 3 h later in G2/M phase. These data showed that the production of a full-length ERα mRNA occurred only for a short time window during the 3–6 h interval in late S/G2 phase. These data suggested that the transient release of the Pol II block from intron 1 initiates the oscillatory wave of ERα expression leading to a peak of receptor levels at G1.
Fig. 3.
Intracellular ERα concentration fluctuates during the cell cycle. After thymidine washout cells were harvested at different cell cycle phases. ERα mRNA and protein content were measured by Northern blot (A), Western blot (B), and immunocytochemistry analysis (C). Bars in the graphs represent ERα mRNA levels normalized with 28S ribosomal RNA (A) and ERα protein content normalized with tubulin (B). Similar data were obtained at least in two independent experiments. (C) Immunocytochemistry was carried out as in (A) on cells at the indicated phases of the cell cycle: asynchronous cells (As), first S (I), G1, and second S (II). Cell cycle phases were determined by cytofluorometry.
Fig. 4.
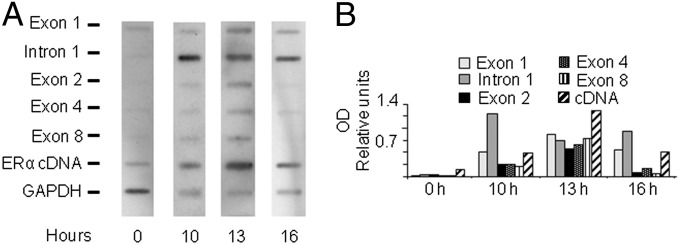
Pol II block is released in the late S/G2 phase of the cell cycle. (A) Representative autoradiography of filters hybridized with 32P-labeled primary transcripts obtained from nuclei of MCF-7 cells taken after release from the thymidine block at the indicated time points; the experiment was repeated twice. (B) OD analysis of the autoradiographic signals; bars represent the signals derived from hybridization normalized on the probe length vs. GAPDH signal.
An Evolutionary Conserved 76-bp Sequence Regulates Pol II Elongation During Cell Cycle.
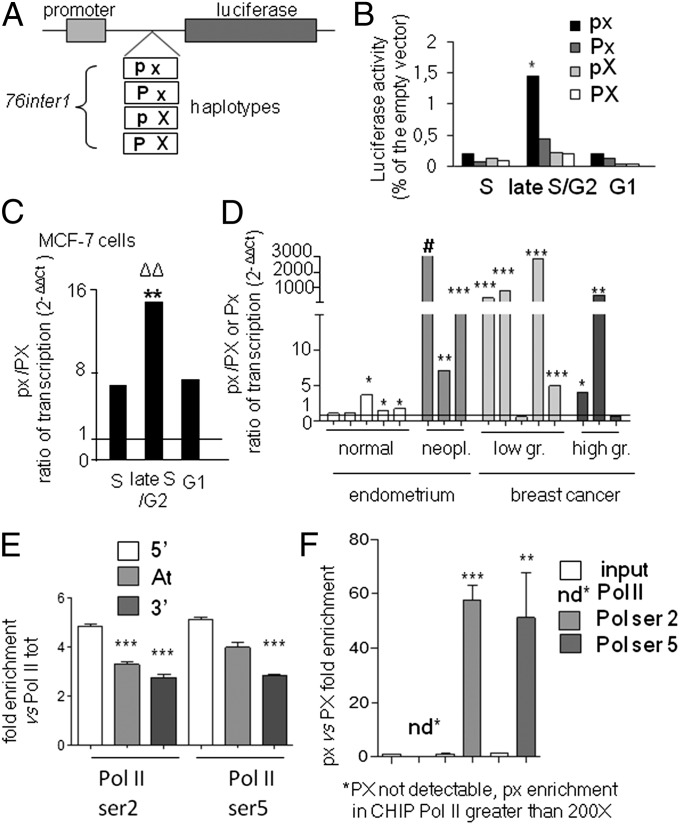
Among the 532-bp sequence of intron 1 responsible of the Pol II elongation block (Fig. 2 A and B), a minimal 76-bp sequence (76inter1; i.e., 76 bp intervening sequence 1), containing the two SNPs was found evolutionary conserved (SI Appendix, Fig. S5A) and therefore was tested for its ability to regulate the Pol II release during cell cycle. To this aim, the 76inter1 sequence was cloned downstream the SV40 promoter driving the luciferase reporter gene (SI Appendix, Fig. S5B) and tested in transient transfection experiments: the 76inter1 fragment significantly reduced the reporter expression (SI Appendix, Fig. S5B). Next, we asked whether the 76inter1 was responsible for the regulation of Pol II elongation occurring during cell cycle (Fig. 4), and what was the role of different PvuII/XbaI haplotypes in this process. The effects of each of the four haplotypes (Fig. 5A) were tested in thymidine synchronized MCF-7 cells transfected with the four constructs. We found that Luciferase transcription was low in S-phase for all constructs, but increased up to sevenfold (for the px containing construct) in late S/G2 phase to decrease at baseline levels at the beginning of G1 phase (Fig. 5B). The highest transcriptional activity was observed for the px containing construct suggesting that this haplotype is coupled with a higher rate of Pol II elongation in late S/G2 phase. These data also indicated that the effect of the haplotype on transcription could be appreciated only in the late S/G2 phase, whereas, in S phase, transcription is prevented for all haplotypes. In agreement with this conclusion, Pol II was found blocked at the polymorphic site even in cells carrying an homozygous px/px genotype, like the T47D (SI Appendix, Figs. S1 and S2).
Fig. 5.
Higher rate of Pol II elongation is associated with the px haplotype. (A) Scheme of the 76inter1 DNA fragments subcloned into the pGL3 vector carrying the four different haplotypes (px, Px, pX, PX). These constructs were transfected in MCF-7 cells. (B) Bars are the ratio of the relative light units (RLU) (normalized on β-galactosidase activity) of each haplotype containing construct versus the empty vector measured in transfected cells in S, late S/G2, and G1 phases; *P < 0.05, px vs. Px at 13 h. (C) Bars are the px/PX ratio ± SEM of allele-specific expression measured by real-time PCR at the indicated cell cycle phases, **P < 0.005, late S/G2 vs. S; ΔΔ P < 0.005, late S/G2 vs. G1. (D) The px/PX ratio of allele-specific expression measured in eight human biopsies of normal and neoplastic endometrium and in eight low- and high-grade breast cancers heterozygous for the XbaI polymorphic site; bars are average values ± SEM; # in this case px was the only allele transcribed, ***P < 0.001, **P < 0.01, *P < 0.05 px versus PX or Px ratio of transcription. (E) ChIPs with anti-total Pol II and anti-phosphorylated isoforms of Ser2 and Ser5 of the CTD; real-time PCRs were done using primers upstream (5′) downstream (3′) or within (At) the attenuation site; bars are average values ± SEM of the fold enrichment relative to the total Pol II, ***P < 0.001 comparing 3′ and At versus 5′ amplifications. (F) The same ChIP samples reported in E, but amplifications were carried out with allele-specific real-time PCR; ***P < 0.001 and **P < 0.01 comparing the px/PX ratio from ChIP anti-Pol II Ser2 or Ser5 versus ChIP input, respectively. Data were collected from at least two independent experiments performed in triplicate. P values were calculated with one way ANOVA followed by Bonferroni’s post test.
The PvuII and XbaI Haplotype Configuration Influences the Amplitude of ERα Fluctuation During Cell Cycle.
To demonstrate that px facilitates Pol II read-through also in the chromosomal context, we set up an allele-specific real-time PCR protocol that was applied to the nuclear RNA transcripts obtained from synchronized MCF-7 cells (which carries px and PX haplotypes) in S, late S/G2 and G1 phase. This assay is based on the ability of oligonucleotide probes to discriminate the nuclear transcripts generated by heterozygous alleles at the XbaI polymorphic site. The analysis demonstrated a significantly higher amount of transcripts carrying the px haplotype (compared with those carrying the PX) in all phases of the cell cycle (Fig. 5C) with a px/PX ratio of transcription of 6.7 fold in S phase, which significantly increased up to 14.3 fold in late S/G2, to decrease at 7.1 fold in G1. We concluded that also in the chromosomal context the px haplotype allowed a more efficient Pol II elongation when the blockade is released in late S/G2. Consistent with this observation, we found a prevalence of the px transcripts in low/high-grade breast cancers (SI Appendix, Table S1) and in endometrium (SI Appendix, Table S3) human samples; the transcription ratio (px/PX or Px/PX) varied, in some cases was as much as 3,000 times higher and in one case the px was the only allele transcribed (Fig. 5D). To gain more insights into the mechanism, we have investigated the recruitment of Pol II, upstream, within and downstream the SNPs site in the context of the px or PX alleles by chromatin immunoprecipitation (ChIP) and allele specific amplification assays. ChIPs were carried out with Pol II specific antibodies including anti-total Pol II and anti-phosphorylated isoforms of Ser5 and Ser2 of the CTD. The results showed that activated Pol II (Ser2 and Ser5 phosphorylated) was significantly accumulated upstream the SNP sites (Fig. 5E) and mostly on the px allele (Fig. 5F). Activated Pol II is thus enriched at the site of pausing and is ready to be released upon appropriate stimulations occurring during late S/G2 phase of the cell cycle.
The Proto-Oncogene c-MYB Differentially Regulates the Release of the Pol II Block at the Polymorphic Site.
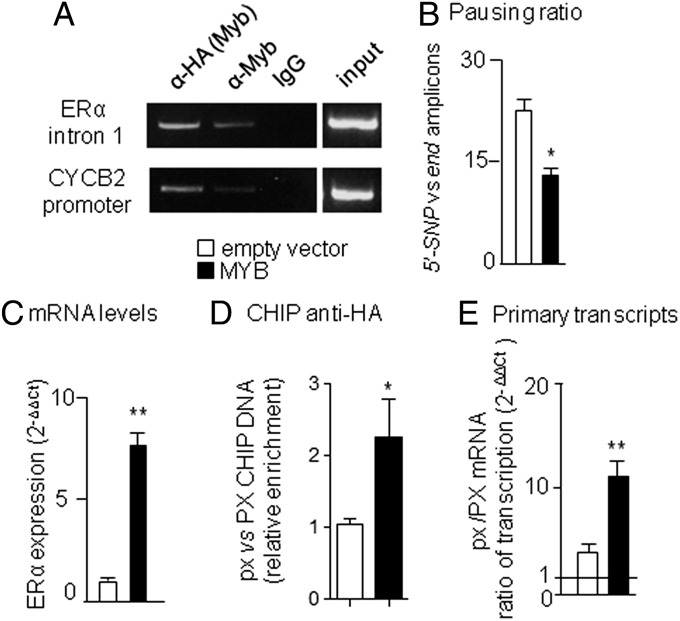
Based on the hypothesis of the existence of a cell factor able to recognize the ERα intron 1 and facilitate Pol II elongation, we carried out a large series of transfection experiments using the assay reported in SI Appendix, Fig. S5B to test the effect of several proteins and signaling pathways (SI Appendix, Table S4); although some factors displayed a significant activity in strengthening the block of Pol II elongation (NFYA, Phorbol ester, LeptomycinB, LiCl), these experiments enabled us to identify c-MYB as a good candidates for the release of Pol II elongation. Interestingly, c-MYB had been previously proposed as a modulator of ERα gene transcription through the PvuII RFLP sequence (12), although the mechanism underlying this activity had never been investigated. To verify whether c-MYB was able to bind the chromatin surrounding the ERα intron 1 polymorphic site, we overexpressed a HA-tagged c-MYB (20) in MCF-7 cells (SI Appendix, Fig. S6A) and immunoprecipitated the chromatin bound c-MYB using anti-HA, anti-c-MYB and anti IgG antibodies (Fig. 6A). We found a specific c-MYB enrichment in the chromosomal region surrounding the two polymorphisms and in the CCNB2 promoter used as a positive control; no amplification signals were visible when unspecific IgG or primers mapping at – 35 Kb upstream were used (Fig. 6A and SI Appendix, Fig. S6B). Indeed, a cluster of potential c-MYB binding sites is present in the region surrounding the SNPs (the frequency of the site in the remaining sequence of the intron is about one in 1.5 Kb) including the PvuII polymorphic site proposed (12) as a putative MYB regulatory element (SI Appendix, Fig. S6D). Modulation of c-MYB expression directly influenced Pol II elongation, since increased or decreased c-MYB expression reduced (Fig. 6B) or increased the pausing ratio (SI Appendix, Fig. S6 E and F). c-MYB activity was shown highest on the px allele in the transfection assay (SI Appendix, Fig. S6C), therefore we analyzed the effects of the transcription factor overexpression in the chromosomal context of the endogenous gene; to this aim, we measured the enrichment of the px allele and the ratio of the nuclear transcripts carrying the px and PX allele in ChIP experiments carried out using anti-HA antibody in c-MYB overexpressing cells (Fig. 6 C and D). A significant increase of the px allele in the immunoprecipitate and an increased level of px transcripts were observed in c-MYB overexpressing cells, confirming that c-MYB preferentially binds and differentially facilitates the release of Pol II elongation depending on the PvuII/XbaI haplotype in the endogenous ERα gene leading to the increased production of mature ERα mRNA (Fig. 6E). Interestingly, previous works described an analogous mechanism of regulation by ERα on the Pol II release on the c-MYB gene (21), suggesting that a reciprocal regulation between these two transcription factors is occurring at the level of Pol II elongation. In keeping with this reciprocal regulation, c-MYB expression is low during the S-phase both in MCF-7 and ZR 75.1 cell lines (SI Appendix, Fig. S7). This low expression is not just a consequence of the reported ERα regulation of c-MYB (21), because the ectopical increase of c-MYB expression during S-phase by transient transfection in thymidine synchronized cells, produced a correspondent increased level of ERα expression selectively in c-MYB transfected samples (SI Appendix, Fig. S8), again indicating that c-MYB plays a critical role for the release of the Pol II blockage at the intron 1 polymorphic site during the cell cycle. The reciprocal regulation between c-MYB and ERα in humans is also well supported by the significant correlation of their expression found in clinical samples showed by previous studies (21–23) and in our own analysis of public databases (SI Appendix, Fig. S9). We propose that the coordinate regulation of these two transcription factors controlling their oscillatory expression during cell cycle represents a novel concept to better understand the hormone action throughout the body.
Fig. 6.
The effects of c-MYB overexpression on the block of Pol II elongation in MCF7 cells. (A) ChIP analysis of the ERα intron 1 site and CYCB2 promoter (as positive control) using anti-HA and anti-cMYB antibodies and mouse IgG. (B) Pausing ratio calculated as in Fig. 2D; bars represent mean values ± SEM, *P < 0.05 MCF-7::HA-cMYB versus MCF-7::empty vector. (C) ERα mRNA levels measured by real-time PCR; bars represent means ± SEM, **P < 0.001 MCF-7 HA-cMYB versus MCF-7 empty vector. (D) ChIPs performed with anti-HA antibody followed by allele-specific real-time PCR; bars represent the ratio of px/PX template, *P < 0.01 MCF-7::HA-cMYB versus MCF-7::empty vector. (E) Ratio of px/PX mRNA measured by allele-specific real-time PCR; bars represent mean values ± SEM, **P < 0.01 MCF-7::HA-cMYB versus MCF-7::empty vector. Data were collected in at least two independent experiments performed in triplicate. P values were calculated with one way ANOVA followed by Bonferroni’s post test.
Discussion
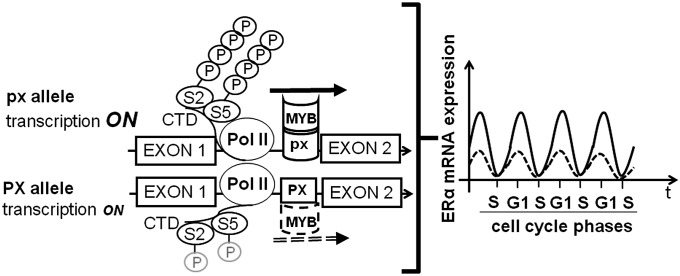
Our study provides the explanation for the genetic association between the PvuII/XbaI polymorphisms and several aspects of estrogen physio-pathology including neoplastic transformation of tissues target of estrogen signaling, thus suggesting that the ERα oscillatory expression is involved in these processes. Our finding that the magnitude of pausing at the intron 1 site increases during progression toward a hormone-refractory ERα-negative breast cancer, underlies the clinical relevance of this molecular switch. The ERα oscillatory expression is tightly controlled by an evolutionary conserved site (SI Appendix, Fig. S5A) where both SNPs map; the mechanism controlling fluctuation involves the c-MYB proto-oncogene, which modulates the Pol II release from the blockage by recognizing, with different affinities, the four haplotypes at the PvuII and XbaI sites (Fig. 7).
Fig. 7.
Model for the control of ERα oscillatory expression during cell cycle by transcriptional pausing. The presence of px in the pausing sequence allows a stronger binding of c-MYB and facilitates the transcription of elongating Pol II (CTD phosphorylated in Ser2 and Ser5) compared with the PX allele, therefore producing an increased amplitude of receptor oscillatory expression during cell cycle.
Decrypting PvuII and XbaI Polymorphic Sites in the ERα Intron 1 Links Pol II Elongation to Estrogen-Dependent Carcinogenesis.
The present study shows that the association among PvuII and XbaI polymorphisms and hormonal tumorigenesis is likely due to the perturbation of the oscillatory expression of ERα occurring during cell division. Oscillatory expression of the receptor is required for a correct cell division: disruption of the mechanism by ERα constitutive expression was shown to arrest the cell cycle (24) and to induce apoptosis (25) also in the absence of ligand, indicating that hormone-independent pathways are playing a role in the regulation of cell division (26). According to our data, c-MYB, during cell cycle, induces a higher Pol II elongation in the presence of the px haplotype, thus increasing the amplitude and length of the receptor oscillatory expression in proliferating cells; we may speculate that this is causing the activation of overlapping, but not coincident genetic programs during cell cycle, with a differential ability of the receptor to couple its expression with other rhythmic transcriptional programs whose disruption may contribute to the development of hormone-dependent neoplasia (27). It is tempting to speculate that ERα oscillatory expression is part of a cell cycle oscillator (28, 29) involving c-MYB in a positive feed-back loop (21); in agreement with our study, an increasing number of clinical (22, 23) and molecular data (21, 30) suggest a direct involvement of c-MYB in mammary carcinogenesis. Future studies should clarify the relation, if any, of the receptor oscillation in the tumor initiating cell and the tumor suppressive functions of circadian oscillators (27); in line with this idea, oscillation of bHLH transcription factors was recently demonstrated to control multipotency and fate in mouse progenitors (31).
Clinical Implications.
Selected studies have tested the predictive value of using the PvuII and XbaI polymorphisms as markers of responsiveness to hormone therapy (32, 33), however, a firm evidence that these polymorphisms can be used as genetic markers to identify responders to hormonal therapy or patients likely to develop hormonal resistance is still lacking. A major limitation of the past studies was the fact that they did not take into consideration the haplotype conformation of both SNPs in each patient, whereas we demonstrated this is likely to be most relevant compared with each single polymorphism. The present study may have a significant impact in the generation of novel clinically useful markers. Our results provide the molecular basis for the changes in the receptor status that patients may experience during tumor progression in metastatic disease, changes that significantly influence patient survival (15). The possibility to develop the analysis of nuclear transcripts into clinically useful biomarkers for metastatic patients has to be carefully evaluated through a systematic study involving a sufficiently large number of patients and the normalization of a number of expected confounders, including tumor stage, haplotype, number of proliferating cells and level of c-MYB in the neoplastic tissue. Notwithstanding these confounders, the preliminary inspection made by sorting the patient samples with a decreasing pausing ratio (SI Appendix, Table S1), allowed to observe an inverse correlation of the TLI (thymidine labeling index) and pausing in 10 of 13 samples where this index was available (SI Appendix, Table S5). This preliminary evidence is certainly encouraging a more in depth investigation of the primary transcripts and pausing in a wider collection of breast cancer cases aimed at establishing their relation with the proliferation of cancer cells as well as their ability to predict a hormone refractory phenotype. Our data also provide a possible explanation of decades of immunohistochemistry observations showing that ERα positive cells in breast tumor specimen are quite variable (1–100%) and that clinical responses to hormonal therapies can be demonstrated in patients with tumors presenting as few as 1–10% of weakly ERα-positive cells. Multiple explanations were proposed to account for the variability of ERα expression observed in breast cancers, including differences in the subclones originated by the tumor originating cells (cancer stem cells) or the clonal selection mechanism intervening during tumor formation (34). Our results indicate that cellular heterogeneity, might be due, at least in part, to the presence of different number of cells in the S-phase of the cell cycle in the histological samples. In favor of this hypothesis, several studies showed a substantial lack of colocalization between S-phase markers and ERα expression in mouse (35), rat (36), bovine (37), and human tissues (38). Because immunohistochemistry analysis offers a snapshot image of the tumor cells, we may conclude that the technique is likely underestimating the number of ERα positive cells limiting the counts to those cells that are not in S-phase. Future studies should re-evaluate ERα immunodetections as a tumor marker in light of the results of the present study. Finally, it is expected that the identification of the key factors underlying the mechanism of ERα instability during breast cancer progression may provide also a new impulse in the development of therapeutics aimed at sensitizing hormone refractory cancers.
Methods
Run-On Assay.
Cells (50 × 106) were incubated for 5 min in a lysis buffer (10 mM Tris⋅HCl, pH 7.4, 3 mM MgCl2, 0.5% Nonidet P-40, and 10 mM NaCl) and nuclei were pelleted by microfuge centrifugation. Nuclear run-on assays were performed as described (39). Four-h prehybridization and 24-h hybridization were carried on in Church and Gilbert’s solution at 72 °C; 2 × 10⁶ cpm/mL were used in the hybridization reaction. After two washes of 45 min at 72 °C in a solution containing 40 mM NaHP0, 1% SDS, and 1 mM EDTA, filters were exposed to autoradiographic films. Details concerning the run on probes can be found in SI Appendix, Methods.
Real-Time PCR for Amplification and Quantitation of the Primary ERα Transcripts.
Templates were amplified using the TAQMAN Universal PCR amplification kit (Applied Biosystems) in a thermocycler (ABI Prism 7000, Applied Biosystems). The level of intron 1 amplicons reported in Fig. 2 B and C were normalized on the constitutively expressed gene 36B4 and on primer/probe efficiency using the 2-ΔΔCt method. Absolute quantification of the primary transcripts shown in Figs. 2 D and E and 6B and SI Appendix, Fig. S2 was carried out using the standard curve procedure according to the manufacturer guidelines (Applied Biosystems). Both 5′-SNP and end amplicons showed a linear trend down to 10–100 copy of template (SI Appendix, Fig. S2). Primers, probes and the plasmid used in the assay are detailed in the SI Appendix, Methods.
Allele-Specific Transcription.
The protocol for monitoring allele-specific transcription was developed from a preset SNP genotyping assay (Applied Biosystems). Template cDNAs were obtained by random primer retro-transcription of 0.1 μg of total RNA. The ratio of allele-specific cDNAs was determined by using the 2-ΔΔCt method and standardized on efficiency of the two TAQMAN probes used to detect each allele.
Chromatin Immunoprecipitation.
ChIP were carried out as described. MCF-7 cells were incubated in 1% of formaldehyde for 10 min at 22 °C, and the reaction was stopped with 0.125 M glycine. Sonicated chromatin was incubated with 4 µg of anti-HA (Roche 1583816), anti-MYB (Millipore 05–175), anti-total Pol II (Santa Cruz Biotechnology), anti-phosphorylated isoforms of Ser5 and Ser2 of the CTD (Abcam), and 4 µg of mouse IgG (Upstate 12–371) as negative control. For PCR analysis, 1 µL of template in 30 µL of total reaction were used. PCR was performed with HOT-MASTER Taq (Eppendorf). Primers used for real-time PCR amplifications are listed in SI Appendix, Methods.
Human Tumors.
All human tumor specimens were obtained in accordance with the Independent Ethics Committee (CEI) of the “Fondazione IRCCS Istituto Nazionale dei Tumori,” Milan, Italy and the main tumor features are listed in SI Appendix, Tables S1–S3.
Genotyping.
Genomic DNA from cell lines, human endometrial and breast tissues were genotyped with the SNPs genotyping assay (Applied Biosystems) and haplotypes were determined by restriction enzyme analysis of PCR-amplified DNA fragments from genomic DNAs.
Statistical Analysis.
Statistical significance of differences between means was determined applying Student t test or ANOVA followed by Bonferroni’s test.
Additional methods can be found in SI Appendix, Methods.
Supplementary Material
Acknowledgments
We thank Prof. T. Gonda for kindly providing us with the shMYB vector; F. Zagari, A. Brusadelli, M. Rebecchi, and C. Meda for technical assistance; and E. Tragni for the help with the statistical analysis. This work was supported by Italian Association for Cancer Research IG Grants 11903 (to P.C.), IG-13234 and MFAG-11752 (to G.P.), CARIPLO Foundation Project 2009-2439 (to P.C.), and EPITRON Project LSHC CT 2005 512146 (to A.M.).
Footnotes
The authors declare no conflict of interest.
This article is a PNAS Direct Submission.
This article contains supporting information online at www.pnas.org/lookup/suppl/doi:10.1073/pnas.1321750111/-/DCSupplemental.
References
- 1.Hill SM, Fuqua SAW, Chamness GC, Greene GL, McGuire WL. Estrogen receptor expression in human breast cancer associated with an estrogen receptor gene restriction fragment length polymorphism. Cancer Res. 1989;49(1):145–148. [PubMed] [Google Scholar]
- 2.Boyapati SM, et al. Polymorphisms in ER-α gene interact with estrogen receptor status in breast cancer survival. Clin Cancer Res. 2005;11(3):1093–1098. [PubMed] [Google Scholar]
- 3.Ryan J, et al. Hormone treatment, estrogen receptor polymorphisms and mortality: A prospective cohort study. PLoS ONE. 2012;7(3):e34112. doi: 10.1371/journal.pone.0034112. [DOI] [PMC free article] [PubMed] [Google Scholar]
- 4.Wedrén S, et al. Oestrogen receptor alpha gene haplotype and postmenopausal breast cancer risk: A case control study. Breast Cancer Res. 2004;6(4):R437–R449. doi: 10.1186/bcr811. [DOI] [PMC free article] [PubMed] [Google Scholar]
- 5.Parl FF, Cavener DR, Dupont WD. Genomic DNA analysis of the estrogen receptor gene in breast cancer. Breast Cancer Res Treat. 1989;14(1):57–64. doi: 10.1007/BF01805976. [DOI] [PubMed] [Google Scholar]
- 6.Andersen TI, et al. Oestrogen receptor (ESR) polymorphisms and breast cancer susceptibility. Hum Genet. 1994;94(6):665–670. doi: 10.1007/BF00206961. [DOI] [PubMed] [Google Scholar]
- 7.Cai Q, et al. Genetic polymorphisms in the estrogen receptor α gene and risk of breast cancer: Results from the Shanghai Breast Cancer Study. Cancer Epidemiol Biomarkers Prev. 2003;12(9):853–859. [PubMed] [Google Scholar]
- 8.van Duijnhoven FJ, et al. Polymorphisms in the estrogen receptor α gene and mammographic density. Cancer Epidemiol Biomarkers Prev. 2005;14(11 Pt 1):2655–2660. doi: 10.1158/1055-9965.EPI-05-0398. [DOI] [PubMed] [Google Scholar]
- 9.Weel AE, et al. Estrogen receptor polymorphism predicts the onset of natural and surgical menopause. J Clin Endocrinol Metab. 1999;84(9):3146–3150. doi: 10.1210/jcem.84.9.5981. [DOI] [PubMed] [Google Scholar]
- 10.Weiderpass E, et al. Estrogen receptor α gene polymorphisms and endometrial cancer risk. Carcinogenesis. 2000;21(4):623–627. doi: 10.1093/carcin/21.4.623. [DOI] [PubMed] [Google Scholar]
- 11.Suzuki K, et al. Genetic polymorphisms of estrogen receptor alpha, CYP19, catechol-O-methyltransferase are associated with familial prostate carcinoma risk in a Japanese population. Cancer. 2003;98(7):1411–1416. doi: 10.1002/cncr.11639. [DOI] [PubMed] [Google Scholar]
- 12.Herrington DM, et al. Common estrogen receptor polymorphism augments effects of hormone replacement therapy on E-selectin but not C-reactive protein. Circulation. 2002;105(16):1879–1882. doi: 10.1161/01.cir.0000016173.98826.88. [DOI] [PubMed] [Google Scholar]
- 13.Yaich L, Dupont WD, Cavener DR, Parl FF. Analysis of the PvuII restriction fragment-length polymorphism and exon structure of the estrogen receptor gene in breast cancer and peripheral blood. Cancer Res. 1992;52(1):77–83. [PubMed] [Google Scholar]
- 14.Maruyama H, et al. Lack of an association of estrogen receptor alpha gene polymorphisms and transcriptional activity with Alzheimer disease. Arch Neurol. 2000;57(2):236–240. doi: 10.1001/archneur.57.2.236. [DOI] [PubMed] [Google Scholar]
- 15.Lindström LS, et al. Clinically used breast cancer markers such as estrogen receptor, progesterone receptor, and human epidermal growth factor receptor 2 are unstable throughout tumor progression. J Clin Oncol. 2012;30(21):2601–2608. doi: 10.1200/JCO.2011.37.2482. [DOI] [PubMed] [Google Scholar]
- 16.Hah N, et al. A rapid, extensive, and transient transcriptional response to estrogen signaling in breast cancer cells. Cell. 2011;145(4):622–634. doi: 10.1016/j.cell.2011.03.042. [DOI] [PMC free article] [PubMed] [Google Scholar]
- 17.Jakesz R, et al. Influence of cell proliferation and cell cycle phase on expression of estrogen receptor in MCF-7 breast cancer cells. Cancer Res. 1984;44(2):619–625. [PubMed] [Google Scholar]
- 18.Dong XF, Berthois Y, Colomb E, Martin PM. Cell cycle phase dependence of estrogen and epidermal growth factor (EGF) receptor expression in MCF-7 cells: Implications in antiestrogen and EGF cell responsiveness. Endocrinology. 1991;129(5):2719–2728. doi: 10.1210/endo-129-5-2719. [DOI] [PubMed] [Google Scholar]
- 19.Rostagno P, Moll JL, Birtwisle-Peyrottes I, Ettore F, Caldani C. Cell cycle expression of estrogen receptors determined by image analysis on human breast cancer cells in vitro and in vivo. Breast Cancer Res Treat. 1996;39(2):147–154. doi: 10.1007/BF01806181. [DOI] [PubMed] [Google Scholar]
- 20.Tanno B, et al. Expression of Slug is regulated by c-Myb and is required for invasion and bone marrow homing of cancer cells of different origin. J Biol Chem. 2010;285(38):29434–29445. doi: 10.1074/jbc.M109.089045. [DOI] [PMC free article] [PubMed] [Google Scholar]
- 21.Drabsch Y, et al. Mechanism of and requirement for estrogen-regulated MYB expression in estrogen-receptor-positive breast cancer cells. Proc Natl Acad Sci USA. 2007;104(34):13762–13767. doi: 10.1073/pnas.0700104104. [DOI] [PMC free article] [PubMed] [Google Scholar]
- 22.Guérin M, Sheng ZM, Andrieu N, Riou G. Strong association between c-myb and oestrogen-receptor expression in human breast cancer. Oncogene. 1990;5(1):131–135. [PubMed] [Google Scholar]
- 23.Thorner AR, Parker JS, Hoadley KA, Perou CM. Potential tumor suppressor role for the c-Myb oncogene in luminal breast cancer. PLoS ONE. 2010;5(10):e13073. doi: 10.1371/journal.pone.0013073. [DOI] [PMC free article] [PubMed] [Google Scholar]
- 24.Jiang SY, Jordan VC. Growth regulation of estrogen receptor-negative breast cancer cells transfected with complementary DNAs for estrogen receptor. J Natl Cancer Inst. 1992;84(8):580–591. doi: 10.1093/jnci/84.8.580. [DOI] [PubMed] [Google Scholar]
- 25.Lee Y, Renaud RA, Friedrich TC, Gorski J. Estrogen causes cell death of estrogen receptor stably transfected cells via apoptosis. J Steroid Biochem Mol Biol. 1998;67(4):327–332. doi: 10.1016/s0960-0760(98)00128-9. [DOI] [PubMed] [Google Scholar]
- 26.Klotz DM, et al. Requirement of estrogen receptor-α in insulin-like growth factor-1 (IGF-1)-induced uterine responses and in vivo evidence for IGF-1/estrogen receptor cross-talk. J Biol Chem. 2002;277(10):8531–8537. doi: 10.1074/jbc.M109592200. [DOI] [PubMed] [Google Scholar]
- 27.Fu L, Lee CC. The circadian clock: Pacemaker and tumour suppressor. Nat Rev Cancer. 2003;3(5):350–361. doi: 10.1038/nrc1072. [DOI] [PubMed] [Google Scholar]
- 28.Guillaumond F, Dardente H, Giguère V, Cermakian N. Differential control of Bmal1 circadian transcription by REV-ERB and ROR nuclear receptors. J Biol Rhythms. 2005;20(5):391–403. doi: 10.1177/0748730405277232. [DOI] [PubMed] [Google Scholar]
- 29.Cai W, et al. Expression levels of estrogen receptor β are modulated by components of the molecular clock. Mol Cell Biol. 2008;28(2):784–793. doi: 10.1128/MCB.00233-07. [DOI] [PMC free article] [PubMed] [Google Scholar]
- 30.Cesi V, et al. TGFβ-induced c-Myb affects the expression of EMT-associated genes and promotes invasion of ER+ breast cancer cells. Cell Cycle. 2011;10(23):4149–4161. doi: 10.4161/cc.10.23.18346. [DOI] [PubMed] [Google Scholar]
- 31.Imayoshi I, et al. Oscillatory control of factors determining multipotency and fate in mouse neural progenitors. Science. 2013;342(6163):1203–1208. doi: 10.1126/science.1242366. [DOI] [PubMed] [Google Scholar]
- 32.Herrington DM, et al. Estrogen-receptor polymorphisms and effects of estrogen replacement on high-density lipoprotein cholesterol in women with coronary disease. N Engl J Med. 2002;346(13):967–974. doi: 10.1056/NEJMoa012952. [DOI] [PubMed] [Google Scholar]
- 33.Jin Y, et al. Estrogen receptor genotypes influence hot flash prevalence and composite score before and after tamoxifen therapy. J Clin Oncol. 2008;26(36):5849–5854. doi: 10.1200/JCO.2008.16.8377. [DOI] [PMC free article] [PubMed] [Google Scholar]
- 34.Rivenbark AG, O’Connor SM, Coleman WB. Molecular and cellular heterogeneity in breast cancer: Challenges for personalized medicine. Am J Pathol. 2013;183(4):1113–1124. doi: 10.1016/j.ajpath.2013.08.002. [DOI] [PMC free article] [PubMed] [Google Scholar]
- 35.Zeps N, Bentel JM, Papadimitriou JM, D’Antuono MF, Dawkins HJ. Estrogen receptor-negative epithelial cells in mouse mammary gland development and growth. Differentiation. 1998;62(5):221–226. doi: 10.1046/j.1432-0436.1998.6250221.x. [DOI] [PubMed] [Google Scholar]
- 36.Sivaraman L, et al. Early exposure of the rat mammary gland to estrogen and progesterone blocks co-localization of estrogen receptor expression and proliferation. J Endocrinol. 2001;171(1):75–83. doi: 10.1677/joe.0.1710075. [DOI] [PubMed] [Google Scholar]
- 37.Capuco AV, Ellis S, Wood DL, Akers RM, Garrett W. Postnatal mammary ductal growth: Three-dimensional imaging of cell proliferation, effects of estrogen treatment, and expression of steroid receptors in prepubertal calves. Tissue Cell. 2002;34(3):143–154. doi: 10.1016/s0040-8166(02)00024-1. [DOI] [PubMed] [Google Scholar]
- 38.Clarke RB, Howell A, Potten CS, Anderson E. Dissociation between steroid receptor expression and cell proliferation in the human breast. Cancer Res. 1997;57(22):4987–4991. [PubMed] [Google Scholar]
- 39.Ciana P, et al. Estrogen receptor α, a molecular switch converting transforming growth factor-α-mediated proliferation into differentiation in neuroblastoma cells. J Biol Chem. 2003;278(34):31737–31744. doi: 10.1074/jbc.M301525200. [DOI] [PubMed] [Google Scholar]
Associated Data
This section collects any data citations, data availability statements, or supplementary materials included in this article.


