

Abstract
Fluorogenic probes that are activated by an enzymatic transformation are ideally suited for profiling enzyme activities in biological systems. Here, we describe two fluorogenic enzyme probes, 3-O-methylfluorescein-sulfate and resorufin-sulfate, that can be used to detect sulfatases in mycobacterial lysates. Both probes were validated with a set of commercial sulfatases and used to reveal species specific sulfatase banding patterns in a gel-resolved assay of mycobacterial lysates. The fluorogenic probes described here are suitable for various assays, and provide a starting point for creating new sulfatase probes with improved selectivity for mycobacterial sulfatases.
Keywords: sulfatase, fluorescent probe, Mycobacterium tuberculosis, protein imaging, hydrolase
Fluorogenic probes targeting distinct enzyme classes are powerful tools for applications ranging from enzyme assays to therapeutic screens.[1] Enzyme probes can be used to assign function and substrate specificity to uncharacterized proteins, which is particularly useful for pathogens like Mycobacterium tuberculosis (M. tuberculosis) that have a high proportion of unannotated genes.[2] Already, fluorogenic enzyme probes have made an impact in the development of diagnostics for detection of M. tuberculosis. For example, cephalosporin-based fluorogenic probes activated by the M. tuberculosis β-lactamase, BlaC, have been used to detect infections in mice[3] and in sputum samples.[4] Second-generation BlaC-activated probes[4] appear to offer enhanced specificity for M. tuberculosis β-lactamase over the many other β-lactamases encoded by other gram negative bacteria.[5]
Sulfatases are a class of enzyme that are genetically conserved across the different mycobacterial species that cause tuberculosis.[6] We recently reported on the use of fluorogenic probes to examine mycobacterial sulfatase activity in a variety of species and strains.[7] In that work, we developed a new fluorogenic probe, 7-hydroxy-9H-(1,3-dichloro-9,9-dimethylacridin-2-one)(DDAO)-sulfate, which was used to detect sulfatase activity in protein gel-resolved mycobacterial lysates. The assay revealed that mycobacteria have distinct sulfatase activity patterns, or “fingerprints”. DDAO-sulfate, and the new fluorogenic sulfatase probes described here, could be used to further elucidate sulfatase function and regulation.
Beyond DDAO-sulfate, there is just one other type of fluorogenic probe that has been reported for detecting sulfatase activity, the coumarin derivatives [e..g, 4-methylumbelliferyl sulfate (4-MUS), 4-methylumbelliferyl sulfamate, and closely related analogues].[8] This limited repertoire stands in contrast to the many fluorogenic probes that have been developed for detection of proteases,[9] phosphatases,[10] esterases,[11] β-lactamases,[3–4, 12] and glycosidases.[13] The hydrolysis product of 4-MUS and DDAO-sulfate, 4-methylumbelliferone (4-MU; λmax = 360, λemit = 450 nm) and DDAO (λmax = 600, λemit = 660 nm), respectively, enable fluorescence detection at the extreme ends of the visible spectrum; these products cannot be detected on many low-cost instruments. Therefore, we sought to expand the spectrum of sulfatase-activated probes to allow greater flexibility for enzyme assays and multicolor imaging. We surveyed the existing fluorophore scaffolds and decided to target fluorescein and resorufin, two bright fluorescent probes. These fluorophore scaffolds excite and emit in the middle of the visible range, which broadens their applicability by enabling them to be detected on most plate readers, gel imagers, and standard fluorescence microscopes.
Most fluorogenic fluoresceins require two sequential hydrolysis steps to produce the bright fluorescent parent fluorophore.[10b, 10c, 11a] In contrast, 3-O-methylfluorescein (MF; λmax = 472 nm, λemit = 510 nm, Φ = 0.45) is an enhanced xanthene that can be locked in a non-fluorescent lactone form through a single modification (Scheme 1). Fluorogenic MF derivatives have been used to assay proteases[9b] and phospholipase,[14] but not sulfatases. A few sulfated fluoresceins have been reported as fluorogenic substrates, but were only utilized as a phosphate isostere in phosphatase assays (e.g., to examine phosphatase inhibition).[10b, 10c]
Scheme 1.
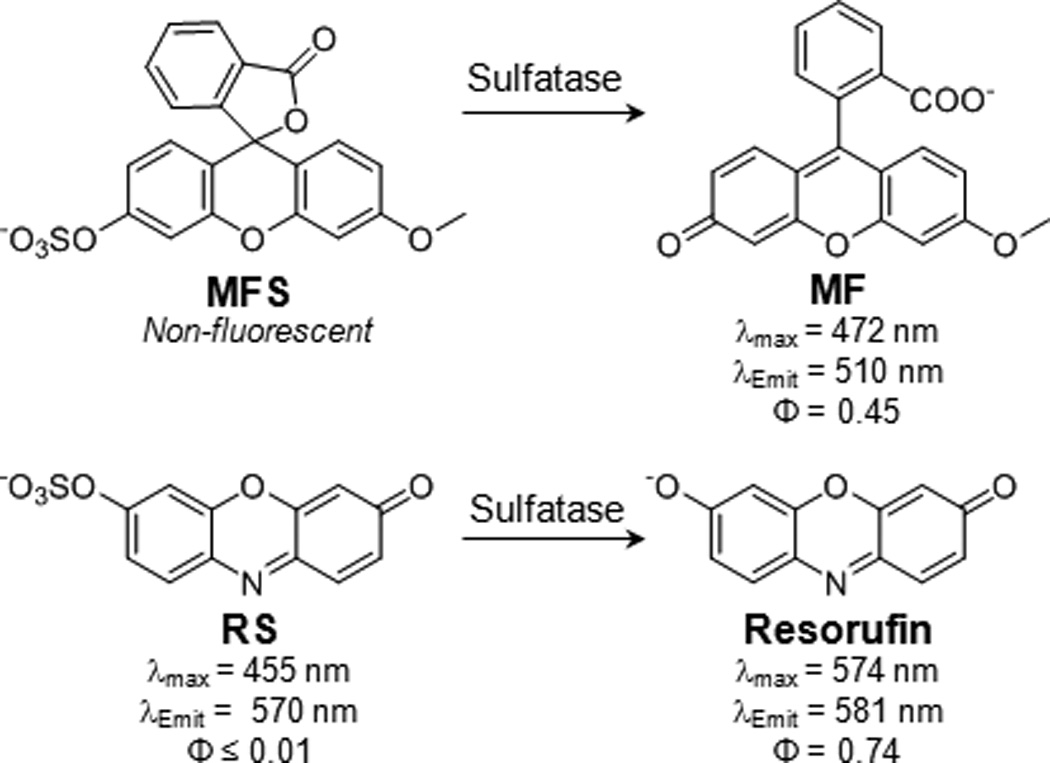
Sulfatase-catalyzed hydrolysis of MFS and RS forms bright fluorescent products. MFS is non-fluorescent before hydrolysis to give MF, a product with a fluorescence quantum yield (Φ) of 0.45. RS is effectively non-fluorescent (Φ ≤ 0.01) before hydrolysis to produce resorufin (Φ = 0.74).
Resorufin (λmax = 574 nm, λemit = 581 nm, Φ = 0.74[15]) is red-shifted compared to MF and has a high fluorescence quantum yield. Fluorogenic resorufin substrates have been developed for several hydrolases, including esterases[11a, 16] and glycosidases.[13b] Moreover, resorufin has been used to monitor sulfotransferase activity. Beckmann found that sulfation of resorufin by a phenol sulfotransferase resulted in a loss of fluorescence.[17] The sulfation product was not isolated or characterized, but was proposed to be resorufin-sulfate (RS). Beckmann suggested that sulfatase activity could be monitored by the reverse reaction, namely starting with sulfated resorufin and measuring the sulfatase-catalyzed hydrolysis to form resorufin, but this was not subsequently explored.
Here, we report the synthesis of two fluorogenic substrates for detecting sulfatase activity: 3-O-methylfluorescein-sulfate (MFS) and RS (Scheme 1). We validated both MFS and RS with commercial sulfatases and mycobacterial lysates, and then applied these probes in a protein gel assay to examine sulfatase activity with a panel of mycobacterial pathogens.
We synthesized MFS from MF in one step by sulfation of the phenol with sulfur trioxide trimethylamine (see Supporting Information for experimental details). MFS was colorless and non-fluorescent, as expected for the spirolactonized compound.[18] In contrast, MF had a fluorescence quantum yield of 0.45 and bright green fluorescence (see Scheme 1 and Figure S5). The large change in quantum yield upon hydrolysis makes MFS an exceptionally high contrast “turn-on” probe. The stability of MFS in the absence of enzyme was determined by monitoring the formation of MF over time in Tris buffer (pH 7.5) at 37 °C. After 40 hours, only 0.04% of MFS was hydrolyzed to form MF (see Figure S7).
We validated MFS as a sulfatase substrate using three commercial sulfatase sources: Aerobacter aerogenes, Helix pomatia, and abalone entrails (Table 1). Sulfatase activity from A. aerogenes was evaluated at 37 °C in Tris buffer (pH 7.5). The Vmax for MFS was determined to be 1.25 ± 0.08 pmoles/sec, and the KM was 598 ± 67 µM. This was broadly comparable to this enzyme’s KM for other substrates, including DDAO-sulfate (164 ± 14 µM),[7] p-nitrophenyl sulfate (p-NPS; 1800 ± 120 µM),[19] and 4-MUS (700 ± 160 µM).[19]
Table 1.
Kinetic parameters for MFS.
| Enzyme Source |
Aerobacter aerogenes[a] |
Helix pomatia[b] |
Abalone Entrails[b,c] |
|---|---|---|---|
| KM (µM) | 598 ± 67 | 24.8 ± 2.2 | 1070 ± 420 |
| Vmax (pmoles/sec) | 1.25 ± 0.08 | 6.9 ± 0.2 | 10.4 ± 3.3 |
| Vmax/KM (nL/sec) | 2.10 | 277 | 9.74 |
Assay was performed in Tris buffer (pH 7.5) at 37 °C.
Assay was performed in potassium acetate buffer (pH 5.0) at 37 °C.
Inhibition was observed (Ki = 770 ± 370 µM).
The enzymatic hydrolysis of MFS was further evaluated at an acidic pH, which is optimal for sulfatases from H. pomatia and abalone entrails. The formation of MF was monitored in real time at 37 °C in potassium acetate buffer (pH 5.0); hydrolysis of MFS in the absence of enzyme was negligible. With H. pomatia, the Vmax for MFS was determined to be 6.9 ± 0.2 pmoles/sec, and the KM was 24.8 ± 2.2 µM. This is similar to the reported KM value for DDAO-sulfate (13 ± 3 µM).[7] With abalone entrails, the Vmax was 10.4 ± 3.3 pmoles/sec, and the KM value was 1070 ± 420 µM. With this sulfatase source, substrate inhibition was observed (Ki = 770 ± 370 µM). The KM for DDAO-sulfate was 29 ± 3 µM for abalone entrails.[7] From the in vitro kinetic assays, we conclude that MFS is a versatile substrate that can be used to monitor sulfatase activity in a range of conditions, including low pH.
We next sought to synthesize a fluorogenic substrate based on resorufin. We synthesized RS, which is blue-shifted and dark (λmax = 455, λemit = 570 nm, Φ ≤ 0.01) compared to resorufin (see Scheme 1 and Figure S6). Similar to MFS, RS is a favorable turn-on probe due to its large change in quantum yield upon hydrolysis to form resorufin. The conversion of RS to form resorufin in the absence of enzyme was negligible in Tris buffer (pH 7.5) at 37 °C. After 40 hours, only 0.05% of RS was hydrolyzed (see Figure S7). Thus, RS offers a similarly high hydrolytic stability as MFS.
We determined the kinetic parameters of RS with three sulfatases (Table 2). Hydrolysis by A. aerogenes (KM = 162 ± 10 µM, Vmax = 10.1 ± 0.2 pmoles/sec) was monitored at pH 7.5, while conversion by H. pomatia (KM = 17.5 ± 0.9 µM, Vmax = 5.00 ± 0.06 pmoles/sec) and abalone entrails (KM = 131 ± 11 µM, Vmax = 2.72 ± 0.09 pmoles/sec) was monitored at pH 5.0. At either pH value, the background hydrolysis was negligible in the absence of sulfatase.
Table 2.
Kinetic parameters for RS.
| Enzyme Source |
Aerobacter aerogenes[a] |
Helix pomatia[b] |
Abalone Entrails[b] |
|---|---|---|---|
| KM (µM) | 162 ± 10 | 17.5 ± 0.9 | 131 ± 11 |
| Vmax (pmoles/sec) | 10.1 ± 0.2 | 5.00 ± 0.06 | 2.72 ± 0.09 |
| Vmax/KM (nL/sec) | 62.4 | 285 | 20.8 |
Assay was performed in Tris buffer (pH 7.5) at 37 °C.
Assay was performed in potassium acetate buffer (pH 5.0) at 37 °C.
We used A. aerogenes sulfatase to determine the detection limit for various fluorogenic (MFS, RS, DDAO-sulfate, 4-MUS) or colorimetric (p-NPS and 4-nitrocatechol sulfate) probes. The detection limit was evaluated at saturating probe concentration (i.e., at a concentration twice the KM). Each probe was incubated in Tris buffer (pH 7.5) at 37 °C with varying amounts of sulfatase (0.315 to 1580 ng), and the signal from hydrolyzed probe was measured at two time points: 10 min and 3 h (Table S1). At 10 min, RS, 4-MUS, and p-NPS were the most sensitive probes and detected 15.8 ng of sulfatase (Figure S11). MFS and 4-nitrocatechol sulfate required 158 ng for detection, and DDAO-sulfate had the highest detection limit (315 ng).
After a 3 h incubation with A. aerogenes sulfatase, the detection limits had improved 5- to 20-fold for all probes: RS (1.58 ng), 4-MUS (3.15 ng), p-NPS (1.58 ng), MFS (31.5 ng), 4-nitrocatechol sulfate (31.5 ng) and DDAO-sulfate (15.8 ng) (Figure S12). Although all of the probes could detect low nanogram quantities of A. aerogenes sulfatase, these results do highlight the high sensitivity offered by RS. It is worth noting that the high pKa of 4-MU (pKa = 7.8), p-nitrophenol (pKa = 7.2), and 4-nitrocatechol (pKa = 6.9) precludes their use in continuous assays at low pH. In contrast, the low pKa values for resorufin (pKa = 5.8), MF (pKa = 4.8) and DDAO (pKa = 5.0) improve their versatility because many sulfatases are most active at acidic pH, including lysosomal sulfatases[20] and sulfatases from H. pomatia and abalone entrails.
We recently described a new assay for mycobacterial strain assignment based on patterns of sulfatase activity revealed by hydrolysis of DDAO-sulfate.[7] In the current work, we used this assay to detect sulfatase activities in a set of mycobacterial species using MFS, RS, and DDAO-sulfate. We examined lysates from Mycobacterium marinum, Mycobacterium intracellulare, Mycobacterium flavescens, Mycobacterium peregrinum, Mycobacterium nonchromogenicum, Mycobacterium bovis (bacillus Calmette-Guérin, BCG), Mycobacterium avium, and three strains of M. tuberculosis (H37Rv, CDC1551, and Erdman). Three identically prepared native protein gels were used to resolve lysates before incubation for less than 10 min with each sulfatase probe. Each gel was imaged on a fluorescence scanner to reveal fluorescent banding patterns dependent on species- and strain-specific sulfatase activity (Figure 1). Application of DDAO-sulfate demonstrated that all of the examined mycobacterial species had active sulfatases, although the observed activity in M. peregrinum was low. Hydrolyzed MFS was not detected in lanes containing resolved M. tuberculosis lysates (Figure 1A, lanes 8-10), but the other seven species produced detectable MF bands. For RS, every species except M. peregrinum had sulfatase activity that could be detected. However, RS produced fewer bands than DDAO- sulfate. For example, in the resolved M. tuberculosis (Erdman) lysate (lane 10), DDAO-sulfate is hydrolyzed by a Type III sulfatase,[21] ZnSulf-B,[7] to produce a distinctive band at a low apparent molecular weight, but this activity could not be detected by incubation with RS or MFS. The lowest sulfatase band produced by M. flavescens (lane 3) and M. nonchromogenicum (lane 5) was also not visible for gels exposed to RS or MFS. It is interesting to note that the banding pattern for M. avium sulfatases (lane 7) was altered for the gel exposed to RS compared to the other two sulfated probes. The intensity of the lower sulfatase band was greater than the higher band following incubation with RS, while the opposite pattern was observed for MFS and DDAO-sulfate. For this species, DDAO-sulfate produced three total bands while RS and MFS each produced two.
Figure 1.
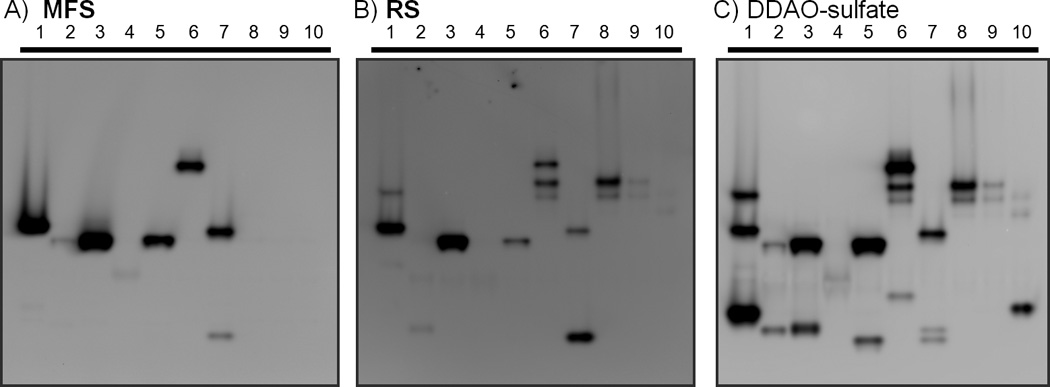
Sulfatase-activated fluorophores reveal different patterns of activity. Mycobacterial lysates (10 µg of total protein per lane) from a variety of species were resolved by native protein gel electrophoresis on a gradient gel (4-15%). Each gel was incubated for 7-8 min with 10 µM MFS (A), RS (B), or DDAO-sulfate (C). Gels were imaged to capture signal from each hydrolyzed probe. Lane 1: M. marinum, 2: M. intracellulare, 3: M. flavescens, 4: M. peregrinum, 5: M. nonchromogenicum, 6: M. bovis (BCG), 7: M. avium, 8: M. tuberculosis (H37Rv), 9: M. tuberculosis (CDC1551), 10: M. tuberculosis (Erdman). Select mammalian lysates were also evaluated in this assay; see Figure S13 in the Supporting Information.
Probes that are broadly hydrolyzed by different mycobacterial sulfatases are useful for examining patterns of activity among related pathogens, while more specific probes would be valuable for developing a simple enzyme-specific diagnostic assay. The differences in the sulfatase fingerprints observed with MFS, RS, and DDAO-sulfate might reflect variations in substrate suitability for different mycobacterial sulfatases. The gel-resolved M. tuberculosis sulfatases did not hydrolyze MFS, but could hydrolyze both RS and DDAO-sulfate. It is tempting to speculate that MFS is the least optimal mycobacterial sulfatase substrate due to the added bulk of the benzofuranone moiety on MFS, which is absent in both RS and DDAO-sulfate. Although natural substrates have yet to be identified for the mycobacterial sulfatases, the structural differences among fluorogenic probes could be used to evaluate the specificity of sulfatases in mycobacterial species and strains. For example, our results indicate that the M. tuberculosis sulfatase AtsB[7] can hydrolyze both RS and DDAO-sulfate, but not MFS. The variation in sulfatase activity patterns observed for MFS versus RS could form the basis for developing new fluorogenic probes with improved specificity for a particular sulfatase enzyme.
Mammalian cells express sulfatases[20], which might accept MFS, RS, or DDAO-sulfate as substrates. Using this in-gel assay, we analyzed mammalian cell lysates from five sources (BT549, HEK293, CHO, Rat-1, and Cos-7). Notably, none of the three probes were hydrolyzed by gel-resolved mammalian lysates (see Figure S13). It is unclear whether the mammalian sulfatase activity was lost during sample preparation or if the assay conditions disfavoured the catalysis by mammalian enzymes. The assay was performed in Tris buffer pH 7.5, and many of the mammalian sulfatases have acidic pH optima. Either way, the lack of detectable mammalian sulfatase activity suggests that our assay might be useful for evaluating mycobacterial sulfatase activity in infected macrophages[7] or human sputum samples.
We explored the sensitivity of the in-gel assay for detecting sulfatases using MFS and RS (Figure 2). We imaged fluorescence produced by sulfatases from lysates (10 ng to 10 µg total protein) obtained from six different mycobacterial sources: M. avium, M. bovis (BCG), Mycobacterium kansasii, M. tuberculosis (H37Rv and Erdman), and M. marinum. Following 15 min incubation with 50 µM MFS, sulfatase bands were produced by lysates (10 or 1 µg) from M. avium, M. bovis (BCG), M. kansasii, and M. marinum. No bands were observed for either M. tuberculosis strain at any amount of lysate examined. MFS detected sulfatase activity in as little as 100 ng of M. kansasii or M. marinum lysate. Sulfatase activity could not be detected with MFS in lanes containing 10 ng of lysate (data not shown). Incubation with 25 µM RS for 15 min produced sulfatase bands in 10 μg of M. tuberculosis (Erdman) lysate. RS could detect activity in 10 or 1 μg of lysate from M. avium, M. bovis (BCG), M. kansasii, M. tuberculosis (H37Rv), and M. marinum. It should be noted that as little as 100 ng of lysate produced detectable sulfatase bands from M. avium and M. kansasii, although this low amount of activity could only be observed by adjusting the contrast of the image. RS could not detect sulfatase activity from 10 ng of resolved proteins for any lysates (data not shown). With either MFS or RS, the in-gel assay format was most informative when a larger amount of lysate was resolved, but sulfatase activity could be detected in a small amount of lysate for some species.
Figure 2.
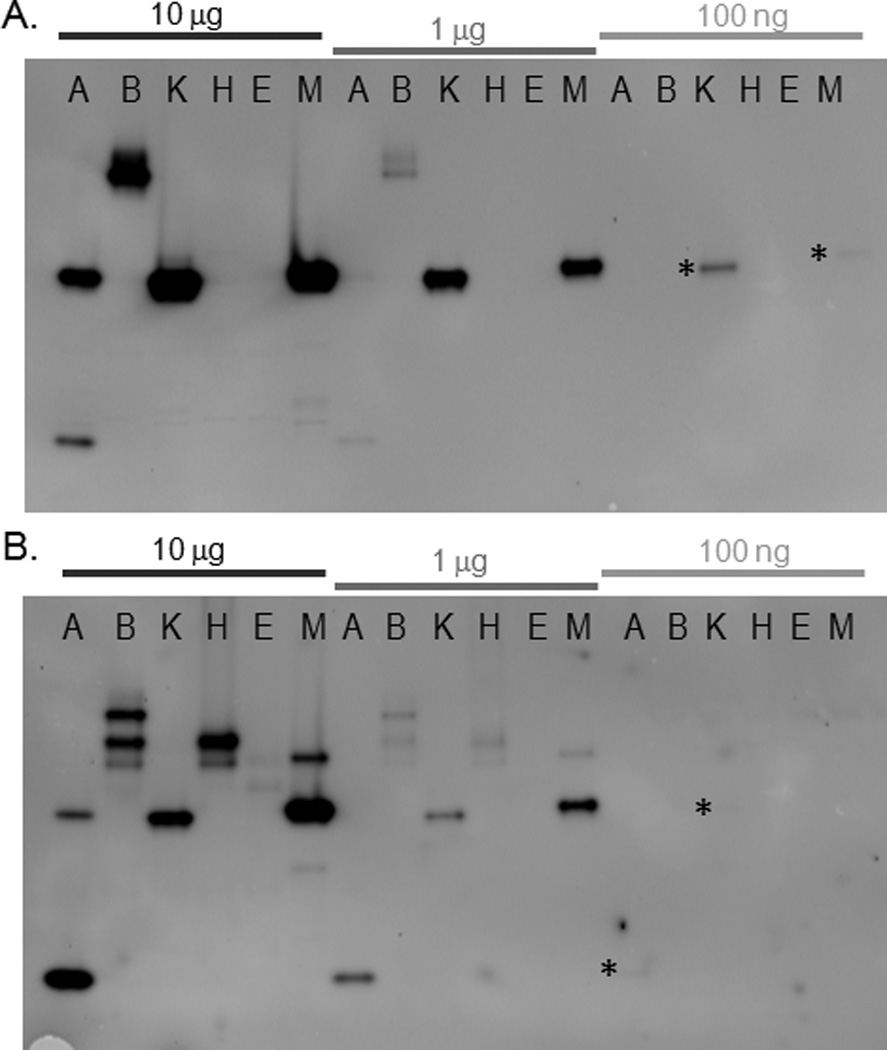
Sensitivity of sulfatase activity detection in mycobacterial lysates. Different amounts of mycobacterial lysates were separated by native gel, followed by incubation for 15 min with (A) MFS (50 µM) or (B) RS (25 µM). For the most faint bands, which were visible upon adjustment of the image contrast, an asterisk (*) is shown to the left of the band location. Lane designations are: A: M. avium; B: M. bovis (BCG); K: M. kansasii; H: M. tuberculosis (H37Rv); E: M. tuberculosis (Erdman); M: M. marinum.
In conclusion, we synthesized and characterized two new fluorogenic probes, MFS and RS, which were used to detect sulfatase activity. MFS is non-fluorescent and RS is effectively non-fluorescent (Φ ≤ 0.01). Following sulfatase hydrolysis, both probes display a dramatic increase in quantum yield, making these two excellent turn-on probes for applications requiring very low background fluorescence. The kinetic parameters for both probes were determined using sulfatases from A. aerogenes, H. pomatia, and abalone entrails. We used A. aerogenes sulfatase to compare the detection limit for hydrolysis of MFS and RS to other known sulfatase substrates in a 96-well plate format. We found that RS was particularly sensitive and could detect at least as little A. aerogenes enzyme as the pre-existing fluorogenic substrate 4-MUS. RS could detect 10- to 20-fold less enzyme than DDAO-sulfate. The detection limit for MFS was higher than RS, and more comparable to the colorimetric substrate 4-nitrocatechol sulfate. Furthermore, we used an in-gel assay format to examine mycobacterial sulfatase activity in gel-resolved lysates and found that each probe could reveal a variety of sulfatases. MFS and RS expand the set of available substrates for evaluating sulfatase activity in a variety of formats.
Experimental Section
Please see the online Supporting Information for detailed experimental protocols for the synthesis and evaluation of MFS and RS and additional data (Table S1 and Figures S1–13).
Supplementary Material
Acknowledgements
We are grateful to Drs. Jason Rush, Matthew Hangauer, Anthony Baldridge, and Benjamin Swarts for valuable discussions. We thank Douglas Fox, Peyton Shieh, and Katie Tallman for critical reading of the manuscript and Prof. Andreas Martin for use of his fluorimeter. Funding was generously provided by an NIH postdoctoral fellowship to K.E.B. (F32CA136109), a Berkeley Fellowship for Graduate Study to E.L.S, and an NIH grant to C.R.B. (AI51622).
Footnotes
Supporting information for this article is available on the WWW under http://dx.doi.org/10.1002/cbic.20xxxxxxx.
References
- 1.a) Puri AW, Bogyo M. ACS Chem. Biol. 2009;4:603–616. doi: 10.1021/cb9001409. [DOI] [PMC free article] [PubMed] [Google Scholar]; b) Grimm JB, Heckman LM, Lavis LD. Prog. Mol. Biol. Transl. Sci. Vol. 113. Academic Press; 2013. pp. 1–34. [DOI] [PubMed] [Google Scholar]
- 2.a) Ansong C, Ortega C, Payne SH, Haft DH, Chauvignè-Hines LM, Lewis MP, Ollodart AR, Purvine SO, Shukla AK, Fortuin S, Smith RD, Adkins JN, Grundner C, Wright AT. Chem. Biol. 2013;20:123–133. doi: 10.1016/j.chembiol.2012.11.008. [DOI] [PMC free article] [PubMed] [Google Scholar]; b) Cravatt BF, Wright AT, Kozarich JW. Annu. Rev. Biochem. 2008;77:383–414. doi: 10.1146/annurev.biochem.75.101304.124125. [DOI] [PubMed] [Google Scholar]
- 3.Kong Y, Yao H, Ren H, Subbian S, Cirillo SLG, Sacchettini JC, Rao J, Cirillo JD. Proc. Natl. Acad. Sci. USA. 2010;107:12239–12244. doi: 10.1073/pnas.1000643107. [DOI] [PMC free article] [PubMed] [Google Scholar]
- 4.Xie H, Mire J, Kong Y, Chang M, Hassounah HA, Thornton CN, Sacchettini JC, Cirillo JD, Rao J. Nat. Chem. 2012;4:802–809. doi: 10.1038/nchem.1435. [DOI] [PMC free article] [PubMed] [Google Scholar]
- 5.Walsh C. Nature. 2000;406:775–781. doi: 10.1038/35021219. [DOI] [PubMed] [Google Scholar]
- 6.a) Bojarová P, Williams SJ. Curr. Opin. Chem. Biol. 2008;12:573–581. doi: 10.1016/j.cbpa.2008.06.018. [DOI] [PubMed] [Google Scholar]; b) Mougous JD, Green RE, Williams SJ, Brenner SE, Bertozzi CR. Chem. Biol. 2002;9:767–776. doi: 10.1016/s1074-5521(02)00175-8. [DOI] [PubMed] [Google Scholar]; c) Schelle MW, Bertozzi CR. ChemBioChem. 2006;7:1516–1524. doi: 10.1002/cbic.200600224. [DOI] [PubMed] [Google Scholar]; d) Zeng L, Shi T, Zhao Q, Xie J. Cell Biochem. Biophys. 2013;65:77–83. doi: 10.1007/s12013-012-9410-x. [DOI] [PubMed] [Google Scholar]
- 7.Beatty KE, Williams M, Carlson BL, Swarts BM, Warren RM, Van Helden PD, Bertozzi CR. Proc. Natl. Acad. Sci. USA. 2013;110:12911–12916. doi: 10.1073/pnas.1222041110. [DOI] [PMC free article] [PubMed] [Google Scholar]
- 8.a) Bilban M, Billich A, Auer M, Nussbaumer P. Bioorg. Med. Chem. Lett. 2000;10:967–969. doi: 10.1016/s0960-894x(00)00144-x. [DOI] [PubMed] [Google Scholar]; b) Ahmed V, Ispahany M, Ruttgaizer S, Guillemette G, Taylor SD. Anal. Biochem. 2005;340:80–88. doi: 10.1016/j.ab.2005.02.007. [DOI] [PubMed] [Google Scholar]; c) Bojarová P, Denehy E, Walker I, Loft K, De Souza DP, Woo LWL, Potter BVL, McConville MJ, Williams SJ. ChemBioChem. 2008;9:613–623. doi: 10.1002/cbic.200700579. [DOI] [PubMed] [Google Scholar]
- 9.a) Funovics M, Weissleder R, Tung CH. Anal. Bioanal. Chem. 2003;377:956–963. doi: 10.1007/s00216-003-2199-0. [DOI] [PubMed] [Google Scholar]; b) Mugherli L, Burchak ON, Chatelain F, Balakirev MY. Bioorg. Med. Chem. Lett. 2006;16:4488–4491. doi: 10.1016/j.bmcl.2006.06.037. [DOI] [PubMed] [Google Scholar]
- 10.a) Leira F, Vieites JM, Vieytes MR, Botana LM. Toxicon. 2000;38:1833–1844. doi: 10.1016/s0041-0101(00)00111-2. [DOI] [PubMed] [Google Scholar]; b) Wang Q, Scheigetz J, Gilbert M, Snider J, Ramachandran C. BBA-Protein Struct. M. 1999;1431:14–23. doi: 10.1016/s0167-4838(99)00042-4. [DOI] [PubMed] [Google Scholar]; c) Scheigetz J, Gilbert M, Zamboni R. Org. Prep. Proced. Int. 1997;29:561–568. [Google Scholar]
- 11.a) Lavis LD, Chao T-Y, Raines RT. Chem. Sci. 2011;2:521–530. doi: 10.1039/C0SC00466A. [DOI] [PMC free article] [PubMed] [Google Scholar]; b) Kim Y, Choi Y, Weissleder R, Tung C-H. Bioorg. Med. Chem. Lett. 2007;17:5054–5057. doi: 10.1016/j.bmcl.2007.07.026. [DOI] [PMC free article] [PubMed] [Google Scholar]
- 12.Xing B, Khanamiryan A, Rao J. J. Am. Chem. Soc. 2005;127:4158–4159. doi: 10.1021/ja042829+. [DOI] [PubMed] [Google Scholar]
- 13.a) Tung CH, Zeng Q, Shah K, Kim DE, Schellingerhout D, Weissleder R. Cancer Res. 2004;64:1579–1583. doi: 10.1158/0008-5472.can-03-3226. [DOI] [PubMed] [Google Scholar]; b) Hofmann J, Sernetz M. Anal. Chim. Acta. 1984;163:67–72. [Google Scholar]
- 14.Zaikova TO, Rukavishnikov AV, Birrell GB, Griffith OH, Keana JFW. Bioconjugate Chem. 2001;12:307–313. doi: 10.1021/bc0001138. [DOI] [PubMed] [Google Scholar]
- 15.Bueno C, Villegas ML, Bertolotti SG, Previtali CM, Neumann MG, Encinas MV. Photochem. Photobiol. 2002;76:385–390. doi: 10.1562/0031-8655(2002)076<0385:tesior>2.0.co;2. [DOI] [PubMed] [Google Scholar]
- 16.Guibault GG, Kramer DN. Anal. Chem. 1965;37:120–123. doi: 10.1021/ac60220a031. [DOI] [PubMed] [Google Scholar]
- 17.Beckmann JD. Anal. Biochem. 1991;197:408–411. doi: 10.1016/0003-2697(91)90412-m. [DOI] [PubMed] [Google Scholar]
- 18.Lavis LD, Rutkoski TJ, Raines RT. Anal. Chem. 2007;79:6775–6782. doi: 10.1021/ac070907g. [DOI] [PMC free article] [PubMed] [Google Scholar]
- 19.Rush JS, Beatty KE, Bertozzi CR. ChemBioChem. 2010;11:2096–2099. doi: 10.1002/cbic.201000115. [DOI] [PMC free article] [PubMed] [Google Scholar]
- 20.Hanson SR, Best MD, Wong CH. Angew. Chem. Int. Edit. 2004;43:5736–5763. doi: 10.1002/anie.200300632. [DOI] [PubMed] [Google Scholar]
- 21.Hagelueken G, Adams TM, Wiehlmann L, Widow U, Kolmar H, Tümmler B, Heinz DW, Schubert W-D. Proc. Natl. Acad. Sci. USA. 2006;103:7631–7636. doi: 10.1073/pnas.0510501103. [DOI] [PMC free article] [PubMed] [Google Scholar]
Associated Data
This section collects any data citations, data availability statements, or supplementary materials included in this article.