Abstract
Despite the long-standing interest of biologists in patterns of correlation and phenotypic integration, little attention has been paid to patterns of correlation across a broad phylogenetic spectrum. We report analyses of mean phenotypic correlations among a variety of linear measurements from a wide diversity of plants and animals, addressing questions about function, development, integration and modularity. These analyses suggest that vertebrates, hemimetabolous insects and vegetative traits in plants have similar mean correlations, around 0.5. Traits of holometabolous insects are much more highly correlated, with a mean correlation of 0.84; this may be due to developmental homeostasis caused by lower spatial and temporal environmental variance during complete metamorphosis. The lowest mean correlations were those between floral and vegetative traits, consistent with Berg's ideas about functional independence between these modules. Within trait groups, the lowest mean correlations were among vertebrate head traits and floral traits (0.38–0.39). The former may be due to independence between skull modules. While there is little evidence for floral integration overall, certain sets of functionally related floral traits are highly integrated. A case study of the latter is described from wild radish flowers.
Keywords: phenotypic correlations, morphological integration, modularity, floral integration, developmental homeostasis, complete metamorphosis
1. Introduction
Interest in patterns of correlation among traits dates back at least to Darwin, who said in On the origin of species [1, p. 143] that correlations are ‘a very important subject, most imperfectly understood’. Olsen & Miller [2] used correlation coefficients to define groups of functionally and developmentally related traits (what were later termed modules) in fossil and extant animals. Berg [3] also focused on adaptive patterns of correlations, but she focused on selection by pollinators for functional independence between floral and vegetative traits, resulting in lower correlations between these two trait groups [4]. Wagner & Altenberg [5] elaborated on the concepts of both functional integration and independence; in agreement with Berg, they concluded that functional independence was more important in the evolution of modularity through a process they termed parcellation. The history and major questions in the field of phenotypic integration have been well reviewed [6–8].
The study of integration and correlation has proceeded on fairly separate taxonomic tracks, with most work on plants and vertebrates [8]. As so often is the case in biology, there has been little comparative work that cuts across these major taxonomic boundaries. This is likely because researchers tend to focus on one set of organisms, but also because it can be methodologically and conceptually difficult to cross broad taxonomic boundaries. Our goal here is to help fill this gap by making broad-scale comparisons of correlation and thus integration across plants, vertebrates and invertebrates. We interpret trait pairs or groups that are more highly correlated than others as more integrated, and groups of traits with higher correlations within than among groups as modules; thus, our definitions of integration and modularity are relative, not absolute. We follow Wagner & Altenberg [5] in defining parcellation as the evolutionary reduction of among-group correlations to create modules.
We focus on morphological integration and modularity by considering only linear dimensions of traits, not masses, meristic traits or phenology. We also consider only raw, uncorrected phenotypic correlations among traits, as these represent the actual relationships among traits in the organisms making up a population; thus, they are very relevant for asking questions about integration, modularity, development and function. Crucially, raw phenotypic correlations among morphological traits are also comparable across disparate studies and organisms and are widely available or easily calculated. There are many other more sophisticated methods for assessing integration [9], and these would be interesting to apply to a broad and deep taxonomic sampling, but it would be difficult to assemble all the raw data that would be necessary to apply these methods.
2. The database
Searches were conducted in Web of Science, Google Scholar and ProQuest, using the keywords ‘phenotypic correlation’, ‘animal phenotypic correlation’, plant phenotypic correlation’ and ‘invertebrate phenotypic correlation’. Because most empirical studies do not focus on correlations and thus do not include these keywords, these searches were not very successful, and most correlations in the database were found by following citations in papers found in these searches or already known to us. We also emailed authors of papers that reported taking multiple linear measurements but did not include correlations to obtain the correlations or data. All pairwise correlations among linear dimensions of morphological traits from 39 published studies plus some unpublished data were included in the database, regardless of whether they were statistically significant or not to minimize bias against smaller values.
Consistent with the history of the study of integration dating back to Olsen & Miller [2], vertebrates are best represented in the database, with 63 species across four classes (table 1). Next best represented are flowering plants, perhaps due to the tradition established by Berg [3], with 36 species from 21 families. There has not been a strong tradition of the study of integration in invertebrates, and these are the least well represented in the database, with only four orders of insects and only one species outside the insects.
Table 1.
Characteristics of the correlation database.
| no. species | no. correlations | no. correlations/species | representation | |
|---|---|---|---|---|
| total | 122 | 2743 | 22.5 | |
| angiosperms | 36 | 975 | 27.1 | 21 families |
| invertebrates | 23 | 719 | 31.3 | bivalves, beetles, flies and true bugs |
| vertebrates | 63 | 1049 | 16.6 | birds, fish, mammals and reptiles |
Mean correlations were calculated using absolute values to focus on the magnitude rather than the sign of the correlations. Taking the absolute values made almost no difference in all but one of the reported means, because the vast majority of correlations within most groups analysed were positive. The one exception is noted in Results; most of the other patterns reported here are even stronger if the absolute values are not used. Standard errors of the mean correlations (s.e.m.) were calculated by dividing the standard deviation of the sample by the square root of the number of species represented in that mean; we report 95% confidence intervals (CIs) estimated as two times the s.e.m. Using the total number of correlations instead of the number of species would have underestimated the s.e.m. due to the lack of independence within the correlation matrix from each study. Using the number of species to calculate the s.e.m. is a conservative measure, given that there were 20 times as many correlations as species in the database (table 1) and the mean-squared correlation across the entire database was 0.27. Therefore, almost three-quarters of the trait variances were independent of each other. Some lack of independence may result from phylogenetic relatedness of species within groups, but this is not likely to be very severe for plants and vertebrates given the large taxonomic diversity of the species included. One potential lack of independence in the invertebrate data is mentioned in Results. The New World monkey skull study by Marroig & Cheverud [10] included 39 traits for 40 species, so this one dataset contained almost 30 000 correlations. To avoid the database being numerically overwhelmed by this one study, we included the 40 species mean correlations, that is, the average of the 741 pairwise correlations among the 39 traits for each species. For all other studies, all correlations among linear morphological traits were included.
3. Results
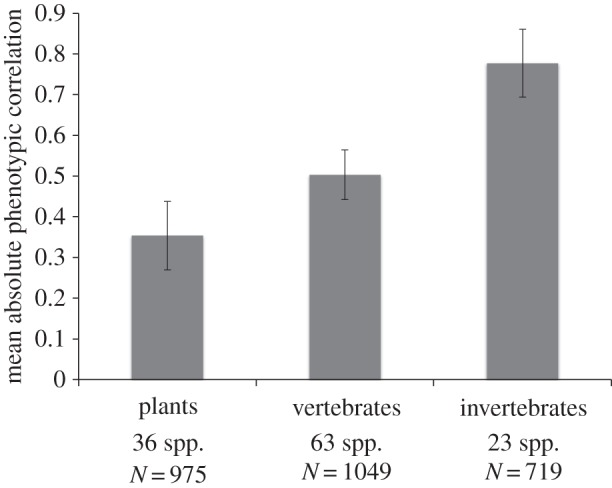
The simplest comparison is between the three major taxonomic groups represented, that is, flowering plants, vertebrates and invertebrates (figure 1). Plants have the lowest overall level of correlation among traits, invertebrates have the highest mean correlation and vertebrates are intermediate. Note that none of the potentially overestimated 95% CIs overlaps among these groups.
Figure 1.

Mean phenotypic correlations (±95% CI) for plants, vertebrates and invertebrates. Number of species and total number of correlations are shown.
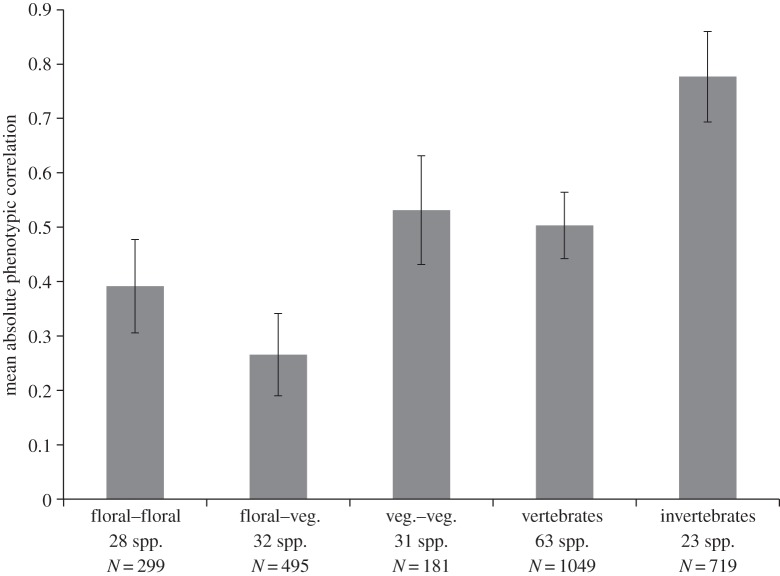
To see whether the parcellation of plants into separate floral and vegetative modules described by Berg [3] contributes to the low level of correlation in plants, we next calculated the mean correlations within each of these two modules plus the cross-module mean correlation (figure 2). The pattern shown by Berg is clear across this much larger and broader dataset (which includes her data), with the cross-module (floral–vegetative) correlations clearly lower than the vegetative correlations, and lower than the floral correlations but with overlapping 95% CIs. The inter-module correlations are the only group in the entire database with substantial numbers of negative values, so that if the raw values are used, the average inter-module correlation is even lower (0.14).
Figure 2.
Mean phenotypic correlations as in figure 1, but with plant correlations split into within-module (floral–floral and vegetative–vegetative) and across-module correlations.
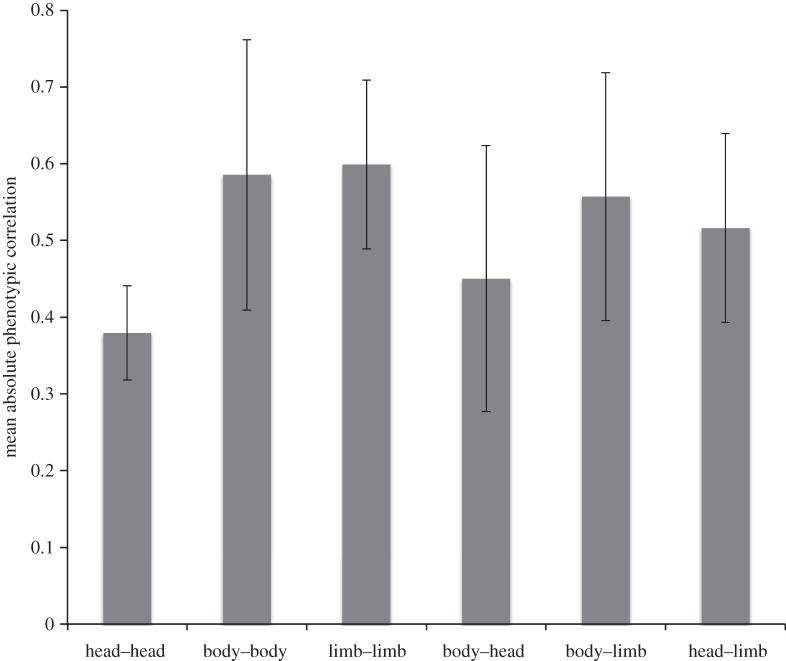
If vertebrates are highly modular then this could explain why vertebrates have lower mean correlation than invertebrates, similar to the lower floral–vegetative correlations in plants. To compare across the diverse vertebrate taxa represented in the database, we divided the traits into head, body and limb (the last does not apply to fishes and snakes). These very broad trait groups do not show evidence of modularity as we defined it in the Introduction, because the within-group correlations are not on average greater than the among-group correlations (figure 3). However, modularity of mammal skull traits has often been discussed [10,11], so the within-head correlations could be lowest because they include lower inter-module correlations. Therefore, despite the lack of modularity in the broad categories used in figure 3, part of the reason that vertebrates have lower correlations than invertebrates could be modularity within the head.
Figure 3.
Mean phenotypic correlations (±95% CI) for vertebrates only, split into within and among three modules: head, body and limb.
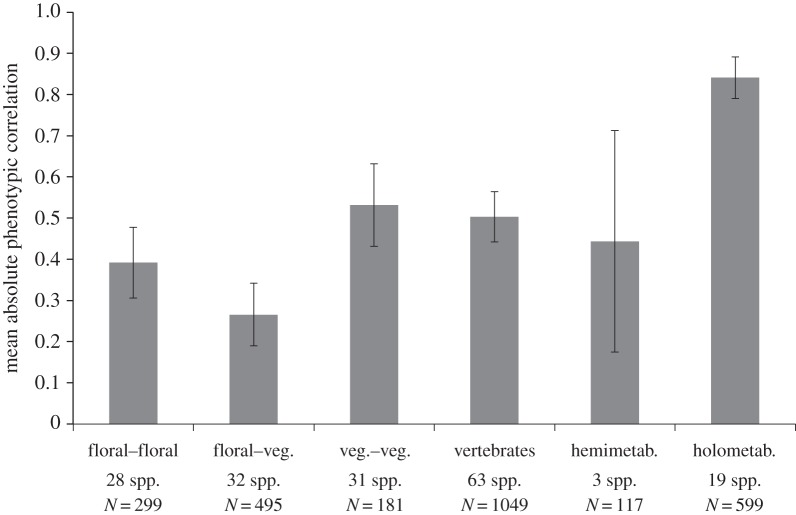
Another hypothesis is that complete metamorphosis could lead to higher correlations and integration within the holometabolous insects. To test this, we calculated means separately for the hemi- and holometabolous insects (figure 4). The hypothesis is supported, as holometabolous insects have much higher correlations than hemimetabolous, and the 95% CIs do not overlap. Note that the hemimetabolous mean is based on only three species, explaining the large CI, so this conclusion is preliminary. Also, the most serious case of lack of phylogenetic independence in the database occurs in the holometabolous insect group, as 504 of the 599 (84%) correlations and 13 of the 19 species (68%) of holometabolous insects come from one study of stalk-eyed flies [12]. However, removing the stalk-eyed flies reduces the mean holometabolous correlation by less than 0.01, so the pattern remains the same. Still, the 95% CI for holometabolous insects may be underestimated and is another reason that the conclusion of a difference between the two insect groups is preliminary. Clearly, more data on both hemi- and holometabolous species across more insect orders are needed.
Figure 4.
Mean phenotypic correlations as in figure 2, but with invertebrates split into hemi- and holometabolous insects only.
4. Discussion
The overall pattern shows that vertebrates, hemimetabolous insects and vegetative traits in plants all have a similar mean level of correlation, around 0.5; this value may thus represent a broad null expectation for correlations in multicellular organisms. Perhaps lower levels of integration than this generally reduce organismal function, and higher integration increases fitness only for specific trait groups (see below). Within-floral correlations and especially correlations between floral and vegetative traits in plants are lower than 0.5, and holometabolous insects are much more highly integrated, with an average correlation of 0.84. Note that this higher correlation in holometabolous insects does not necessarily conflict with the results of Wagner [13], who showed lower integration in insects compared with mammals, as Wagner's comparison was made after removing the effects of overall size. It might be interesting to compare the patterns of integration after removing the effects of size in a large sample of plants and animals.
One hypothesis for the higher correlations in holometabolous insects is that the adult phenotype is almost completely determined during a short time interval when the individual is immobile (pupation). Therefore, there is less temporal and spatial variation in the environment during the development of the adult form in holometabolous insects compared with other taxa, which should reduce random phenotypic variation induced by environmental variation during development. Experimentally increased environmental variation during pupation, or manipulation of the pupa itself [14], might shed light on this hypothesis. This hypothesis also predicts that larval traits in holometabolous insects have lower levels of correlation than do adults; because larval dimensions are rarely measured in holometabolous insects, much more data are needed. It is possible that this high integration is a contributing factor to the success of the holometabolous insects, but this could be a difficult hypothesis to test.
Another possibility is that indeterminate growth could increase average correlations by increasing the size variance among adults in a population. While we have not determined which specific species exhibit indeterminate growth in the database, indeterminate growth is common in fishes and reptiles and uncommon in birds and mammals, and average correlation is higher in the former group than in the latter (0.63 versus 0.41, respectively). However, there is only one species of fish and four reptiles in the database, and three of the latter are in the genus Anolis, so this pattern is preliminary.
Our results showing that flowers are not highly integrated organs is consistent with some other studies [3,15–17] (but see [18]). Indeed, mean within-flower correlation was lower than the mean within-vegetative trait correlation (0.39 versus 0.53, respectively) although the 95% CIs overlapped. Floral correlations lower than vegetative correlation could be caused by modularity within the flower, as there may be within the vertebrate head, but few studies to date have addressed within-flower modularity. The study of Bissell & Diggle [19] is a notable exception; their study included an unusually large number of floral traits (17), and this level of trait sampling is likely necessary to uncover within-flower modularity.
It is also possible that the lower floral correlations are due to lower correlations in radially symmetrical flowers. Ashman & Majetic [15] reported that mean genetic correlations among floral traits were significantly higher in bilaterally symmetrical flowers compared with radially symmetric (0.51 versus 0.23, respectively); the mean bilaterally symmetrical correlation is very similar to our mean within-vegetative correlation. However, Armbruster et al. [20] found no difference in mean floral phenotypic correlation between species with specialized and unspecialized pollination, similar to Berg's findings [4]. Because bilaterally symmetrical flowers tend to have more specialized pollination [21], the findings are somewhat contradictory with those of Ashman & Majetic [15]. Future work could separate species with radially and bilaterally symmetrical flowers in our database to further explore this relationship.
Despite the lower overall level of correlation in floral traits, there is good evidence that higher levels of floral correlation and integration can occur between specific pairs or groups of traits within the flower, when these trait subsets have specific functional relationships [16,22]. To make a strong case for functional integration in any set of traits, three lines of evidence are needed: (i) correlations among the traits are greater than the size-related background level of correlation (cf. [13]); (ii) there is correlational selection on the traits; and (iii) functional studies show how the traits work together in an integrated unit. For example, our work on wild radish flowers has provided these three lines of evidence for anther exsertion and the difference in lengths of the short and long stamens (see also [23]).
Most wild radish floral correlations are low to moderate (0.28–0.59), with the exception of the three correlations among the short and long filaments (the filaments mainly determine the length of the stamens) and the corolla tube ([22]; table 2). We have evidence for stabilizing selection through lifetime male seed siring success on the difference in lengths between the long filament and corolla tube (anther exsertion; [24]) and on the difference in lengths between the two filaments [25]. Stabilizing selection on the difference between two traits is evidence for correlational selection to increase the correlation between the two traits [26,27]. The stabilizing selection on anther exsertion is caused by a subset of the many effective pollinators of wild radish, halictid bees [28], which are the most important pollinators [29]. Functional studies of pollen removal in single visits match these selection results, as maximum removal occurs with intermediate anther exsertion in visits by halictids but not other pollinators [30]. Pollen removal observations and experiments suggest that the short stamens may function to reduce the rate of pollen removal by pollinators, which may increase male fitness under high pollinator visitation ([25,31]; AM Royer and JK Conner 2012, unpublished data). Therefore, specific pairs of traits within flowers can become more highly correlated through selection for functional integration, despite the fact that floral traits are not highly correlated in general.
Table 2.
Phenotypic correlations among wild radish (Raphanus raphanistrum) floral traits; all are lengths except petal width. All correlations are significant at p < 0.0001; N = 340. Modified from Conner & Via [22].
| petal length | petal width | corolla tube | short filament | long filament | |
|---|---|---|---|---|---|
| petal width | 0.59 | ||||
| corolla tube | 0.38 | 0.32 | |||
| short filament | 0.45 | 0.37 | 0.76 | ||
| long filament | 0.46 | 0.35 | 0.84 | 0.89 | |
| pistil | 0.42 | 0.28 | 0.41 | 0.42 | 0.44 |
5. Conclusion
There seems to be a general ‘background’ level of correlation of 0.5 among linear measurements, because vertebrates, hemimetabolous insects and vegetative traits in plants all exhibit this intermediate level of correlation on average. However, linear traits in holometabolous insects are much more highly correlated, 0.84 on average, perhaps due to reduced spatial and temporal variation in the environment during adult development in the pupal stage. Overall average correlations in plants are less than the 0.5 background level due to floral–vegetative decoupling and lower floral correlations. While flowers are not highly integrated overall, there is evidence in some species for subsets of more highly correlated traits caused by correlational selection for functional integration. More correlation data are needed, particularly from hemimetabolous insects, larval traits in holometabolous insects and animals with indeterminate growth. Also needed are comparisons of mean phenotypic correlation between radially symmetric and bilaterally symmetric flowers.
Supplementary Material
Acknowledgements
We thank Scott Armbruster, Rocio Barrales, Geir Bolstad, Doug Emlen, Vince Formica, Jason Kolbe, Tara Maginnis, Gabriel Marroig and Jason Wolf for sharing their data with us, and Scott Armbruster and two anonymous reviewers for numerous helpful suggestions.
Funding statement
This research was supported by NSF DEB 0919452. This is KBS contribution no. 1774.
References
- 1.Darwin C. 1859. On the origin of species by means of natural selection, 1st edn London, UK: John Murray. [Google Scholar]
- 2.Olsen EC, Miller RJ. 1958. Morphological integration. Chicago, IL: University of Chicago Press. [Google Scholar]
- 3.Berg RL. 1960. The ecological significance of correlation pleiades. Evolution 14, 171–180. ( 10.2307/2405824) [DOI] [Google Scholar]
- 4.Conner JK, Lande R. 2014. Raissa L. Berg's contributions to the study of phenotypic integration, with a professional biographical sketch. Phil. Trans. R. Soc. B 369, 20130250 ( 10.1098/rstb.2013.0250) [DOI] [PMC free article] [PubMed] [Google Scholar]
- 5.Wagner GP, Altenberg L. 1996. Perspective: complex adaptations and the evolution of evolvability. Evolution 50, 967–976. ( 10.2307/2410639) [DOI] [PubMed] [Google Scholar]
- 6.Pigliucci M. 2003. Phenotypic integration: studying the ecology and evolution of complex phenotypes. Ecol. Lett. 6, 265–272. ( 10.1046/j.1461-0248.2003.00428.x) [DOI] [Google Scholar]
- 7.Pigliucci M, Preston K. 2004. Phenotypic integration: studying the ecology and evolution of complex phenotypes. New York, NY: Oxford University Press. [Google Scholar]
- 8.Murren CJ. 2012. The integrated phenotype. Integr. Comp. Biol. 52, 64–76. ( 10.1093/icb/ics043) [DOI] [PubMed] [Google Scholar]
- 9.Magwene PM. 2001. New tools for studying integration and modularity. Evolution 55, 1734–1745. ( 10.1111/j.0014-3820.2001.tb00823.x) [DOI] [PubMed] [Google Scholar]
- 10.Marroig G, Cheverud JM. 2001. A comparison of phenotypic variation and covariation patterns and the role of phylogeny, ecology, and ontogeny during cranial evolution of New World monkeys. Evolution 55, 2576–2600. ( 10.1111/j.0014-3820.2001.tb00770.x) [DOI] [PubMed] [Google Scholar]
- 11.Mezey JG, Cheverud JM, Wagner GP. 2000. Is the genotype-phenotype map modular? A statistical approach using mouse quantitative trait loci data. Genetics 156, 305–311. [DOI] [PMC free article] [PubMed] [Google Scholar]
- 12.Baker RH, Wilkinson GS. 2003. Phylogenetic analysis of correlation structure in stalk-eyed flies (Diasemopsis, Diopsidae). Evolution 57, 87–103. ( 10.1111/j.0014-3820.2003.tb00218.x) [DOI] [PubMed] [Google Scholar]
- 13.Wagner GP. 1984. On the eigenvalue distribution of genetic and phenotypic dispersion matrices: evidence for a nonrandom organization of quantitative character variation. J. Math. Biol. 21, 77–95. ( 10.1007/BF00275224) [DOI] [Google Scholar]
- 14.Nijhout HF, Emlen DJ. 1998. Competition among body parts in the development and evolution of insect morphology. Proc. Natl Acad. Sci. USA 95, 3685–3689. ( 10.1073/pnas.95.7.3685) [DOI] [PMC free article] [PubMed] [Google Scholar]
- 15.Ashman TL, Majetic CJ. 2006. Genetic constraints on floral evolution: a review and evaluation of patterns. Heredity 96, 343–352. ( 10.1038/sj.hdy.6800815) [DOI] [PubMed] [Google Scholar]
- 16.Ordano M, Fornoni J, Boege K, Domínguez CA. 2008. The adaptive value of phenotypic floral integration. New Phytol. 179, 1183–1192. ( 10.1111/j.1469-8137.2008.02523.x) [DOI] [PubMed] [Google Scholar]
- 17.Fornoni J, Ordano M, Boege K, Domínguez CA. 2009. Phenotypic integration: between zero and how much is too much. New Phytol. 183, 248–250. ( 10.1111/j.1469-8137.2009.02911.x) [DOI] [PubMed] [Google Scholar]
- 18.Harder LD. 2009. Questions about floral (dis)integration. New Phytol. 183, 247–248. ( 10.1111/j.1469-8137.2009.02881.x) [DOI] [PubMed] [Google Scholar]
- 19.Bissell EK, Diggle PK. 2008. Floral morphology in Nicotiana: architectural and temporal effects on phenotypic integration. Int. J. Plant Sci. 169, 225–240. ( 10.1086/523875) [DOI] [Google Scholar]
- 20.Armbruster WS, Di Stilio VS, Tuxill JD, Flores TC, Velasquez Runk JL. 1999. Covariance and decoupling of floral and vegetative traits in nine neotropical plants: a re-evaluation of Berg's correlation-pleiades concept. Am. J. Bot. 86, 39–55. ( 10.2307/2656953) [DOI] [PubMed] [Google Scholar]
- 21.Fenster CB, Armbruster WS, Wilson P, Dudash MR, Thomson JD. 2004. Pollination syndromes and floral specialization. Annu. Rev. Ecol. Evol. Syst. 35, 375–403. ( 10.1146/annurev.ecolsys.34.011802.132347) [DOI] [Google Scholar]
- 22.Conner J, Via S. 1993. Patterns of phenotypic and genetic correlations among morphological and life history traits in wild radish, Raphanus raphanistrum. Evolution 47, 704–711. ( 10.2307/2410086) [DOI] [PubMed] [Google Scholar]
- 23.Conner JK, Sahli HF, Karoly K. 2009. Tests of adaptation: functional studies of pollen removal and estimates of natural selection on anther position in wild radish. Ann. Bot. 103, 1547–1556. ( 10.1093/aob/mcp071) [DOI] [PMC free article] [PubMed] [Google Scholar]
- 24.Morgan MT, Conner JK. 2001. Using genetic markers to directly estimate male selection gradients. Evolution 55, 272–281. ( 10.1111/j.0014-3820.2001.tb01292.x) [DOI] [PubMed] [Google Scholar]
- 25.Conner JK, Rice AM, Stewart C, Morgan MT. 2003. Patterns and mechanisms of selection on a family-diagnostic trait: evidence from experimental manipulation and lifetime fitness selection gradients. Evolution 57, 480–486. ( 10.1111/j.0014-3820.2003.tb01539.x) [DOI] [PubMed] [Google Scholar]
- 26.Phillips PC, Arnold SJ. 1989. Visualizing multivariate selection. Evolution 43, 1209–1222. ( 10.2307/2409357) [DOI] [PubMed] [Google Scholar]
- 27.Brodie ED., III 1992. Correlational selection for color pattern and antipredator behavior in the garter snake Thamnophis ordinoides. Evolution 46, 1284–1298. ( 10.2307/2409937) [DOI] [PubMed] [Google Scholar]
- 28.Sahli HF, Conner JK. 2011. Testing for conflicting and nonadditive selection: floral adaptation to multiple pollinators through male and female fitness. Evolution 65, 1457–1473. ( 10.1111/j.1558-5646.2011.01229.x) [DOI] [PubMed] [Google Scholar]
- 29.Sahli HF, Conner JK. 2007. Visitation, effectiveness, and efficiency of 15 genera of visitors to wild radish, Raphanus raphanistrum (Brassicaceae). Am. J. Bot. 94, 203–209. ( 10.3732/ajb.94.2.203) [DOI] [PubMed] [Google Scholar]
- 30.Conner JK, Davis R, Rush S. 1995. The effect of wild radish floral morphology on pollination efficiency by four taxa of pollinators. Oecologia 104, 234–245. ( 10.1007/BF00328588) [DOI] [PubMed] [Google Scholar]
- 31.Thomson JD, Thomson BA. 1992. Pollen presentation and viability schedules in animal-pollinated plants: consequences for reproductive success. In Ecology and evolution of plant reproduction (ed. Wyatt R.), pp. 1–24. New York, NY: Chapman and Hall. [Google Scholar]
Associated Data
This section collects any data citations, data availability statements, or supplementary materials included in this article.


