Abstract
Previous studies proposed a dynamic, steady-state relationship between HIV-mediated cell killing and T-cell proliferation, whereby highly active antiretroviral therapy (HAART) blocks viral replication and tips the balance toward CD4+ cell repopulation. In this report, we have analyzed blood and lymph node tissues obtained concurrently from HIV-infected patients before and after initiation of HAART. Activated T cells were significantly more frequent in lymph node tissue compared with blood at both time points. Ten weeks after HAART, the absolute number of lymphocytes per excised lymph node decreased, whereas the number of lymphocytes in the blood tended to increase. The relative proportions of lymphoid subsets were not significantly changed in tissue or blood by HAART. The expression levels of mRNA for several proinflammatory cytokines (IFN-γ, IL-1β, IL-6, and macrophage inflammatory protein-1α) were lower after HAART. After therapy, the expression of VCAM-1 and ICAM-1 — adhesion molecules known to mediate lymphocyte sequestration in lymphoid tissue — was also dramatically reduced. These data provide evidence suggesting that initial increases in blood CD4+ cell counts on HAART are due to redistribution and that this redistribution is mediated by resolution of the immune activation that had sequestered T cells within lymphoid tissues.
Introduction
Analysis of the initial dynamic effects of potent antiretroviral therapy on plasma HIV RNA levels has provided significant insights into retroviral pathogenesis (1, 2). Within weeks after the administration of highly active antiretroviral therapy (HAART), steep declines in plasma HIV RNA (∼3 log10) are observed coincident with an abrupt rise in CD4+ T cells circulating in the blood. One widespread interpretation of these findings is that therapeutic perturbation of a steady-state relationship reveals a constant and dynamic equilibrium between virus-mediated cell killing and endogenous production of uninfected CD4+ T lymphocytes. In this “tap and drain” model (2), decreased viral killing quickly tips the balance in favor of lymphocyte production, allowing at least a partial immune reconstitution to occur. Other investigators have offered opposing viewpoints (3–5) based on several arguments: the possibility that the adult immune system might not have the capacity for the rapid CD4+ T-cell regeneration proposed in this model; the lack of evidence for heightened CD4+ T-cell turnover cells among HIV-infected individuals; and the observation of increases in all lymphoid subsets in blood rather than a specific increase in CD4+ T cells that are the target of HIV infection.
Pakker et al. (6) concluded that a significant proportion of the CD4 +T-cell rise observed in treated individuals may be attributable to redistribution of cells from tissues to blood rather than to rapid replacement of the cells eliminated by viral infection. However, using a cellular proliferation assay based on bromodeoxyuridine labeling of lymphocytes, Mohri et al. (7) describe generalized immune activation and heightened blood lymphocyte turnover in macaques infected with the simian immunodeficiency virus (SIV) compared with uninfected control animals. These investigators concluded that rapid regeneration of T cells is a characteristic feature of the host response to retrovirus infection. Thus, considerable controversy remains regarding the cellular dynamics during initiation of treatment and throughout the course of HIV infection.
To resolve these issues, we compared the total number of lymphocytes and the distribution of lymphocyte subsets in blood and lymphoid tissue specimens obtained from HIV-infected adults before and after initiating HAART regimens as part of a clinical study. HIV RNA and protein expression, inflammatory adhesion molecules (VCAM-1 and ICAM-1), and proinflammatory cytokine messenger RNAs were also measured in lymph node biopsy specimens before and after therapy. In this study, we provide evidence that the resolution of immune activation associated with potent suppression of viral replication results in the net redistribution of lymphocytes from lymphoid tissue to blood.
Methods
Subjects.
The subjects in this analysis were enrolled in a lymph node substudy (Adult AIDS Clinical Trials Group 874) of an ongoing multicenter clinical trial (ACTG 328). The University of Alabama–at Birmingham Institutional Review Board reviewed and approved both the parent trial and the lymph node biopsy substudy. All subjects provided informed consent. The parent clinical trial is focused on CD4 T-cell responses to HAART (2 reverse transcriptase inhibitors and the protease inhibitor indinavir) with or without parenterally administered cycles of recombinant human IL-2 (rhIL-2). This report focuses on 2 time points in the clinical trial (baseline and week 10) before the addition of rhIL-2.
Biopsies.
Excisional lymph node biopsies were performed during the week before initiation of the antiretroviral regimen and again after 10 weeks of HAART. All biopsies were obtained from the posterior cervical lymphatic chain at level 3 or 4, and an entire lymph node was removed under local anesthesia. After 10 weeks of combination antiretroviral therapy, another excisional lymph node biopsy was obtained from the same anatomic site on the contralateral neck. In the operating room, the gross size of the lymph node tissue (excluding adherent fat and connective tissue) was measured in centimeters, and the volume of each specimen was estimated in cubic centimeters. A measured portion was separated during surgery and transported to the biocontainment facility, and a single cell suspension was prepared by standard mechanical disaggregation. The absolute number of lymphocytes obtained from this measured portion of the lymph node was determined by direct cell count in a hemocytometer and used to estimate the total number of lymphocytes in each node specimen. The remaining tissue was immediately frozen in operating cutting temperature (OCT) compound in liquid nitrogen and stored at –80°C.
Flow cytometry.
The single cell suspension from the lymph node and a specimen of blood obtained the same day as the lymph node biopsy were analyzed by standard flow cytometry procedures. Blood cell counts were performed in the University of Alabama–Birmingham Hospital Labs using an automated Coulter counter. The frequencies of lymphoid cell subsets from the lymph node cell suspensions were compared with those in the blood specimens from each subject at baseline and after 10 weeks of HAART.
Quantitative measurement of cytokine mRNAs.
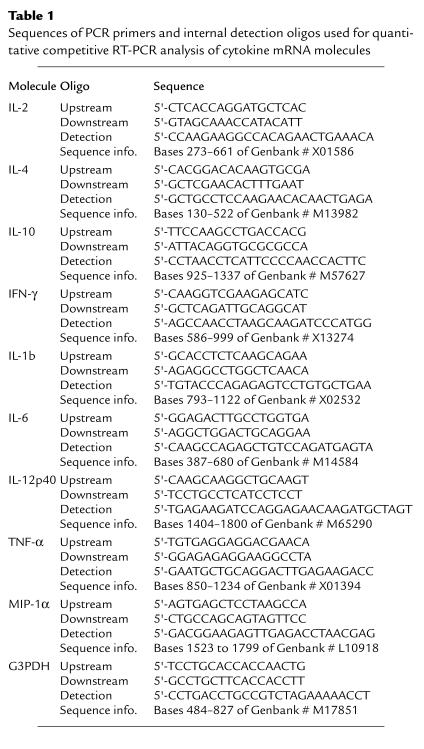
Cytokine messenger RNAs for IL-2, IL-4, IL-10, IFN-γ, IL-1β, IL-6, IL-12p40, TNF-α, macrophage inflammatory protein-1α (ΜIP-1α), and the housekeeping gene G3PDH were quantitated by a modification of the procedure described previously by Hockett et al. (8). Briefly, a series of adjacent frozen tissue sections were solubilized in guanidium isothiocyanate (GITC; ref. 9) at 10 μL per section (30 sections in 300 μL GITC). One section equivalent of GITC extract (10 μL) was added to the appropriate competitor RNAs at different concentrations, each concentration in a separate tube. Extraction, cDNA generation, PCR, and enzyme immunoassay (EIA) were performed as described (8). The sequences of the primers and detection oligos for PCR and EIA are shown in Table 1. Conditions for PCR were as follows: 94°C for 30 seconds, 55°C for 1 minute, and 72°C for 30 seconds, 35 cycles. The appropriate Mg2+ for each primer set was as follows: 3.6 mM final for IL-2, IL-4, IL-10, and IFN-γ; 2.6 mM final for IL-6, IL-12p40, and G3PDH; and 1.6 mM final for IL-1β, TNF-α, and MIP-1α.
Table 1.
Sequences of PCR primers and internal detection oligos used for quantitative competitive RT-PCR analysis of cytokine mRNA molecules
Immunohistochemical staining.
Immunohistochemical detection was performed using a panel of mAb’s including anti–ICAM-1 (CD54) and anti–VCAM-1 (CD106) (Becton Dickinson Immunocytometry Systems, Mountain View, California, USA). Standard indirect immunohistochemical staining using biotinylated anti-mouse IgG, the Avidin-Biotin Complex reagent (ABC Elite; Vector Laboratories, Burlingame, California, USA), and 3,3′-diaminobenzidine (DAB; Sigma Chemical Co., St. Louis, Missouri, USA) as the chromagen was performed as described previously (10). Adjacent sections of each block were stained without a primary mAb and with a control murine IgG1 mAb specific for chicken T cells but unreactive to human tissue.
Results
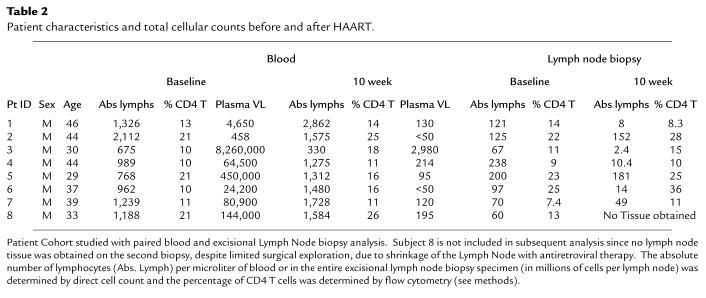
The subjects are 7 HIV-infected males (median age: 44 years; range: 29–49 years) who had at baseline a median absolute blood CD4 lymphocyte count of 136 (range: 61–350) cells per cubic millimeter and a median plasma HIV RNA of 64,503 (range: 458–8,260,220) copies per milliliter (Table 2). Six of the 7 subjects had achieved viral suppression to less than 500 copies per milliliter at the 10-week time point. The remaining patient (with the highest initial viral load) experienced a >3 log10–fold decline in viral load by week 10. The decline in plasma HIV RNA was directly correlated with the decline of HIV RNA+ cells in the lymph node biopsies, as determined by in situ hybridization (Hockett, R.D., et al. In press.)
Table 2.
Patient characteristics and total cellular counts before and after HAART.
On physical examination, bilateral palpable cervical lymph nodes were noted in all cases before therapy. After 10 weeks on HAART, the lymph nodes were decreased in size in each case, based on preoperative evaluation by the surgeon (Michael J. Sillers). In 4 of these 8 cases, no palpable lymph nodes were noted at 10 weeks after HAART, although in 3 of these cases, limited surgical exploration of the posterior cervical area did yield small lymph nodes. The subject in whom no lymph nodes were obtained on the second biopsy was excluded from this analysis in order that 7 patients with paired blood and lymph node tissue at baseline and 10 weeks after HAART could be compared. Thus, administration of HAART to these advanced HIV-infected subjects caused loss of palpable lymph nodes in 4 of 8 subjects and decreased size of the palpable lymph nodes in the other 4 subjects.
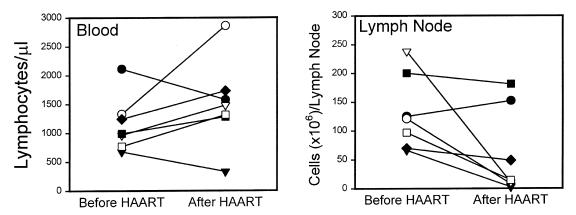
In the 7 cases with 2 successful biopsies of cervical lymph nodes, both direct size measurements (median estimated volume of excised lymph nodes: 1.3 cm3 before HAART and 0.5 cm3 after HAART; P < 0.05) and the number of lymphocytes per excised node (median: 121 × 106 before HAART and 14.4 × 10⁶ after HAART; P < 0.05) suggest a significant decrease in lymphadenopathy on therapy. The decrease in lymph node cellularity correlated inversely with the increasing trend in the absolute lymphocyte count per microliter of blood (Figure 1). The subject with the lowest viral load before HAART (458 copies/mL; Figure 1, filled circle) actually showed a decrease in total lymphocytes in blood and a slight increase in the size of the lymph node specimen. The other subject with a decrease in blood lymphocytes (Figure 1, filled triangle) was diagnosed with an inflammatory retroperitoneal mass due to mycobacterial infection after the second biopsy. Although the expected rise in blood lymphocytes on therapy does not reach statistical significance with these 2 exceptional cases included, these observations actually support the hypothesis that an inverse relationship exists between the number of lymphocytes circulating in blood and the number of lymphocytes localized in inflamed tissues.
Figure 1.
Absolute numbers of lymphocytes in blood and a single excision lymph node biopsy from level 3 or 4 in the posterior cervical chain before induction of HAART and 10 weeks after HAART in 7 subjects. Blood and lymph node biopsies were obtained on the same day. Different symbols represent individual subjects. Biopsies after HAART were taken from the opposite side of the neck in the same anatomical location as the prior biopsy. The decrease in number of lymphocytes per lymph node is significant (P < 0.05) by paired t test (median: 121 × 106 cells before HAART and 14.4 × 10⁶ cells after HAART). The gross size of the measured lymph node specimens was also significantly decreased (P < 0.05), as determined by paired t test (median: 1.3 cm3 before HAART and 0.5 cm3 after HAART). The increase in lymphocytes in the blood does not reach formal statistical significance (P = 0.11; median: 989 cells/μL before HAART and 1,480 cells/μL after HAART). Note that subject 2 (filled circle; see Table 2), with the highest lymphocyte count and lowest viral load before HAART, showed decreased blood T cells but increased cells in lymph node. This subject confounds the general trend of increased cells in blood but is consistent with an inverse relationship between blood and tissue cells.
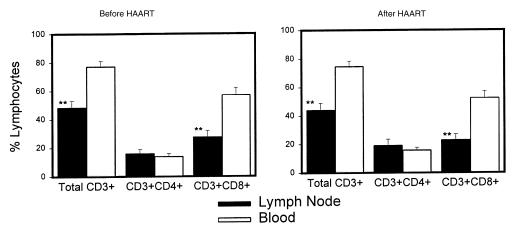
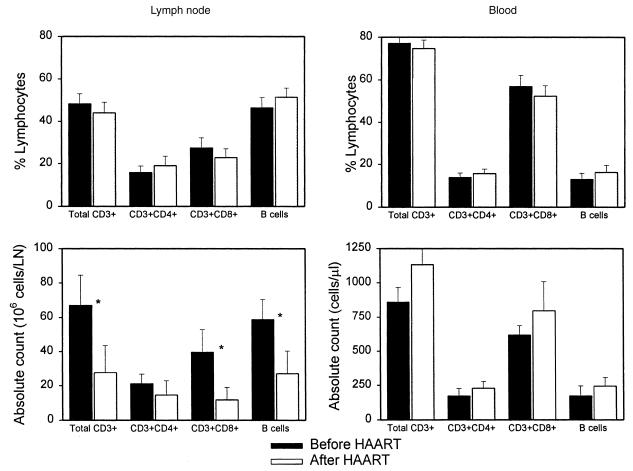
Evaluation of lymph node and blood lymphocytes by flow cytometry showed similar proportions of both CD4 and CD8 T-cell subsets (Figure 2) in each compartment before and after antiretroviral treatment. However, there were significantly more CD8 T cells in the blood compared with paired lymph node tissue biopsy specimens both before and after induction of HAART. Thus, the proportion of the total T cells that are CD4+ was greater in the lymph node tissue than in blood in these subjects, indicating relative sequestration of CD4 T cells in lymph nodes. Comparison of the major lymphoid subsets in either lymph node tissue or blood for changes in either relative frequency or absolute counts (Figure 3) demonstrates no significant changes in relative frequency, but an inverse pattern of change in tissue compared with blood. Although the fraction of CD4 T cells in both blood and tissue was slightly higher 10 weeks after the initiation of HAART, this difference is not significant. Thus, the predominant overall change was an increase in the absolute number of lymphocytes in blood (including B cells), with a corresponding decrease in cell number in these superficial lymph nodes. These alterations in cell numbers are more consistent with the concept of redistribution of cells from tissue to blood rather than generation of “new” CD4 T cells in all anatomical compartments.
Figure 2.
Comparison of relative frequency of total T cells and the CD4 and CD8 subsets of T cells by flow cytometry analysis in paired specimens of blood and lymph node obtained the same day before induction of HAART and 10 weeks after HAART in 7 subjects. The fraction of total T cells and CD8+ T cells among the total lymphocytes was significantly lower in lymph node than in blood (**P < 0.01; paired t test) both before and after HAART. There were no significant differences in the fraction of any subset of cells comparing the before/after HAART analysis within the same compartment.
Figure 3.
Comparison of relative frequency (top) and absolute number (bottom) of lymphoid subsets in either lymph node or blood. The dark bars are data from baseline (before HAART), and the light bars are data from 10 weeks after HAART induction. The fall in lymphocytes in the lymph node biopsy (Figure 1) results in a calculated decrease in total T cells, CD8+ T cells, and B cells in the lymph node (*P < 0.05), although the relative fraction of these cells is not significantly changed by HAART (top). Although the increase in blood does not achieve formal statistical significance, a single subject with high initial lymphocyte count that fell after therapy confounds the trend of increased cells in blood.
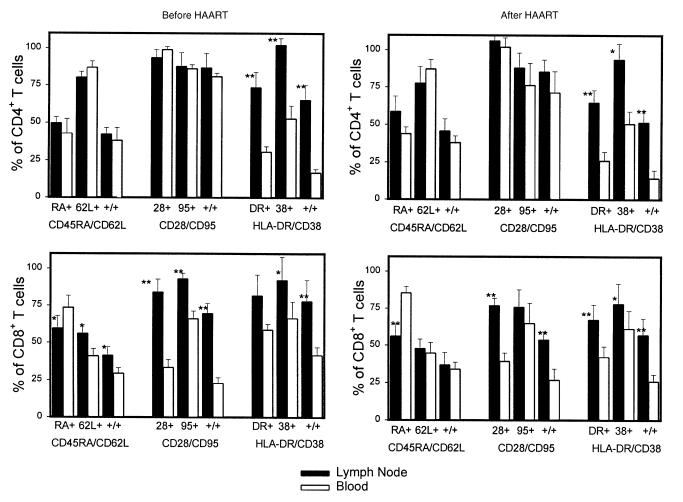
Examination of the proportions of various subsets of CD4 and CD8 T cells in these paired blood and lymph node specimens also reveals evidence consistent with redistribution of cells after HAART. In both the CD4 and CD8 subsets of T cells, the frequency of activated T cells that coexpress HLA-DR and/or CD38 was higher in lymph node than the matched blood specimen (Figure 4). Although the frequency of activated T cells decreased marginally in both blood and tissue after HAART, the preferential sequestration of the activated subset of cells in lymph node tissue remained statistically significant even after 10 weeks of antiretroviral therapy. Thus, the consistent pattern in the distribution of lymphocyte subsets is the relative abundance of the activated T cells in lymph nodes compared with matched blood specimens. There were also significantly more CD28+CD8+ T cells in lymph nodes compared with the simultaneous blood specimen, with little change in this proportion after the induction of HAART. There were also significant differences between the lymph node and blood CD8 T cells that express the CD45RA isoform and CD62L, markers related to the memory status of these cells. In this cohort of 7 subjects, there were no statistically significant changes in the percentage of these T-cell subsets after the initiation of HAART in either blood or lymph node compartments. Thus, activated T cells are relatively sequestered in lymph node tissue compared with blood, and the absolute size of the lymphocyte pool rises in blood and falls in these lymph node tissues after induction of HAART.
Figure 4.
Comparison of relative frequency of multiple T-cell subsets by three-color flow cytometry analysis in paired specimens of blood and lymph node before and after induction of HAART. In each set of analyses, the first set of bars represents the fraction cells positive for the first marker, and the second set represents the fraction cells positive for the second marker. The third set of bars (+/+) represents the fraction of cells that coexpress both markers. Top: CD4 T cells; bottom: CD8 T cells; left: data before HAART; right: results from 10 weeks after HAART. Differences between lymph node and blood for the same subset on the same day with statistical significance by a paired t test are indicated by asterisks: *P < 0.05, **P < 0.01. There were no statistically significant differences among these 7 subjects, comparing the data for any subset before versus after HAART.
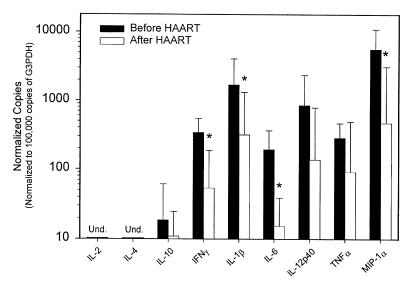
One hypothesis to account for the abrupt rise in circulating blood lymphocytes after HAART is that suppression of viral replication reduces the intense immune activation in lymph node tissues that had previously sequestered lymphocytes in tissue sites. Consistent with this model, the frequency of viral RNA+ cells determined by in situ hybridization decreased in parallel to the fall in plasma viral load in this set of lymph nodes (Hockett, R.D., et al., manuscript submitted for publication). To examine another parameter of immune activation in these tissue specimens, we determined the level of expression of several inflammatory cytokine mRNA species in these lymph node biopsies before and after induction of HAART (Figure 5). Cytokine mRNAs for IFN-γ, IL-1β, IL-6, and MIP-1α decreased significantly in lymph node tissue after HAART. The level of TNF-α and IL-12p40 mRNA decreased in some specimens but was more variable, and this trend did not reach statistical significance. The levels of expression of IL-2 and IL-4 mRNA were below the limits of detection both before and after therapy. Some specimens showed detectable IL-10 mRNA expression, with no consistent difference detected in specimens obtained before versus after induction of HAART.
Figure 5.
Expression levels of various inflammatory cytokines determined by quantitative competitive RT-PCR in the lymph node biopsies of these 7 subjects before and after induction with HAART. Reduced expression of IFN-γ, IL-1β, IL-6, and MIP-1α is statistically significant (*P < 0.05) by a paired t test. The expression levels are normalized to the number of copies of each cytokine mRNA per 105 mRNA copies of the constitutive intracellular enzyme G3PDH, which corresponds to ∼103 lymphocytes. The ratio of G3PDH mRNA per volume of lymph node tissue analyzed did not change after HAART (data not shown).
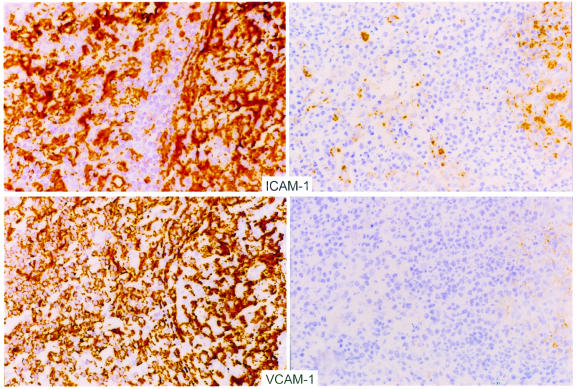
A key determinant of the recirculation of lymphocytes between blood and tissue sites is the expression of adhesion molecules. We investigated whether the resolution of active viral replication by HAART would alter the expression of adhesion molecules by staining frozen sections of these lymph nodes with mAb’s specific for adhesion molecules ICAM-1 (CD54) and VCAM-1 (CD106). ICAM-1 and VCAM-1 are integrins that mediate lymphocyte-endothelial cell interactions and promote the sequestration of circulating lymphocytes in tissue. The levels of these integrins are known to increase in tissue after stimulation with inflammatory cytokines (11–17). As shown in Figure 6, ICAM-1 and VCAM-1 were expressed in high concentrations in tissues obtained before therapy and substantially declined after antiretroviral therapy. These changes were noted primarily in the parafollicular area (T-cell zone) of the lymph node, with a lesser decrease in the follicular center areas. These results suggest that viral antigen stimulates immune activation in lymphoid tissue during periods of high viral replication. Suppression of viral replication by HAART may result in a substantially decreased antigenic stimulus, reduced inflammatory cytokine expression, reduced adhesion molecule expression, and, finally, a net redistribution of lymphocytes from these previously inflamed tissues into the blood.
Figure 6.
Representative photomicrographs demonstrating immunohistochemical staining of lymph node sections before (left) and after (right) HAART with ICAM-1 (top) and VCAM-1 (bottom). Expression of these markers was decreased in each pair of biopsies examined. These sections represent analysis performed on the same day with the same staining conditions for biopsies obtained from an individual patient.
Discussion
The rapid decline in plasma viral load and the concurrent rise in CD4 T cells detected in blood after the institution of HAART led to a new conception of HIV disease pathogenesis (1, 2). The rapid fall in viral RNA resulting from drugs that block new infection implies that HIV disease involves continual rounds of de novo infection of CD4+ cells and their equally rapid death in vivo. The idea of rapid CD4 T-cell production provided an elegant parallel to the dynamic nature of viral turnover. The concept of a high rate of viral-mediated cell death balanced by an equally high rate of cellular production, however, fails to account for multiple features of HIV disease and T-cell physiology. An alternative explanation for the acute reciprocal changes observed in the number of circulating T cells and plasma viral load is that blockade of active viral replication results in resolution of lymphocyte sequestration in tissue sites and redistribution of these sequestered cells to blood.
The concept of a high rate of viral-mediated cell death balanced by an equally high rate of cellular production leads to the conclusion that the turnover of CD4 T cells is high during HIV infection. Several different methodological approaches have been used to measure the extent of T-cell turnover, and some of the resulting data have been conflicting. Although active SIV infection in nonhuman primates is associated with increased turnover of CD4+ T cells as assessed by bromodeoxyuridine labeling (7), estimates of cellular turnover in HIV disease using analysis of telomere length appear to contradict this conclusion (18, 19). Because shortened telomeres are correlated with proliferative cellular senescence in multiple lineages (20–22), they are markers of increased cellular turnover. Although CD8+ T cells from HIV-infected subjects do have shortened telomere length (23), there is little change in telomere length within the CD4+ T-cell subset (18, 19). Analysis of either blood (24) or lymphoid tissue (25) proliferative rates assessed by expression of nuclear antigen Ki-67, which is not expressed in G0 cells, demonstrates increased turnover of both CD4 and CD8 T cells in active HIV infection. The analysis of T-cell turnover rates in blood CD4 T cells using the incorporation of deuterium-labeled glucose into newly synthesized DNA indicates higher turnover with HIV infection and an increase in the fraction of labeled CD4 T cells in the blood after institution of HAART (26, 27).
To account for increased numbers of T cells in the blood after antiretroviral therapy, however, the distinction between the 2 conceptual models is not based on the magnitude of cellular turnover per se. The critical conceptual distinction between these models is the nature of the stimulus for the increased cellular turnover. One view is that cellular proliferation is a compensatory mechanism to replenish the continual loss of CD4 T cells due to HIV-induced cell death. An alternative hypothesis is that high viral antigen drives an intense, but only partially effective, immune response. Active immune responses are normally associated with cellular proliferation and activation-induced cell death mediated by expression of CTLA-4 on activated T cells (28, 29). We propose that increased antigen-driven cellular turnover in active HIV infection is generally balanced by this normal mechanism of activation-induced apoptosis rather than by direct HIV-mediated cell death. The increased turnover rate of CD8 T cells also found during active viral replication is more compatible with an ongoing antiviral immune response rather than a compensatory mechanism to balance loss of cells due to HIV-mediated cell death.
The concept of high lymphocyte turnover resulting in an abrupt increase in circulating T cells after initiation of HAART is likewise not supported by other studies of lymphocyte kinetics. Most T cells arise in the thymus during the first few years of life, and the thymus substantially involutes by the time of adulthood. Murine and human studies of T-cell production and survival suggest that the T-cell population as a whole is quite long-lived (30–33). When thymectomized mice are given an anti-CD4 antibody that eliminates most of the CD4 T cells, there is negligible recovery of these cells over many months (34, 35). Similarly, the recovery rate of blood T cells in adults without HIV infection who are treated with ablative chemotherapy (36, 37) or anti-CD4 mAb’s (38, 39) is quite modest, occurring only gradually over many years. These results indicate that the mere existence of available niche space in peripheral tissues is not a strong stimulus for the net production of T cells. In this context, reports that resting CD4 T cells with latent HIV infection are not cleared rapidly (40, 41), even after prolonged effective antiretroviral therapy, are also consistent with a slow turnover of CD4 T cells in vivo. Although total population growth of CD4 T cells in vivo is slow, the transit rate of lymphocytes between lymphoid tissue compartments and the blood pool is rapid, with estimates that individual cells transit from blood to tissue and back again as often as 2 times per day (32, 42). Circadian rhythms in the absolute CD4 lymphocyte count in circulating blood (43, 44) represent a well-known example of this constant variability.
Another result that further distinguishes between these 2 models of cellular dynamics after antiretroviral therapy is that there is actually an increase in the total lymphocyte count, not exclusively an increase in CD4 T cells. Although this fact was noted in the original reports of high turnover (1, 2), and later by others (45), the conceptual importance of this observation has only recently been emphasized (6, 46). Autran et al. (47) described an initial and abrupt increase in the CD45RO subset of CD4 T cells, followed over many months by a more subtle increase in the CD45RA subset. Pakker et al. (6) recognized that potent antiretroviral therapy results in an increase in all blood lymphocyte populations (CD4, CD8, and B cells) in the initial weeks after antiviral therapy. These authors also confirmed that the bulk of this early rise is due to the return of memory (CD45RO) rather than naive (CD45RA) lymphocytes and that the initial increase was minor in subjects with less-advanced disease and high baseline CD4 counts. Pakker et al. proposed that these initial changes in cell numbers could be due to redistribution of lymphocytes from the tissues, but simultaneous tissue assays were not available to verify this hypothesis.
The observations reported here directly support the concept that the first-phase rise in lymphocytes, including CD4 T cells, is most likely due to redistribution of lymphocytes from lymphoid tissue to blood. First, activated T cells are relatively sequestered in lymph nodes compared with blood, both before and after therapy. Second, the expression level of mRNA for multiple inflammatory cytokines is decreased after institution of antiretroviral therapy. Studies with immunohistochemical localization of various cytokine proteins have also shown significant decreases in cytokine expression associated with HAART induction (48). Third, the absolute size of the superficial lymph nodes (and absolute number of lymphocytes in these nodes) decreases after therapy, although the relative proportions of the major lymphocyte subsets do not show substantial changes. Fourth, the expression levels of several adhesion molecules that directly mediate the trafficking of lymphocytes between blood and lymphoid tissue are significantly decreased in lymph node tissue after therapy. These results are most consistent with the resolution of a previously intense immune activation, which was driven by viral antigen produced as a consequence of high viral replication and which had resulted in relative sequestration of lymphocytes in the sites of viral antigen production. An alternative possibility is that HIV-infected cells produce a key inflammatory cytokine as a direct consequence of cellular infection and that this hypothetical cytokine drives the state of immune activation in sites of viral replication. The conclusion that the first-phase rise in blood lymphocytes is due to redistribution does not rule out the possibility that the total body pool of CD4 T cells may rise slowly with continued suppression of viral replication, by way of either expansion of existing T cells or thymic generation, as proposed by other investigators (47).
The redistribution model suggests that the early improvement in immune function and the recovery from constitutional symptoms observed after individuals with advanced HIV disease start therapy may be due to resolution of the immune activation state associated with high viral replication — rather than being attributable to the production of new CD4 T cells. Such immune activation could have many consequences, including increased expression of cellular adhesion molecules resulting in sequestration of cells in lymphoid tissues. This chronic immune activation likely has net inhibitory effects on other immune responses, including cytokine expression and the ability of lymphocytes to migrate to sites of antigen exposure. Suppression of viral replication by a wide variety of antiretroviral regimens results in substantial immune reconstitution, with decreased rates of opportunistic infection and death from AIDS (49, 50). The concept that this functional improvement is directly related to a decrease in the chronic state of immune activation associated with high viral replication supports the conclusion that the immunodeficiency associated with AIDS is more than just a quantitative loss of CD4 T cells.
Acknowledgments
The authors thank the study subjects; Richard Pollard and the ACTG 328 team for the leadership of the ongoing clinical trial protocol; and Debra Horton, Jane House, Connie Miller, Jimin Li, Li Fang Li, Rebecca Gilleland, and Mark MacEwen for technical assistance. This work was partially supported by Chiron Corp., the Adult AIDS Clinical Trials Group, and the General Clinical Research Center and Center for AIDS Research at the University of Alabama–Birmingham.
References
- 1.Ho DD, et al. Rapid turnover of plasma virions and CD4 lymphocytes in HIV-1 infection. Nature. 1995;373:123–126. doi: 10.1038/373123a0. [DOI] [PubMed] [Google Scholar]
- 2.Wei X, et al. Viral dynamics in human immunodeficiency virus type 1 infection. Nature. 1995;373:117–122. doi: 10.1038/373117a0. [DOI] [PubMed] [Google Scholar]
- 3.Mosier D, Sprent J, Tough D. CD4+ cell turnover. Nature. 1995;375:193–194. doi: 10.1038/375193b0. [DOI] [PubMed] [Google Scholar]
- 4.Dimitrov DS, Martin MA. HIV results in the frame. CD4+ cell turnover. Nature. 1995;375:194–195. doi: 10.1038/375194b0. [DOI] [PubMed] [Google Scholar]
- 5.Grossman Z, Herberman RB. T-cell homeostasis in HIV infection is neither failing nor blind: modified cell counts reflect an adaptive response of the host. Nat Med. 1997;3:486–490. doi: 10.1038/nm0597-486. [DOI] [PubMed] [Google Scholar]
- 6.Pakker NG, et al. Biphasic kinetics of peripheral blood T cells after triple combination therapy in HIV-1 infection: a composite of redistribution and proliferation. Nat Med. 1998;2:208–214. doi: 10.1038/nm0298-208. [DOI] [PubMed] [Google Scholar]
- 7.Mohri H, Bonhoeffer S, Monard S, Perelson AS, Ho DD. Rapid turnover of T lymphocytes in SIV-infected rhesus macaques. Science. 1998;279:1223–1227. doi: 10.1126/science.279.5354.1223. [DOI] [PubMed] [Google Scholar]
- 8.Hockett RD, Janowski KM, Bucy RP. Simultaneous quantitation of multiple cytokine mRNAs by RT-PCR utilizing plate based EIA methodology. J Immunol Methods. 1995;187:273–285. doi: 10.1016/0022-1759(95)00195-5. [DOI] [PubMed] [Google Scholar]
- 9.Chomczynski P, Sacchi N. Single-step method of RNA isolation by acid guanidinium thiocyanate-phenol-chloroform extraction. Anal Biochem. 1987;162:156–159. doi: 10.1006/abio.1987.9999. [DOI] [PubMed] [Google Scholar]
- 10.Bucy RP, Chen CH, Cihak J, Losch U, Cooper MD. Avian T cells expressing gamma delta receptors localize in the splenic sinusoid and the intestinal epithelium. J Immunol. 1988;141:2200–2205. [PubMed] [Google Scholar]
- 11.Dustin ML, Springer TA. Role of lymphocyte adhesion receptors in transient interactions and cell locomotion. Annu Rev Immunol. 1991;9:27–66. doi: 10.1146/annurev.iy.09.040191.000331. [DOI] [PubMed] [Google Scholar]
- 12.Shimizu Y, et al. Four molecular pathways of T cell adhesion to endothelial cells: roles of LFA-1, VCAM-1, and ELAM-1 and changes in pathway hierarchy under different activation conditions. J Cell Biol. 1991;113:1203–1212. doi: 10.1083/jcb.113.5.1203. [DOI] [PMC free article] [PubMed] [Google Scholar]
- 13.van Kooyk Y, van de Wiel-van Kemenade E, Weder P, Huijbens RJ, Figdor CG. Lymphocyte function-associated antigen 1 dominates very late antigen 4 in binding of activated T cells to endothelium. J Exp Med. 1993;177:185–190. doi: 10.1084/jem.177.1.185. [DOI] [PMC free article] [PubMed] [Google Scholar]
- 14.Oppenheimer-Marks N, Davis LS, Bogue DT, Ramberg J, Lipsky PE. Differential utilization of ICAM-1 and VCAM-1 during the adhesion and transendothelial migration of human T lymphocytes. J Immunol. 1991;147:2913–2921. [PubMed] [Google Scholar]
- 15.Shimizu Y, van Seventer GA, Horgan KJ, Shaw S. Roles of adhesion molecules in T-cell recognition: fundamental similarities between four integrins on resting human T cells (LFA-1, VLA-4, VLA-5, VLA-6) in expression, binding, and costimulation. Immunol Rev. 1990;114:109–143. doi: 10.1111/j.1600-065x.1990.tb00563.x. [DOI] [PubMed] [Google Scholar]
- 16.Nakajima H, Sano H, Nishimura T, Yoshida S, Iwamoto I. Role of vascular cell adhesion molecule 1/very late activation antigen 4 and intercellular adhesion molecule 1/lymphocyte function-associated antigen 1 interactions in antigen-induced eosinophil and T cell recruitment into the tissue. J Exp Med. 1994;179:1145–1154. doi: 10.1084/jem.179.4.1145. [DOI] [PMC free article] [PubMed] [Google Scholar]
- 17.Pelletier RP, et al. Importance of endothelial VCAM-1 for inflammatory leukocytic infiltration in vivo. J Immunol. 1992;149:2473–2481. [PubMed] [Google Scholar]
- 18.Palmer LD, et al. Telomere length, telomerase activity, and replicative potential in HIV infection: analysis of CD4+ and CD8+ T cells from HIV-discordant monozygotic twins. J Exp Med. 1997;185:1381–1386. doi: 10.1084/jem.185.7.1381. [DOI] [PMC free article] [PubMed] [Google Scholar]
- 19.Wolthers KC, et al. T cell telomere length in HIV-1 infection: no evidence for increased CD4+ T cell turnover. Science. 1996;274:1543–1547. doi: 10.1126/science.274.5292.1543. [DOI] [PubMed] [Google Scholar]
- 20.Harley CB, Futcher AB, Greider CW. Telomeres shorten during ageing of human fibroblasts. Nature. 1990;345:458–460. doi: 10.1038/345458a0. [DOI] [PubMed] [Google Scholar]
- 21.Allsopp RC, et al. Telomere length predicts replicative capacity of human fibroblasts. Proc Natl Acad Sci USA. 1992;89:10114–10118. doi: 10.1073/pnas.89.21.10114. [DOI] [PMC free article] [PubMed] [Google Scholar]
- 22.Allsopp RC, et al. Telomere shortening is associated with cell division in vitro and in vivo. Exp Cell Res. 1995;220:194–200. doi: 10.1006/excr.1995.1306. [DOI] [PubMed] [Google Scholar]
- 23.Effros RB, et al. Shortened telomeres in the expanded CD28-CD8+ cell subset in HIV disease implicate replicative senescence in HIV pathogenesis. AIDS. 1996;10:F17–F22. doi: 10.1097/00002030-199607000-00001. [DOI] [PubMed] [Google Scholar]
- 24.Sachsenberg N, et al. Turnover of CD4(+) and CD8(+) T lymphocytes in HIV-1 infection as measured by Ki-67 antigen. J Exp Med. 1998;187:1295–1303. doi: 10.1084/jem.187.8.1295. [DOI] [PMC free article] [PubMed] [Google Scholar]
- 25.Zhang ZQ, et al. Kinetics of CD4+ T cell repopulation of lymphoid tissues after treatment of HIV-1 infection. Proc Natl Acad Sci USA. 1998;95:1154–1159. doi: 10.1073/pnas.95.3.1154. [DOI] [PMC free article] [PubMed] [Google Scholar]
- 26.Hellerstein MK, McCune JM. T cell turnover in HIV-1 disease. Immunity. 1997;7:583–589. doi: 10.1016/s1074-7613(00)80379-9. [DOI] [PubMed] [Google Scholar]
- 27.Macallan DC, et al. Measurement of cell proliferation by labeling of DNA with stable isotope-labeled glucose: studies in vitro, in animals, and in humans. Proc Natl Acad Sci USA. 1998;95:708–713. doi: 10.1073/pnas.95.2.708. [DOI] [PMC free article] [PubMed] [Google Scholar]
- 28.Waterhouse P, et al. Lymphoproliferative disorders with early lethality in mice deficient in Ctla-4. Science. 1995;270:985–988. doi: 10.1126/science.270.5238.985. [DOI] [PubMed] [Google Scholar]
- 29.Karandikar NJ, Vanderlugt CL, Walunas TL, Miller SD, Bluestone JA. CTLA-4: a negative regulator of autoimmune disease. J Exp Med. 1996;184:783–788. doi: 10.1084/jem.184.2.783. [DOI] [PMC free article] [PubMed] [Google Scholar]
- 30.Sprent J, Webb SR. Function and specificity of T cell subsets in the mouse. Adv Immunol. 1987;41:39–133. doi: 10.1016/s0065-2776(08)60030-9. [DOI] [PubMed] [Google Scholar]
- 31.Sprent J, Schaefer M, Hurd M, Surh CD, Ron Y. Mature murine B and T cells transferred to SCID mice can survive indefinitely and many maintain a virgin phenotype. J Exp Med. 1991;174:717–728. doi: 10.1084/jem.174.3.717. [DOI] [PMC free article] [PubMed] [Google Scholar]
- 32.Tough DF, Sprent J. Turnover of naive and memory phenotype T cells. J Exp Med. 1994;179:1127–1136. doi: 10.1084/jem.179.4.1127. [DOI] [PMC free article] [PubMed] [Google Scholar]
- 33.Sprent J. Life spans of naive, memory and effector lymphocytes. Curr Opin Immunol. 1993;5:433–438. doi: 10.1016/0952-7915(93)90065-z. [DOI] [PubMed] [Google Scholar]
- 34.Ghobrial R, Boublik M, Winn H, Auchincloss H. In vivo use of monoclonal antibodies against murine T cell antigens. Clin Immunol Immunopathol. 1989;52:486–506. doi: 10.1016/0090-1229(89)90162-1. [DOI] [PubMed] [Google Scholar]
- 35.Rice JC, Bucy RP. Differences in the degree of depletion, rate of recovery, and the preferential elimination of naive CD4+ T cells by anti-CD4 monoclonal antibody (GK1.5) in young and aged mice. J Immunol. 1995;154:6644–6654. [PubMed] [Google Scholar]
- 36.Mackall CL, et al. Age, thymopoiesis, and CD4+ T-lymphocyte regeneration after intensive chemotherapy. N Engl J Med. 1995;332:143–149. doi: 10.1056/NEJM199501193320303. [DOI] [PubMed] [Google Scholar]
- 37.Mackall CL, et al. Distinctions between CD8+ and CD4+ T-cell regenerative pathways result in prolonged T-cell subset imbalance after intensive chemotherapy. Blood. 1997;89:3700–3707. [PubMed] [Google Scholar]
- 38.Moreland LW, et al. Treatment of refractory rheumatoid arthritis with a chimeric anti-CD4 monoclonal antibody: Long term followup of CD4+ T cell counts. Arthritis Rheum. 1994;37:834–838. doi: 10.1002/art.1780370610. [DOI] [PubMed] [Google Scholar]
- 39.Moreland LW, Bucy RP, Koopman WJ. Regeneration of T cells after chemotherapy. N Engl J Med. 1995;332:1651–1652. [PubMed] [Google Scholar]
- 40.Wong JK, et al. Recovery of replication-competent HIV despite prolonged suppression of plasma viremia. Science. 1997;278:1291–1295. doi: 10.1126/science.278.5341.1291. [DOI] [PubMed] [Google Scholar]
- 41.Finzi D, et al. Identification of a reservoir for HIV-1 in patients on highly active antiretroviral therapy. Science. 1997;278:1295–1300. doi: 10.1126/science.278.5341.1295. [DOI] [PubMed] [Google Scholar]
- 42.Butcher EC, Picker LJ. Lymphocyte homing and homeostasis. Science. 1996;272:60–66. doi: 10.1126/science.272.5258.60. [DOI] [PubMed] [Google Scholar]
- 43.Malone JL, et al. Abnormalities of morning serum cortisol levels and circadian rhythms of CD4+ lymphocyte counts in human immunodeficiency virus type 1-infected adult patients. J Infect Dis. 1992;165:185–186. doi: 10.1093/infdis/165.1.185. [DOI] [PubMed] [Google Scholar]
- 44.Malone JL, et al. Sources of variability in repeated T-helper lymphocyte counts from human immunodeficiency virus type 1-infected patients: total lymphocyte count fluctuations and diurnal cycle are important. J Acquir Immune Defic Syndr. 1990;3:144–151. [PubMed] [Google Scholar]
- 45.Kelleher AD, Carr A, Zaunders J, Cooper DA. Alterations in the immune response of human immunodeficiency virus (HIV)–infected subjects treated with an HIV-specific protease inhibitor, ritonavir. J Infect Dis. 1996;173:321–329. doi: 10.1093/infdis/173.2.321. [DOI] [PubMed] [Google Scholar]
- 46.Lederman MM, et al. Immunologic responses associated with 12 weeks of combination antiretroviral therapy consisting of zidovudine, lamivudine, and ritonavir: results of AIDS Clinical Trials Group Protocol 315. J Infect Dis. 1998;178:70–79. doi: 10.1086/515591. [DOI] [PubMed] [Google Scholar]
- 47.Autran B, et al. Positive effects of combined antiretroviral therapy on CD4+ T cell homeostasis and function in advanced HIV disease. Science. 1997;277:112–116. doi: 10.1126/science.277.5322.112. [DOI] [PubMed] [Google Scholar]
- 48.Andersson J, et al. Early reduction of immune activation in lymphoid tissue following highly active HIV therapy. AIDS. 1998;12:F123–F129. doi: 10.1097/00002030-199811000-00004. [DOI] [PubMed] [Google Scholar]
- 49.Hammer SM, et al. A controlled trial of two nucleoside analogues plus indinavir in persons with human immunodeficiency virus infection and CD4 cell counts of 200 per cubic millimeter or less. AIDS Clinical Trials Group 320 Study Team. N Engl J Med. 1997;337:725–733. doi: 10.1056/NEJM199709113371101. [DOI] [PubMed] [Google Scholar]
- 50.Gulick RM, et al. Treatment with indinavir, zidovudine, and lamivudine in adults with human immunodeficiency virus infection and prior antiretroviral therapy. N Engl J Med. 1997;337:734–739. doi: 10.1056/NEJM199709113371102. [DOI] [PubMed] [Google Scholar]


