Abstract
Purpose
To make a group comparison of diffusion tensor imaging (DTI) results of dystonia patients and controls to reveal occult pathology. We propose using an early registration method that produces sharper group images and enables us to do group tractography.
Materials and Methods
Twelve dystonia patients manifesting the disease, seven nonmanifesting dystonia mutation carriers (DYT1 and DYT6 gene mutations), and eight age-matched normal control subjects were imaged for a previous study. Early and late registration methods for DTI were compared. An early registration technique for a super set was proposed, in which the diffusion-weighted images were registered to a template, gradient vectors were reoriented for each subject, and they were combined into a super set before tensor calculation. The super set included images from all subjects and was useful for group comparisons. We used results obtained from the early registration of a super set for group analysis of tracts using the deterministic fiber-tracking technique.
Results
In dystonia mutation carriers, we detected fewer fibers in the cerebello-thalamo-cortical pathways. This result agrees well with the findings of a previous study that utilized a probabilistic tractography method and demonstrated that gene carriers have less fiber tracts in the disease-involved pathway.
Conclusion
This analysis visualized group level white matter fractional anisotropy and tract differences between dystonia patients and controls, and can be useful in understanding the pathophysiology of other nonfocal white matter diseases.
Keywords: MRI, DTI, dystonia, group tractography, registration
Diffusion Tensor Imaging (DTI) has been used extensively to visualize the white matter tracts. Based on the assumption that white matter fiber tracts are oriented along the direction of greatest diffusion, fiber-tracking follows the major eigenvector of diffusion tensor (1–6) and provides information about anatomical connectivity between regions in the brain. The group analysis of white matter tracts has been more difficult. The underlying vector field that is the basis for the tractography may yield incorrect tracts if the registration to a common template which is necessary for group analysis is done directly on the vector field.
Probabilistic tractography (7) and tract-based spatial statistic (TBSS) (8) have been developed for group analysis. TBSS uses spatial skeletons that represent the central parts of fiber bundles. In each subject high fractional anisotropy (FA) values were aligned to group FA skeleton and voxel-based morphometry was performed. However, this method could mix nearby information from different oriented tracts in the voxel coordinate system. Yushkevich et al (9) combined the spatial skeleton and fiber approaches to detect significant clusters between apparent diffusion coefficient of groups. A tract-based morphometry (10) method analyzed statistically of medical image data in a white matter tract coordinate system. Goodlett et al (11) used multivariate tensor measure and tract-oriented statistics for a single hypothesis test per tract.
Another approach to analyze group tractography is based on spatial normalization (12–19). In addition to spatial normalization of a diffusion tensor dataset, Jones et al (14) computed the average of the distribution of tensors within each voxel, while Xu et al (15) proposed a method for tensor reorientation that depends on knowledge of the underlying fiber direction and also averaged the tensor component-wise at each voxel. In Muller et al (19), the diffusion tensor was aligned by rotation to the main gradient directions when the DTI datasets were normalized to a template. The spatial normalization approach uses arithmetic averaging of all normalized single-subject DTI datasets to generate an averaged DTI dataset.
Instead of using the averaged DTI dataset and reoriented tensor, we describe an early registration technique (20) where the diffusion-weighted images (DWIs) are registered to a template and gradient vectors are reoriented (21) before tensor calculation for group analysis of tracts or analysis of multiple subject diffusion imaging using deterministic fiber-tracking techniques.
We applied this method to a previously acquired dataset from dystonia patients that used probabilistic tractography for group analysis (22). Primary torsion dystonia (PTD) is a chronic movement disorder manifesting clinically as focal or generalized sustained muscle contractions, postures, or involuntary movements (23). The clinical magnetic resonance (MR) images do not show any pathology in this disorder. The most common inherited form of PTD is associated with the DYT mutation (24). Prior studies using DTI have shown reduced fractional anisotropy (FA) in the subgyral white matter and in the vicinity of the superior cerebellar peduncle in DYT carriers (25). PTD is thought to be a neurodevelopmental disorder affecting motor circuits (particularly striato-thalamic and cerebellar pathways) (22). DTI has an exquisite ability to visualize the white matter pathways and may be useful in understanding the underlying pathology in this disease. We employed an early registration technique for group tractography comparison in dystonia gene carriers and control subjects where all subjects have normal-looking brains without obvious pathology.
We first compared the FA images obtained by early registration to the FA images obtained by late registration to verify the validity of the approach. Showing that these two methods are equivalent for group comparisons, we proposed the early registration method for a super set. We then proceeded to describe the group tractography using early registration.
MATERIALS AND METHODS
Subjects and Data Acquisition
We imaged 12 disease-manifesting dystonia patients. Seven of them had the DYT1 mutation, and five of them had the DYT6 mutation. We also imaged seven dystonia gene carriers without disease manifestations. Three of them carried the DYT1 mutation and four of them had the DYT6 mutation. We imaged eight age-matched normal subjects as controls. All subjects were imaged using a clinical 3T scanner (22) with a single-shot EPI diffusion-weighted sequence. DWIs of these subjects were acquired in 55 directions with a b-value of 1000 s/mm2. The diffusion tensor protocol included: 72 slices, 1.8 mm thickness, field of view (FOV) 230 × 230 mm2, data acquisition matrix of 128 × 128 zero-filled to 256 × 256, TR 7000 msec, and TE 68.3 msec. The apparent resolution of the DWIs was 0.9 mm × 0.9 mm × 1.8 mm.
Data Analysis
After DTI data acquisition, diffusion images were processed using FSL routines (http://www.fmrib.ox.ac.uk/fsl/). After eddy current correction, brain tissue was extracted using the BET routine. We used three different methods in calculating the diffusion tensor for each subject:
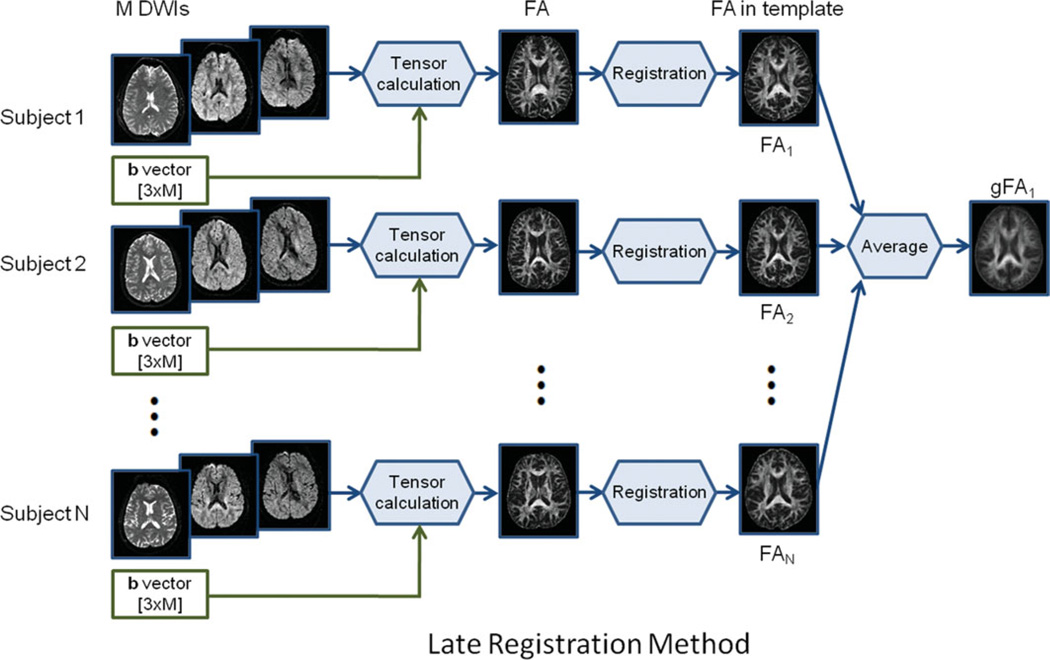
Late registration for single subject analysis: We calculated diffusion tensor components for each pixel for each subject. We then calculated the FA maps for individual subjects. The FA maps were then registered to the standard template with a resolution of 1 × 1 × 1 mm3. A late registration group FA map (gFA1) was obtained by taking the average of the FA maps of individual subjects in standard space. The late registration method is shown in Fig. 1.
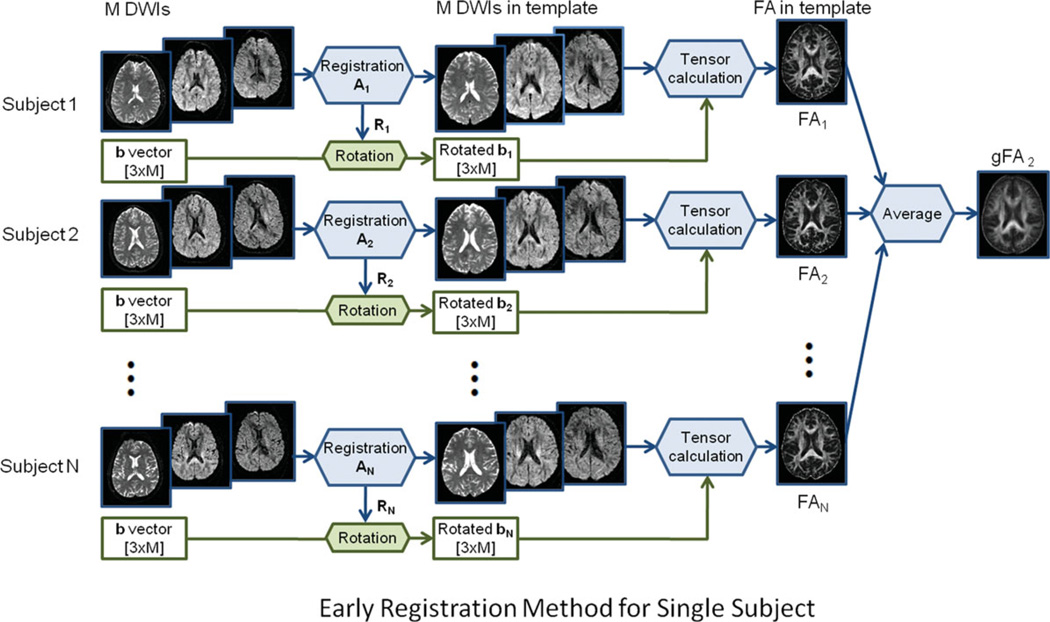
Early registration for single subject analysis: DWIs of each subject were registered to the standard image template using 12-parameter affine registration and then their diffusion gradient vectors were reoriented according to their own rotation matrix. We then calculated the tensor components and FA maps for each subject. To get an early registration group FA map (gFA2), we took the average of the FA maps of individual subjects. This early registration method is shown in Fig. 2. The FA maps of individual subjects were then used for group analysis.
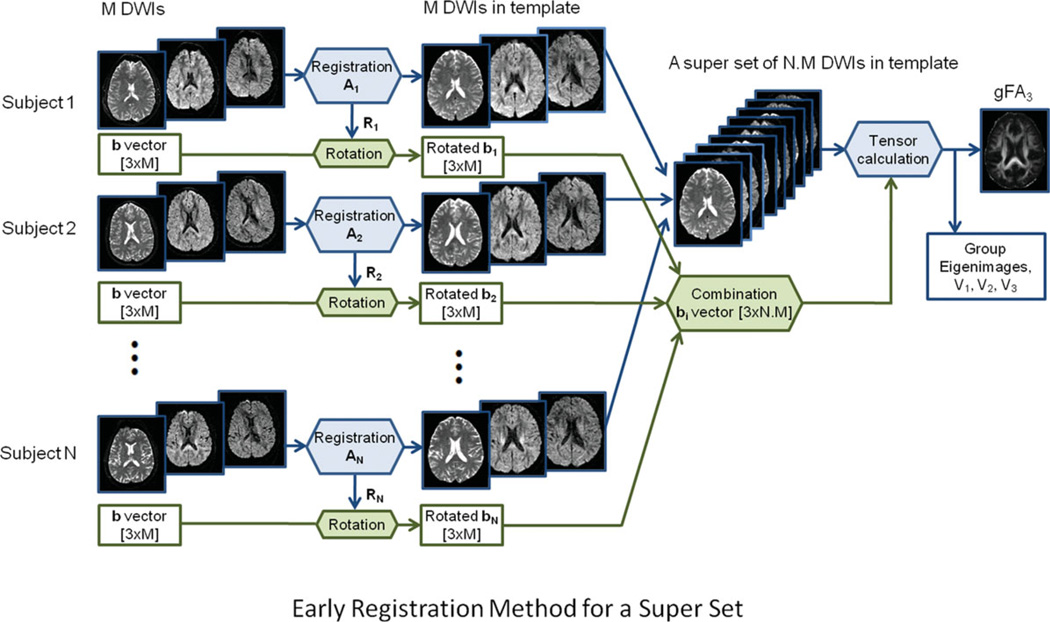
Early registration for a super set: Similar to the early registration for single-subject analysis above, all DWIs were registered to the standard image template. Instead of separately calculating the tensor for each subject, DWIs in standard space of all subjects were combined, and rotated diffusion gradient vectors were also combined so that they can be processed as a super dataset. After tensor calculation for a super set, we obtained the FA image of the super set which is the group FA map (gFA3). We also calculated other group diffusion images such as group eigen images and group eigen vector images. The early registration method for a super set is shown in Fig. 3.
Figure 1.
Schematic diagram of the late registration method. [Color figure can be viewed in the online issue, which is available at wileyonlinelibrary.com.]
Figure 2.
Schematic diagram of the early registration method for single-subject analysis. [Color figure can be viewed in the online issue, which is available at wileyonlinelibrary.com.]
Figure 3.
Schematic diagram of the early registration method for multiple subjects. [Color figure can be viewed in the online issue, which is available at wileyonlinelibrary.com.]
Group Comparisons Using SPM
Once aligned, the FA images were smoothed using a kernel of 5 mm (full-width at half-maximum [FWHM]) and groups were compared voxel-wise over the entire brain volume using SPM software (http://www.fil.ion.ucl.ac.uk/spm/software/spm8/). Using the same control subjects, we compared the FA maps obtained from the early and late methods. FA maps of healthy control and patient groups were also compared in both cases of late and early registration. Group differences were considered significant at a voxel-level threshold of P < 0.005.
Group Tractography
Among all three methods, only the early registration technique for a super set yields group of tensor images for computing group tractography and a group FA image. The late and early registration for single-subject methods both yield group FA images only. We used seven subjects for group tractography in each of three groups including the control group, dystonia gene mutation carriers manifesting the disease (MANDYT), and dystonia gene carriers not-manifesting the disease (NM-DYT). Equal numbers of DWI images (n × 55), where n is the number of subjects, were used in tensor fitting for each group to have an unbiased comparison of group tractography. Since the NM-DYT group has seven subjects, we used 7 × 55 DWI images into DTI fitting and tractography calculation for each group. We used the TrackVis software (http://www.trackvis.org/) to map white matter pathways coursing between volumes of interest (VOIs) delineated in the gene mutation carrying subjects and controls. Fiber tracking parameters were kept identical for all three groups. The significant cluster in sensorimotor cortex (SMC) identified by voxel-based comparison of the FA maps for the control and NM-DYT groups was employed as a seed volume for tractography. The cerebellum and thalamus regions obtained from brain anatomy were used as two other seed volumes.
Group Fiber Tracking in Standard Space
In this early registration technique, the diffusion-weighted images are registered to a template and gradient vectors are reoriented before the tensor calculation for group analysis of tracts.
For each subject in a group of N, the signal intensity in each voxel of DWIs is with M gradient directions ḡij = [gxgygz]T, where i = 1,2,…,N, j = 1,2,…,M. The S0 represents the signal obtained without diffusion weighting gradients, S represents the measured signal, and is the symmetric diffusion tensor matrix. b0 is the diffusion weighting and can be calculated over a pair of gradients as: , where γ is the gyromagnetic ratio for the hydrogen nucleus, δ is the duration of the diffusion weighting gradients, and Δ is the separation in time of the two gradient pulses (26).
After eddy current correction in FSL (http://www.fmrib.ox.ac.uk/fsl/), all S0i images from all subjects were registered to the standard image template by an affine transformation matrix Ai. Then this transformation matrix Ai was applied to all other DWIs (Sij) of the same subject i.
Since all DWIs are now in a standard space, their diffusion gradient vectors have to be reoriented next according to their own rotation matrix Ri as , where Ri is calculated from the affine transformation matrix, Ai = Ti.Ri.Ki.Si, where T is the translation matrix, K is the skew matrix, and S is the scale matrix. This reorienting of the gradient vectors from the rotation matrix extracted from the affine transformation is valid since the affine transformation involved is very close to a similarity transformation, ie, rigid + uniform scaling. When there is considerable shearing and nonuniform scaling involvement, the reorientation can be a poor approximation (13). All dystonia subjects have normal-looking brains with no atrophy. There were not many intersubject differences in their anatomy, hence nonlinear transformation (27) was not necessary.
After the above steps, a super dataset including L = M × N DWIs with was obtained in standard space with corrected gradient vectors. So all DWIs can now be processed as a single dataset to reconstruct all group diffusion measurements in DTI such as fractional anisotropy (FA), apparent diffusion coefficient (ADC) and tensor components.
We merged M × N DWIs as a 4D super dataset and created a large diffusion gradient table in the order of DWIs as follows:
And then tensor calculations were performed to reconstruct all group diffusion measurements from the above super dataset and gradient table.
Group fiber reconstruction was based on group DTI obtained from the tensor calculation for a super set as in the previous step and on the assumption that fiber-tracking follows the major eigenvector of group diffusion tensor in each voxel.
We called this method early registration for a super set because all DWIs are registered to template before tensor calculation. It is different from other registration methods (“late” registration methods) in which tensor components are computed first, and then they are registered to template. Therefore, in late registration methods, diffusion gradient vectors will not be reoriented.
RESULTS
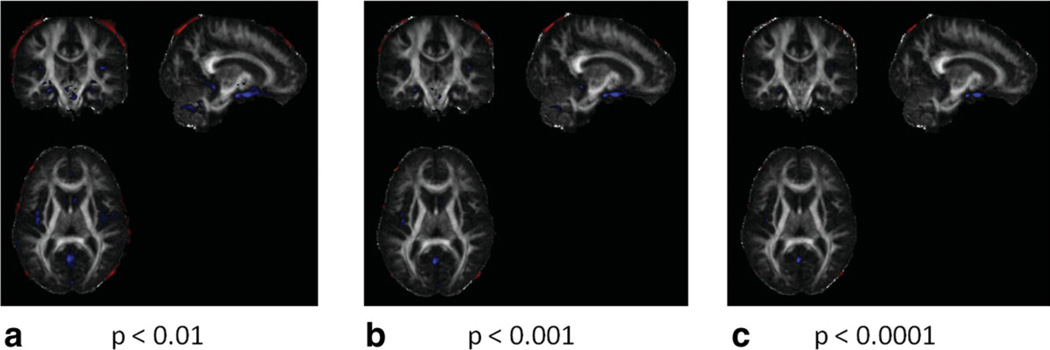
From the three schematic diagrams in Figs. 1–3, group FA maps gFA1, gFA2, and gFA3 were obtained corresponding to three methods: late registration, early registration for single subject, and early registration for a super set, respectively. In Fig. 4, FA maps of all control subjects obtained using late and early registration for single-subject methods were compared using SPM. Significant FA differences were shown at voxel-level thresholds of P < 0.01, P < 0.001, and P < 0.0001 in Fig. 4. The red areas visualize the regions where early registration method yields higher FA values. The blue regions depict decreased FA in the early registered data when compared with the late registered data. All significantly different regions between the two methods are either on the edge of the brain or at the low FA voxels.
Figure 4.
Comparison of the late registration and early registration methods using SPM. Regions in which FA values of early registration are greater than those of late registration are presented in red and regions in which FA values of early registration are smaller than those of late registration are presented in blue. All FA images were smoothed using a 5 mm kernel before comparison. a: P < 0.01. b: P < 0.001. c: P < 0.0001. [Color figure can be viewed in the online issue, which is available at wileyonlinelibrary.com.]
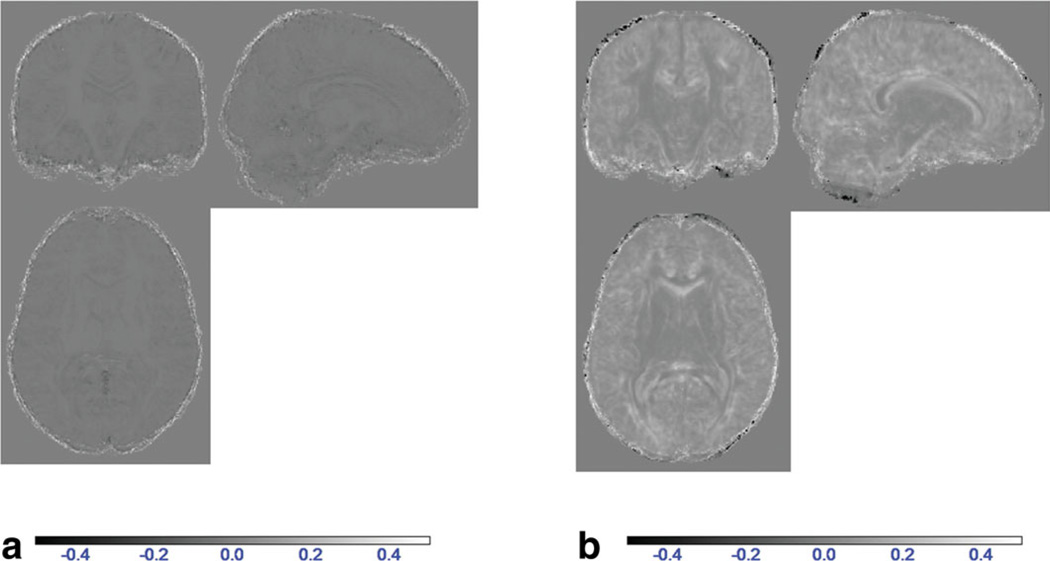
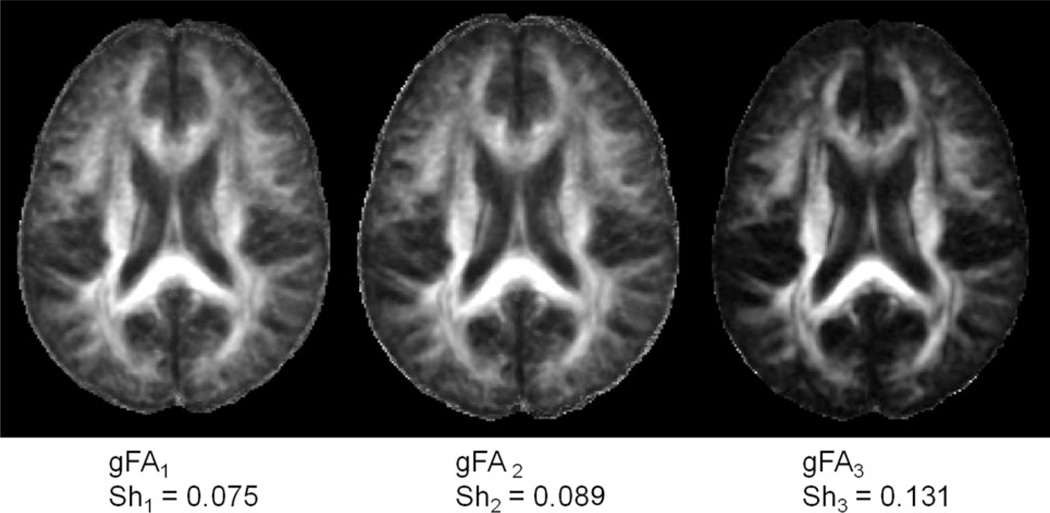
Figure 5a,b shows the difference group FA images. Figure 5a shows (gFA2 – gFA1) minimal contrast inside the brain, suggesting the equivalence of early and late registered single subject FA maps in agreement with the SPM comparison of Fig. 4. In Fig. 5b, there is considerable image contrast inside the brain. Figure 6 shows the group FA images obtained from all three methods. Their sharpness measures are obtained using Eq. 2 (Appendix). The group FA image gFA3 (group FA for a super set) yielded the best sharpness of 0.131, while gFA1 using late registration group and gFA2 using early registration for single subject yielded sharpness values of 0.075 and 0.089, respectively.
Figure 5.
Comparison of the late registration and early registration methods by group FA subtraction. gFA1: Late registration group FA; gFA2: Early registration group FA; gFA3: Early registration group FA of the superset. a: gFA2 – gFA1. b: gFA2 – gFA3. [Color figure can be viewed in the online issue, which is available at wileyonlinelibrary.com.]
Figure 6.
Group FA images. The gFA3 is the sharpest image with a measured sharpness of Sh3 = 0.131, while gFA1 and gFA2 have sharpness measures of Sh1 = 0.075 and Sh2 = 0.089, respectively. a: Late registration method, gFA1. b: Early registration for single subject, gFA2. c: Early registration for a superset, gFA3.
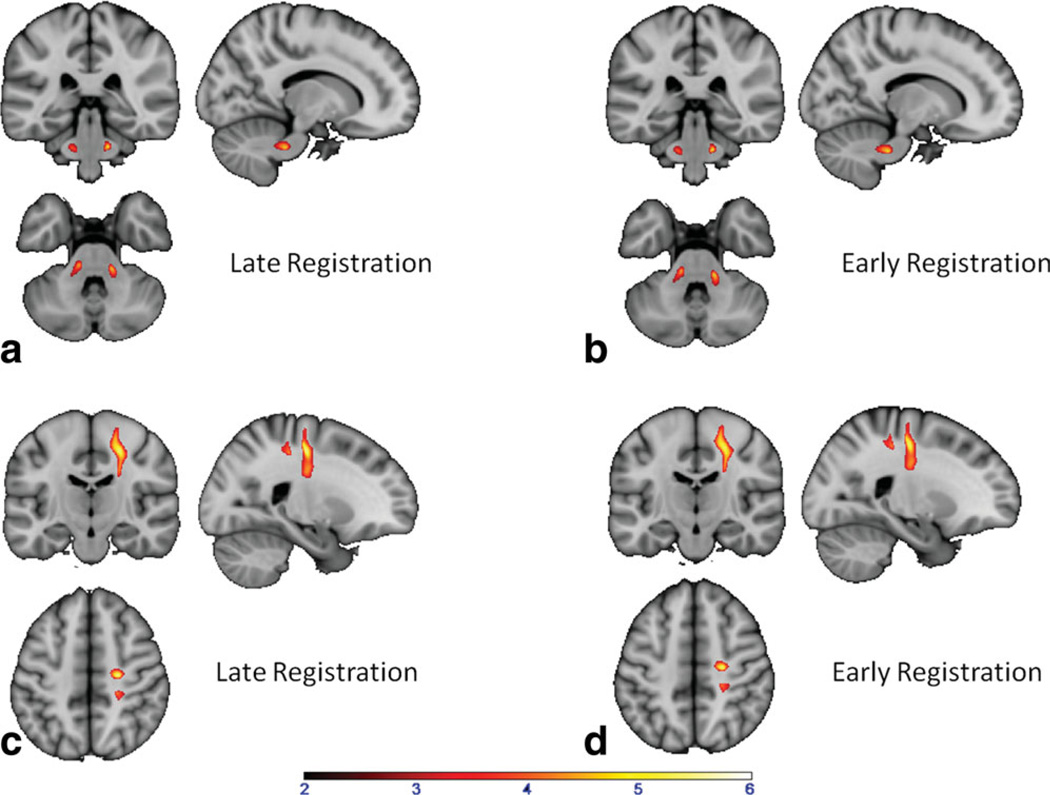
In Fig. 7 the SPM comparison of healthy controls and dystonia gene mutation carriers are shown. SPM analysis showed that when the early registration method was used, the significant regions, in which FA values in healthy control subjects are higher than in dystonia patients (NM and MAN) are found in the same location as when the late registration was used. In the late registration method, we obtained two significant clusters of 350 voxels on the right and 333 voxels on the left, as shown in Fig. 7a. Using the early registration method, we obtained the same two significant clusters (387 voxels on the right and 299 voxels on the left) in approximately the same location as the late registration method in Fig. 7b. The locations of these clusters agree with previously published results (22,25,28). The SPM comparison result of the healthy control group and the NM-DYT group only is shown in Fig. 7c,d. Cluster sizes are 2303 and 2375 corresponding to late and early methods, respectively. This finding agrees with previously published results (22).
Figure 7.
SPM comparison of the late registration and early registration methods by observing significantly different regions in control subjects and in patients. a: Control and dystonia gene carrier (both NM and MAN) group comparison using late registration FA results. Two symmetric regions in the cerebellar peduncle had significantly decreased FA in the patient group. b: Control and dystonia gene carrier group comparison using early registration FA results (early registration method for single subject), showing the same two cerebellar regions as in (a). c: Control and NM-DYT group comparison using late registration FA results, showing a decreased FA region in the sensory-motor cortex in the patient group. d: Control and NM-DYT group comparison using early registration FA results, showing a decreased FA region in the sensory-motor cortex in the patient group (same region as in c). [Color figure can be viewed in the online issue, which is available at wileyonlinelibrary.com.]
Group fractional anisotropy (gFA3) and eigenvector image V1 obtained from the early registration method for a super set (Fig. 3) were used for tract reconstruction in Fig. 8. A 3D plot of the tracts originating in the cerebellum going through the thalamus and connecting to the sensorimotor cortex (cerebello-thalamo-cortical pathway) is shown. These tracts are involved in the disease process. In dystonia gene mutation carriers, using the same FA threshold and all other settings, such as seed volume, we were able to visualize fewer fibers in the cerebello-thalamo-cortical pathways regardless of the diffusion anisotropy thresholds used. The number of fiber tracts in the healthy control group is 3976, while it is 1945 in NM-DYT and 2938 in MAN-DYT, as shown in Fig. 8. This result agrees well with a previous study utilizing the probabilistic tractography method where gene carriers were found to have fewer fiber tracts in the disease-involved pathway (22). This finding suggests that there is more damage in the cerebello-thalamo-cortical pathway of the NM-DYT group than the MAN-DYT group. The excess damage can be considered neuroprotective since it serves to attenuate the excess neuronal signal to the cortex, hence in the NM-DYT group, dystonia does not manifest.
Figure 8.
Group tractography results for each group. a: Control group has the highest fiber tract counts (3976). b: NM-DYT group has the lowest fiber tract counts (1945). c: MAN-DYT group has 2938 tract counts. [Color figure can be viewed in the online issue, which is available at wileyonlinelibrary.com.]
Table 1 shows the mean and standard deviation values of group FA values measured over the segmented SPM brain template. The difference measurements show that in each tissue type measured the FA values are such that gFA1 > gFA 2> gFA3. Since the FA is signal-to-noise ratio (SNR)-dependent (29–30), this may suggest that SNR of gFA3 > SNR of gFA2 > SNR of gFA1.
Table 1.
FA Values Measured Over the Entire Segmented Brain From SPM Template for Each Group of Subjects
| All white matter (N = 232248; 36%) Mean ± SD |
All gray matter (N = 346888; 55%) Mean ± SD |
CSF (N = 55475; 9%) Mean ± SD |
|
|---|---|---|---|
| Control | |||
| gFA1 | 0.434 ± 0.113 | 0.200 ± 0.068 | 0.143 ± 0.102 |
| gFA2 | 0.418 ± 0.116 | 0.178 ± 0.068 | 0.129 ± 0.096 |
| gFA3 | 0.344 ± 0.139 | 0.115 ± 0.072 | 0.069 ± 0.072 |
| gFA1 – gFA2 | 0.0159 ± 0.0082 | 0.0217 ± 0.0168 | 0.0136 ± 0.0408 |
| gFA2 – gFA3 | 0.0735 ± 0.0426 | 0.0633 ± 0.0421 | 0.0604 ± 0.0625 |
| NM-DYT | |||
| gFA1 | 0.418 ± 0.115 | 0.210 ± 0.068 | 0.142 ± 0.096 |
| gFA2 | 0.402 ± 0.117 | 0.187 ± 0.068 | 0.127 ± 0.088 |
| gFA3 | 0.333 ± 0.138 | 0.117 ± 0.071 | 0.068 ± 0.067 |
| gFA1 – gFA2 | 0.0159 ± 0.0083 | 0.0233 ± 0.0188 | 0.0145 ± 0.0404 |
| gFA2 – gFA3 | 0.0691 ± 0.0391 | 0.0692 ± 0.0391 | 0.0593 ± 0.0575 |
| MAN-DYT | |||
| gFA1 | 0.409 ± 0.105 | 0.196 ± 0.065 | 0.139 ± 0.098 |
| gFA2 | 0.393 ± 0.107 | 0.177 ± 0.066 | 0.127 ± 0.092 |
| gFA3 | 0.316 ± 0.129 | 0.115 ± 0.071 | 0.067 ± 0.065 |
| gFA1 – gFA2 | 0.0160 ± 0.0084 | 0.0199 ± 0.0191 | 0.0122 ± 0.0377 |
| gFA2 – gFA3 | 0.0769 ± 0.0434 | 0.0617 ± 0.0424 | 0.0591 ± 0.0580 |
N: Number of pixels in each region.
DISCUSSION
The group analysis of diffusion tensor tractography maps exhibited parts of the motor pathways involved in two groups of dystonia patients. In dystonia gene mutation carriers, we detected fewer fibers in the cerebello-thalamo-cortical pathways. This result agrees with previous findings found using probabilistic tractography (22). The disruption of the outgoing pathways could lead to cortical hyperactivation, which is characteristic of dystonia. There is an increasing amount of evidence suggesting the involvement of cerebellum in this disease (31).
When used for single subjects, the early registration method did not differ significantly from the commonly used late registration method. SPM analysis showed FA differences only in the edges (out of brain) because of imperfect masking, and in low FA regions because of imperfect fitting of the tensor model. Since SPM analysis requires lowpass filtering of the images prior to group analysis, any advantage that late registration may offer in terms of image sharpness was lost.
The results in Figs. 4, 5, and 7 and Table 1 all suggest that the late and early registration methods when used for single-subject FA maps are equivalent. The significant regions in which the FA values in healthy control subjects are higher than in dystonia patients (NM and MAN) and in which FA values in healthy control subjects are higher than NM-DYT only are almost the same size and at the same coordinates when late and early registration methods were used.
When group FA images are compared, considerable differences among gFA1, gFA2, and gFA3 were observed. The gFA3 is sharper than the others. The measured sharpness of this image is Sh3 = 0.131, while the measured sharpness of gFA1 is Sh1 = 0.075 and of gFA2 is Sh2 = 0.089. These sharpness measurements correlate well with perceptual sharpness. Since averaging is a form of lowpass filtering, gFA1 and gFA2 lost some high-frequency information during the averaging process, as shown in Fig. 6. Early registration for a super set can better contain the high frequency information from all subjects and can have a better SNR for the tensor fitting model. Table 1 shows that for all subject groups, FA measured from cerebrospinal fluid (CSF) is lowest in gFA3 and is about the same as its standard deviation. The average FA value of 0.069 measured from CSF in gFA3 of the control group, which approximates the standard deviation (0.072) of this measurement. The FA values measured from CSF in gFA1 and gFA2 are much higher (0.143 in gFA1 and 0.129 in gFA2) in magnitude, and also higher than the standard deviation of each individual measurement (0.102 in gFA1 and 0.096 in gFA2). This suggests that in gFA1 and gFA2, the measurements report artifactual FA values in CSF. The group FA measurement using early registration method for a super set does not report any artifactual FA in CSF, and hence is more accurate than the other two methods. This is also true for CSF FA measurements from the other subject groups (NM-DYT and MAN-DYT).
In conclusion, we propose an early registration method that provides FA images equivalent to the ones that can be obtained from the commonly used late registration methods for a given single subject. This early registration method can be utilized for group analysis and yields better group FA images. The newly proposed super set method can also be utilized for group tractography. Here we utilized the early registration method of a super set for group tractography in dystonia gene carriers and controls. This new analysis visualized group white matter tract differences among control, NM-DYT, and MAN-DYT groups. This method can be useful in understanding the pathophysiology of nonfocal white matter diseases and in the discovery of brain pathways that are involved in disease processes. This method can also be useful in animal models of the diseases where there is no gross pathology present (31).
Figure A1.
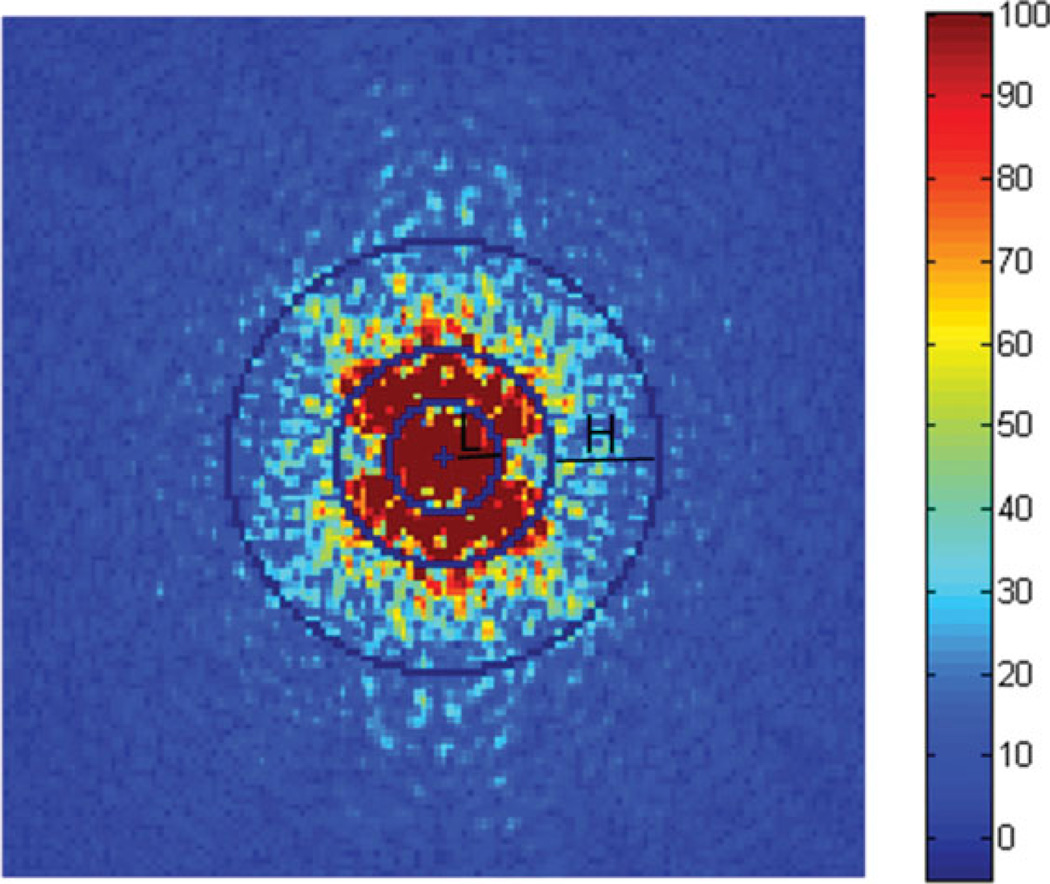
Fourier transformed group FA image. In this image the low frequencies are in the center, and the high frequencies are in the periphery. L is the lowpass sub-band with 0 < rL ≤ 8 and H is the highpass sub-band with 16 ≤ rH ≤ 32.
ACKNOWLEDGMENT
We thank Dr. Maren Carbon-Correll for valuable discussions and acquisition of images.
Contract grant sponsor: National Institutes of Health; Contract grant number: RO1 NS 072514.
APPENDIX
In order to determine the sharpness of an image by comparing the amount of energy in the high frequency range to low frequency range, the image first needs to be Fourier transformed. Given an image f(m,n) with a size of 256 × 256, the discrete Fourier transform (DFT) F(p,q) of f(m,n) is defined by:
where − 127 < p ≤ 128 and − 127 < q ≤ 128. Figure A1 shows the 2D Fourier transformed image of a group FA map. In this Fourier transformed image, while the center holds the low frequency information, the periphery visualizes the high frequency information content of the FA image. We define a sharpness measure as the ratio of energy in the highpass sub-band to energy in the lowpass sub-band, as follows (33):
where EH = ∑H |F (p,q) |2, EL = ∑L |F(p,q) |2. H is the area on the periphery of the frequency domain image Hð(16 ≤ rH ≤ 32) and is defined as highpass band; and L is in the center of the frequency domain image L(0 ≤ rL ≤ 8) and is defined as low bandpass sub-band as shown in Fig. A1, where r2 = p2 + q2. The zero frequency (center of the frequency domain image, denoted by a cross in Fig. A1) is excluded from the lowpass sub-band (32).
REFERENCES
- 1.Conturo TE, Lori NF, Cull TS, et al. Tracking neuronal fiber pathways in the living human brain. Proc Natl Acad Sci U S A. 1999;96:10422–10427. doi: 10.1073/pnas.96.18.10422. [DOI] [PMC free article] [PubMed] [Google Scholar]
- 2.Mori S, Crain BJ, Chacko VP, van Zijl PC. Three-dimensional tracking of axonal projections in the brain by magnetic resonance imaging. Ann Neurol. 1999;45:265–169. doi: 10.1002/1531-8249(199902)45:2<265::aid-ana21>3.0.co;2-3. [DOI] [PubMed] [Google Scholar]
- 3.Basser PJ, Pajevic S, Pierpaoli C, Duda J, Aldroubi A. In vivo fiber tractography using DT-MRI data. Magn Reson Med. 2000;44:625–632. doi: 10.1002/1522-2594(200010)44:4<625::aid-mrm17>3.0.co;2-o. [DOI] [PubMed] [Google Scholar]
- 4.Mori S, van Zijl PC. Fiber tracking: principles and strategies—a technical review. NMR Biomed. 2002;15:468–480. doi: 10.1002/nbm.781. [DOI] [PubMed] [Google Scholar]
- 5.Watts R, Liston C, Niogi S, Uluğ AM. Fiber tracking using magnetic resonance diffusion tensor imaging and its applications to human brain development. Ment Retard Dev Disabil Res Rev. 2003;9:168–177. doi: 10.1002/mrdd.10077. [DOI] [PubMed] [Google Scholar]
- 6.Faria AV, Oishi K, Mori S. Study of white matter anatomy and 3D tract reconstruction by diffusion tensor imaging. Int J Imaging Syst Technol Special Issue on Neuroimaging, Part I. 2010;20:51–56. [Google Scholar]
- 7.Jbabdi S, Woolrich MW, Andersson JL, Behrens TE. A Bayesian framework for global tractography. Neuroimage. 2007;37:116–129. doi: 10.1016/j.neuroimage.2007.04.039. [DOI] [PubMed] [Google Scholar]
- 8.Smith SM, Jenkinson M, Johansen-Berg H, et al. Tract-based spatial statistics: voxelwise analysis of multi-subject diffusion data. Neuroimage. 2006;31:1487–1505. doi: 10.1016/j.neuroimage.2006.02.024. [DOI] [PubMed] [Google Scholar]
- 9.Yushkevich PA, Zhang H, Simon TJ, Gee JC. Structure-specific statistical mapping of white matter tracts. Neuroimage. 2008;41:448–461. doi: 10.1016/j.neuroimage.2008.01.013. [DOI] [PMC free article] [PubMed] [Google Scholar]
- 10.O’Donnell LJ, Westin CF, Golby AJ. Tract-based morphometry for white matter group analysis. Neuroimage. 2009;45:832–844. doi: 10.1016/j.neuroimage.2008.12.023. [DOI] [PMC free article] [PubMed] [Google Scholar]
- 11.Goodlett CB, Fletcher PT, Gilmore JH, Gerig G. Group analysis of DTI fiber tract statistics with application to neurodevelopment. Neuroimage. 2009;45:S133–S142. doi: 10.1016/j.neuroimage.2008.10.060. [DOI] [PMC free article] [PubMed] [Google Scholar]
- 12.Ashburner J, Friston KJ. Nonlinear spatial normalization using basis functions. Hum Brain Mapp. 1999;7:254–266. doi: 10.1002/(SICI)1097-0193(1999)7:4<254::AID-HBM4>3.0.CO;2-G. [DOI] [PMC free article] [PubMed] [Google Scholar]
- 13.Alexander DC, Pierpaoli C, Basser PJ, Gee JC. Spatial transformations of diffusion tensor magnetic resonance images. IEEE Trans Med Imaging. 2001;20:1131–1139. doi: 10.1109/42.963816. [DOI] [PubMed] [Google Scholar]
- 14.Jones DK, Griffin LD, Alexander DC, et al. Spatial normalization and averaging of diffusion tensor MRI data sets. Neuroimage. 2002;17:592–617. [PubMed] [Google Scholar]
- 15.Xu D, Mori S, Shen D, van Zijl PC, Davatzikos C. Spatial normalization of diffusion tensor fields. Magn Reson Med. 2003;50:175–182. doi: 10.1002/mrm.10489. [DOI] [PubMed] [Google Scholar]
- 16.Park HJ, Kubicki M, Shenton ME, et al. Spatial normalization of diffusion tensor MRI using multiple channels. Neuroimage. 2003;20:1995–2009. doi: 10.1016/j.neuroimage.2003.08.008. [DOI] [PMC free article] [PubMed] [Google Scholar]
- 17.Park HJ, Westin CF, Kubicki M, et al. White matter hemisphere asymmetries in healthy subjects and in schizophrenia: a diffusion tensor MRI study. Neuroimage. 2004;23:213–223. doi: 10.1016/j.neuroimage.2004.04.036. [DOI] [PMC free article] [PubMed] [Google Scholar]
- 18.Zhang J, Evans A, Hermoye L, et al. Evidence of slow maturation of the superior longitudinal fasciculus in early childhood by diffusion tensor imaging. Neuroimage. 2007;38:239–247. doi: 10.1016/j.neuroimage.2007.07.033. [DOI] [PMC free article] [PubMed] [Google Scholar]
- 19.Muller HP, Unrath A, Ludolph AC, Kassubek J. Preservation of diffusion tensor properties during special normalization by use of tensor imaging and fibre tracking on normal brain database. Phys Med Biol. 2007;52:N99–N109. doi: 10.1088/0031-9155/52/6/N01. [DOI] [PubMed] [Google Scholar]
- 20.Ulug AM, Argyelan M, Niethammer M, Eidelberg D. Group analysis of tractography images using early registration in primary dystonia patients. Proc 17th Annual Meeting ISMRM, Honolulu. 2009:1178. [Google Scholar]
- 21.Leemans A, Jones DK. The B-matrix must be rotated when correcting for subject motion in DTI data. Magn Reson Med. 2009;61:1336–1149. doi: 10.1002/mrm.21890. [DOI] [PubMed] [Google Scholar]
- 22.Argyelan M, Carbon M, Niethammer M, et al. Cerebellothalamo-cortical connectivity regulates penetrance in dystonia. J Neurosci. 2009;29:9740–9747. doi: 10.1523/JNEUROSCI.2300-09.2009. [DOI] [PMC free article] [PubMed] [Google Scholar]
- 23.Tarsy D, Simon DK. Dystonia. N Engl J Med. 2006;355:818–829. doi: 10.1056/NEJMra055549. [DOI] [PubMed] [Google Scholar]
- 24.Bressman SB. Dystonia genotypes, phenotypes, and classification. Adv Neurol. 2004;94:101–107. [PubMed] [Google Scholar]
- 25.Carbon M, Kingsley PB, Tang C, Bressman SB, Eidelberg D. Microstructural white matter changes in primary torsion dystonia. Mov Disord. 2008;23:234–239. doi: 10.1002/mds.21806. [DOI] [PMC free article] [PubMed] [Google Scholar]
- 26.Le Bihan D. Diffusion and perfusion magnetic resonance imaging. New York: Raven Press; 1995. [Google Scholar]
- 27.Zhang H, Yushkevich PA, Alexander DC, Gee JC. Deformable registration of diffusion tensor MR images with explicit orientation optimization. Med Image Anal. 2006;10:764–785. doi: 10.1016/j.media.2006.06.004. [DOI] [PubMed] [Google Scholar]
- 28.Carbon M, Argyelan M, Eidelberg D. Functional imaging in hereditary dystonia. Eur J Neurol. 2010;17(Suppl 1):58–64. doi: 10.1111/j.1468-1331.2010.03054.x. [DOI] [PMC free article] [PubMed] [Google Scholar]
- 29.Bastin ME, Armitage PA, Marshall I. A theoretical study of the effect of experimental noise on the measurement of anisotropy in diffusion imaging. Magn Reson Imaging. 1998;16:773–785. doi: 10.1016/s0730-725x(98)00098-8. [DOI] [PubMed] [Google Scholar]
- 30.Farrell JA, Landman BA, Jones CK, et al. Effects of signal-to-noise ratio on the accuracy and reproducibility of diffusion tensor imaging-derived fractional anisotropy, mean diffusivity, and principal eigenvector measurements at 1.5 T. J Magn Reson Imaging. 2007;26:756–767. doi: 10.1002/jmri.21053. [DOI] [PMC free article] [PubMed] [Google Scholar]
- 31.Ulug AM, Vo A, Argyelan M, et al. Cerebello-thalamo-cortical pathway abnormalities in torsinA DYT1 knock-in mice. Proc Natl Acad Sci U S A. 2011;108:6638–6643. doi: 10.1073/pnas.1016445108. [DOI] [PMC free article] [PubMed] [Google Scholar]
- 32.Shaked D, Tastl I. Sharpness measure: towards automatic image enhancement. IEEE International Conference on Image Processing (ICIP) 2005;1(I):937–940. [Google Scholar]


