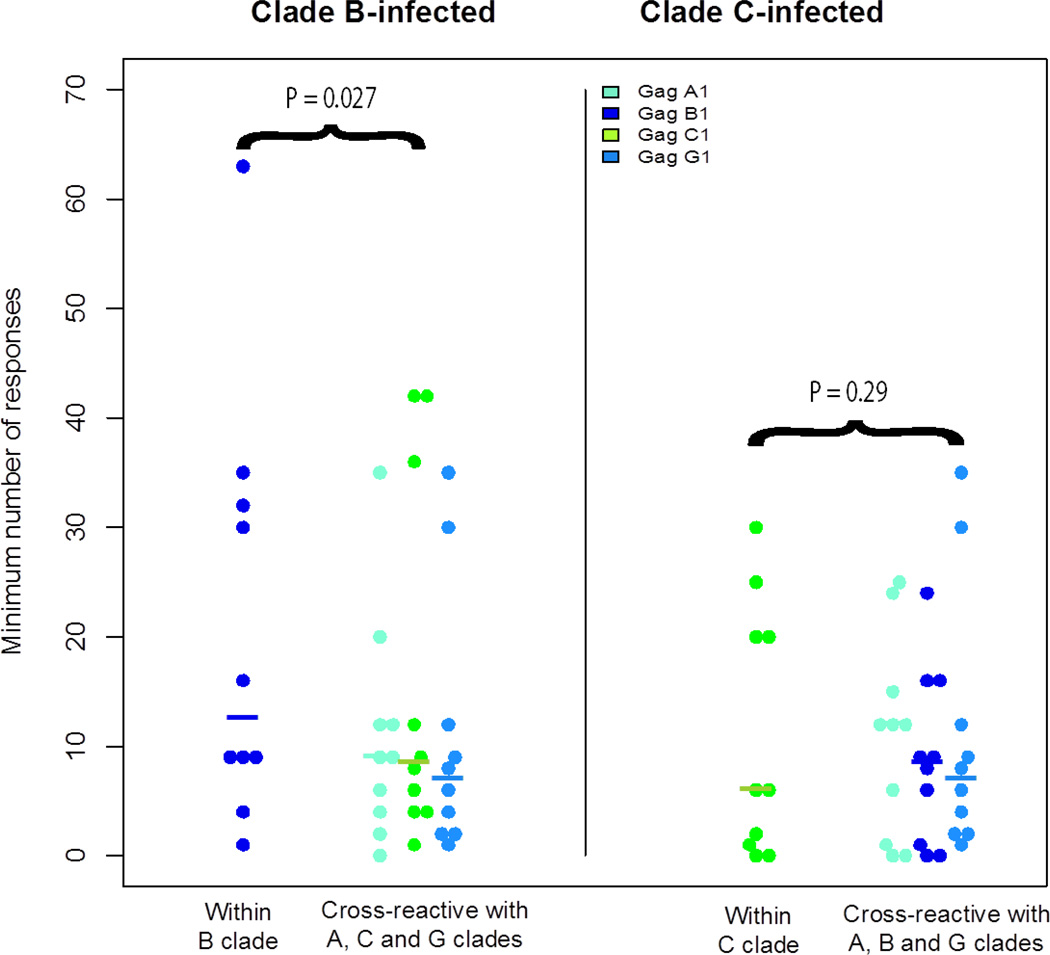
Figure 2.
Minimum number of epitope responses. Each dot represents the estimated number of epitope responses for each subject across the four Gag proteins. B clade subjects are represented on the left panel, and C-clade subjects on the right panel. Medians are denoted with horizontal bars. The number of within-clade epitope responses was higher in the B-clade subjects (p=0.027 by permutation test) but not the C-clade subjects (p=0.29 by permutation test).

