

SUMMARY
Introduction: This study conducted spectroscopic analyses using proton (1H) Magnetic Resonance Spectroscopy (at 4 Tesla) in a sample of adolescents with Attention Deficit Hyperactivity Disorder (ADHD), before and after treatment with extended release methylphenidate (OROS MPH), as compared to a sample of healthy comparators. Aims: The main aim of this study is to use 1H MRS to measure differences in brain biochemistry between adolescents with and without ADHD, and to assess changes in cerebral biochemistry, before and after stimulant treatment in ADHD youth. Results: Subjects with ADHD were medically healthy adolescents treated in an open label fashion with OROS MPH (mean dose: 54 mg/day; 0.90 mg/kg/day). Subjects with ADHD were scanned before and after OROS MPH treatment. Healthy comparators were scanned once. Magnetic resonance (MR) spectroscopy studies were performed on a 4.0 T Varian Unity/Inova MR scanner; proton spectra were acquired from the Anterior Cingulate Cortex (ACC). Data were analyzed using MANOVA and repeated measurement ANOVA. Higher metabolite ratios (Glutamate/myo‐inositol, Glutamine/myo‐inositol, Glutamate + Glutamine/myo‐inositol) were observed in the ACC in untreated ADHD subjects as compared to controls, and to treated ADHD youth; these group differences did not reach the a priori threshold for statistical significance. Conclusions: These preliminary findings suggest the presence of glutamatergic abnormalities in adolescents with ADHD, which may normalize with MPH treatment. Larger sample, controlled studies are needed to confirm these preliminary findings.
Keywords: ADHD, Methylphenidate, Spectroscopy
Introduction
Attention Deficit Hyperactivity Disorder (ADHD) is one of the most prevalent neurobiological brain disorders, estimated to afflict up to 10% of children worldwide [1, 2]. While underlying abnormalities in frontostriatal networks have been documented in pediatric [3] and adult ADHD populations [4], the underlying neurochemistry of ADHD, as well as the neuronal impact of pharmacological agents have received little attention in the scientific literature.
Proton magnetic resonance spectroscopy (1H MRS) allows for the in vivo assessment of cerebral neurochemistry in ADHD, through the measurement of cerebral metabolites, including glutamate (Glu), glutamine (Gln), and their combination (Glx), N‐acetyl‐aspartate (NAA), creatine plus phosphocreatine (Cr), and myo‐inositol‐containing compounds (Ino) [5]. Given the interplay between dopaminergic and glutamatergic neurotransmission, abnormalities in the dopamine system, such as in individuals with ADHD, may be indirectly observed through the measurement of cerebral metabolites, for example, Glx [6]. Moreover, MRS is noninvasive, using nonionizing radiation, allowing for the investigation of the effects of medications for ADHD in the brain.
A small literature has used MRS to investigate the biochemical underpinnings of ADHD. As compared to healthy controls, untreated children and young adults with ADHD have demonstrated a higher Glx/Cr ratio in the prefrontal cortex, frontal lobe, putamen, and cerebellum [7, 8, 9, 10], as well as greater absolute Glx and Cr striatal concentrations [11]. Previous work by our group has demonstrated different Glu/Ino ratio in the anterior cingulate cortex (ACC) of children with ADHD, as compared to children with ADHD plus bipolar disorder, and healthy children [12]. While important, these preliminary efforts have been limited by the reliance on 1.5 T machines and have not adequately examined treatment effects [11, 13, 14, 15].
The further delineation of the neurochemical underpinning of ADHD and its treatment has important clinical and scientific implications. The identification of brain biochemical abnormalities in subjects with ADHD can help elucidate the underlying pathophysiology of this disorder and help identify novel treatment targets. A better understanding of the effects of stimulants in the brain can help understand the mechanism of effects, and address ongoing concerns about potential neurotoxic effects of these medicines on the brain.
The main aim of this study was to use 1H MRS to measure differences in brain biochemistry between adolescents with and without ADHD, and to assess changes in cerebral biochemistry in ADHD youth, before and after treatment with a stimulant medication (OROS MPH). Based on the literature and our prior work, we hypothesized that significantly higher Glu/Ino levels in the ACC will be observed in ADHD youth, compared with healthy control subjects. Further, based on a limited literature [15], we also hypothesized that neurochemical abnormalities in ADHD youth will normalize following treatment with OROS MPH.
Methods
Subjects
Subjects were medically healthy adolescents with ADHD (N= 10), participating in a longitudinal treatment study, receiving daily doses of OROS MPH of up to 1.5 mg/kg/day. A diagnosis of ADHD was made according to full DSM IV TR criteria, by clinical interview with a child psychiatrist, supplemented with a structured diagnostic psychiatric interview (Kiddie Schedule for Affective Disorders and Schizophrenia‐Epidemiologic Version [KSADS‐E]).
Subjects with any clinically significant or unstable medical conditions were excluded. Also excluded were subjects with active, clinically significant psychiatric comorbidity; for example, current mood or anxiety disorders. All subjects were healthy by medical history, laboratories and physical examination. The study was approved by the Massachusetts General Hospital and McLean Hospital Institutional Review boards and registered with http://www.clinicaltrials.gov (NCT00181714). Informed consent was obtained from parent[s] or guardian[s] and assent from each adolescent. Subjects received compensation for participating in scanning visits. Control subjects (N= 12; healthy comparison subjects [HCS]), were healthy adolescents, without psychiatric or medical illness, of similar age and sex as the ADHD subjects.
Study Design
Treatment/Dosing
All ADHD subjects received OROS MPH monotherapy under open label conditions. Prior ADHD medications were discontinued before study entry. Clinician‐rated assessments performed at baseline and at regular intervals throughout the treatment study included the ADHD Rating Scale, to assess individual symptoms of ADHD in DSM‐IV (0–3 on a scale of severity), and the ADHD specific Clinical Global Impression (CGI) Scale, a widely used rating scale to measure overall severity and improvement. Adverse events were systematically collected.
Doses of OROS MPH were clinically adjusted up to a maximal dose of 1.5 mg/kg/day (range included dosing > FDA approved 72 mg/day), according to tolerability and symptoms, until the subject achieved an ADHD‐specific Clinical Global Impression Scale‐Improvement score of 1 or 2 (ADHD symptomatology much or very much improved from baseline). Subjects with an acceptable clinical response (much or very much improved on ADHD specific CGI) and tolerability could remain in this longitudinal study, seen monthly, for up to 2 years. Subjects were dropped from the study if in the investigators’ opinion there was lack of efficacy, intolerable adverse events and/or clinically significant laboratory values, pregnancy, clinical worsening, or noncompliance with the study protocol.
Imaging and Spectroscopy Methods
ADHD subjects (N= 10) completed imaging procedures on two separate occasions; first, at baseline, in the untreated state, and second, after 6–8 weeks of OROS MPH treatment. The time interval between the two scans was @6–8 weeks (mean 53 days). HCS underwent imaging procedures once. All scanning was performed at the Brain Imaging Center at McLean Hospital. Imaging and fitting of the data were made blindly to group assignment of the subjects.
Screening Magnetic Resonance Imaging (MRI) at 1.5 Tesla
Prior to the first MRS exam, a screening anatomical MRI was performed on all subjects using a GE 1.5 T Signa (GEMS Milwaukee, WI, USA) with a volume head coil. The purpose of this MRI was to provide a clinical‐quality MRI for reading by a radiologist to exclude subjects with possible structural abnormalities. A board‐certified neuroradiologist reviewed the MR images. Sequences and parameters are as follows: Sagittal T1 weighted localizer, 4 mm slice thickness, 1 mm gap, 20 slices; repetition time (TR) = 600 ms, with minimum echo time (TE). Axial proton density and T2 (double echo) weighted images with 3 mm slice thickness, no gap, 60 slices; TR = 3000 ms, TE = 30 ms and 80 ms. Coronal SPGR (Spoiled Gradient Recalled Acquisition in the Steady State), 1.5 mm slice thickness, no gap, 124 slices. Flip angle = 25° with minimum TE. Axial FLAIR (Fluid Attenuated Inversion Recovery), 5 mm slice thickness, 2 mm gap, 20 slices; TR = 9000 ms, TE = 120 ms, inversion time (TI) = 2200 ms.
MRS at 4.0 Tesla
All MR spectroscopy studies were performed on a 4.0 T Varian Unity/Inova whole body MR scanner (Varian NMR Instruments, Palo Alto, CA, USA) equipped with a proton volumetric head coil (MR Instruments, Minneapolis, MN, USA) operating at 170.3 MHz. Following the acquisition of localizer images and shimming, proton spectra were acquired from a 2 cm × 2 cm × 2 cm voxel localized on the ACC using the PRESS spectroscopy sequence. The voxel was placed over the anterior cingulate gyrus, in a predominantly gray matter area, superior to the orbits and inferior to the genu of the corpus callosum (Figure 1). Dr. Moore placed all of the voxels. Dr. Moore has been trained in the identification of the ACC by a neuroanatomist. Parameters include a TR = 2 seconds; TE = 30 ms, and averages = 128. T2 correction for MRS metabolites in each subject was not performed in this pilot study.
Figure 1.
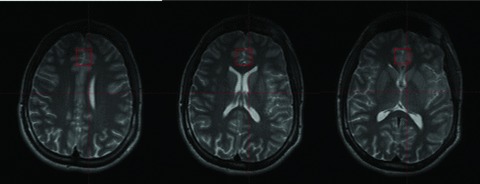
Localization of a 2 cm × 2 cm × 2 cm voxel in the anterior cingulate cortex (ACC). The figure on the left is the most superior, and the figure on the right the most inferior slice. The figure in the middle corresponds with the central voxel location.
Following data acquisition the proton spectra were transferred to a Sun Ultra 60 (SUN, Mountain View, CA) Workstation and fit using LCModel [16]. LCModel analyzes an in vivo proton spectrum as a linear combination of model in vitro spectra from individual metabolite solutions. The more metabolites included, the better the LCModel fit. The model used for these studies is a simulated basis‐set and includes resonances for Alanine, Aspartate, Creatine, Phosphocreatine, GABA, Glucose, Glutamate (Glu), Glutamine (Gln), Glycerophosphocholine, Phosphocholine, myo‐Inositol (Ino), Lactate, N‐acetyl Aspartate, N‐acetyl aspartyl glutamate, scyllo‐Inositol, and Taurine. LCModel produces absolute fits (in institutional units) and standard deviations (SD%). The standard deviation is a measure of the reliability of the fit. A standard deviation of 100% means the metabolite would need to double in order for a change to be seen. The spectral inclusion criteria was NAA, Cho, Cr, and myo‐Ino SD less than 15%, and Glutamate and Glutamine less than 25%. Detailed methodology can be found in Moore et al. (2007); a sample spectrum is provided (Figure 2).
Figure 2.

Sample MRS spectrum.
Image Segmentation and Volume Calculations
The structural 4.0 T MRI scans were segmented using open source software, “NVM” (freely available from Neuromorphometrics, Inc. at http://neuromorphometrics.org:8080/nvm/). In this way the volume of gray matter, white matter, and CSF contributing to the proton spectroscopy ACC voxel is calculated.
Data Analysis
Data were analyzed using MANOVA and repeated measurement ANOVA with the PASW Statistics 18.0 for Macintosh. Statistical significance was set at P < 0.05.
Results
Sample Characteristics
Twenty subjects with ADHD enrolled in this imaging study; 10 completed the study. Three ADHD subjects were too anxious to complete an initial scan, one scan was read as abnormal (screening MRI) and the subject was referred to neurology, one scan was unreadable due to subject movement. The remainder of subjects withdrew consent or did not complete the treatment study, primarily due to other time commitments. Twelve HCS served as comparators.
Prior medication for ADHD subjects was discontinued 1–4 weeks prior to the initial study scan, one subject had not taken medication in the past year and two subjects were treatment naive. There was no significant difference in age between ADHD subjects (mean age 14.2 ± 1.9 years) and HCS (mean age 12.8 ± 5.3 years) (t[20]= 0.77, P= 0.45). The sex distribution (majority male) was the same across the groups (chi‐square[1]= 0.32, P= 0.57).
ADHD Subjects: Symptomatology, Impairment and OROS MPH Dosing
Prior to beginning medication, the ADHD group demonstrated a significant level of ADHD symptoms and related impairment according to clinician ratings; mean ADHD RS = 30.9, CGI‐S score = 4.5 (moderate‐marked ADHD symptom severity). Following 6–8 weeks of OROS MPH treatment, ADHD subjects had a low level of ADHD symptoms with minimal impairment, according to clinician ratings at time of second scan; mean ADHD RS <10, mean CGI‐S score 2.5 (borderline‐mild ADHD symptoms). The mean dose of OROS MPH at time of the second scan was 54 mg/day; 0.90 mg/kg/day.
Adverse Events
There were no serious adverse events in this study.
Imaging Findings
There was no statistically significant difference in the white matter, gray matter, and CSF% content in the ACC voxel, when comparing ADHD subjects to healthy comparison subjects.
ADHD Untreated Subjects versus Controls
Higher Glu/Ino, Gln/Ino, Glx/Ino metabolite ratios were observed in the ACC spectra of interest in ADHD subjects prior to medication, as compared to healthy comparison subjects; differences failed to reach a priori threshold for statistical significance (Table 1). There were no statistically significant differences in the absolute level of any other metabolite, and none of the measured ratios correlated significantly with age or sex (P > 0.05). In examining the relationship between metabolite ratios and ADHD rating scale scores (ADHD‐RS) in the ADHD subjects, we found a statistically significant correlation with Gln/Ino (r=−0.71, P= 0.02) at baseline, in the untreated state.
Table 1.
Magnetic resonance spectroscopy (1H MRS at 4 Tesla) findings in ADHD subjects and in controls
| Controls (N= 12) | ADHD (N= 10) | Controls versus ADHD untreated | ADHD untreated versus ADHD treated | ||
|---|---|---|---|---|---|
| Untreated (Baseline) | Treated (OROS MPH at 6 weeks) | ||||
| MRS ratios: Mean ± SD | Statistics: t statistic; | Cohen's d; P‐value | |||
| Glutamate/Ino (Glu/Ino) | 1.56 ± 0.34 | 1.79 ± 0.42 | 1.50 ± 0.45 | d= 0.60 | d= 0.45 |
| t (20)= 1.44 | t (9)= 1.43 | ||||
| P= 0.17 | P= 0.19 | ||||
| Glutamine/Ino (Gln/Ino) | 1.02 ± 0.60 | 1.30 ± 0.61 | 1.08 ± 0.43 | d= 0.45 | d= 0.31 |
| t (20)= 1.05 | t (9)= 0.97 | ||||
| P= 0.31 | P= 0.36 | ||||
| Glx/Inoa | 2.59 ± 0.87 | 3.09 ± 0.80 | 2.58 ± 0.73 | d= 0.59 | d= 0.54 |
| t (20)= 1.40 | t (9)= 1.71 | ||||
| P= 0.18 | P= 0.12 | ||||
aGlx, combined Glutamate & Glutamine.
ADHD Untreated versus ADHD Treated
There were no statistically significant changes in the absolute level of any metabolite in the ACC spectra of interest in ADHD subjects, after 6 weeks of OROS MPH treatment. However, trend reductions in Glu/Ino, Gln/Ino, Glx/Ino metabolite ratios were observed following treatment (Table 1).
Discussion
This study used 1H MRS (at 4 Tesla) to measure cerebral biochemistry in a small sample of adolescents with ADHD, before and after 6 weeks of OROS MPH treatment, as compared to healthy comparison subjects. Consistent with our hypotheses, higher glutamatergic ratios were observed in the ACC in ADHD subjects prior to stimulant treatment, as compared to healthy comparators. Following OROS MPH treatment, glutamatergic ratios in ADHD subjects were lower and approximated findings in controls, although these group differences did not reach our a priori threshold for statistical significance.
Although brain biochemical differences between untreated ADHD subjects and controls in this small sample were not statistically significant, the nature and direction of our findings are consistent with an emerging literature. Studies to date have identified glutamate as a spectroscopic signal of interest in ADHD, with significant elevations in glutamatergic signaling reported in frontal regions [7, 8], the striatum [11] and the ACC [17], in untreated ADHD youth as compared to controls. A recent study of medication‐free adults with ADHD also found significantly increased Glx/Cre in the left cerebellar hemisphere [10], however, the literature on the topic has primarily involved a pediatric age range (6–17 years old) [18]. MRS findings have been in the context of medically healthy, screened psychiatric samples, typically with psychiatric comorbidity limited to Oppositional Defiant Disorder. The Carrey et al. (2007) group involved treatment of naive subjects; otherwise subjects have had varying degrees of prior medication exposure. Interestingly, glutamatergic resonance has been correlated with age of ADHD onset [7] neuropsychological measures such as memory and learning [8], and in our sample, with ADHD symptom ratings at baseline. Despite an apparent convergence of glutamatergic findings, not all spectroscopic studies to date in ADHD samples have identified significant glutamatergic abnormalities (e.g., elevated NAA ratios) [19, 20].
Although preliminary, MRS findings to date are consistent with models of ADHD pathophysiology, given the cross regulation and interaction of dopaminergic and glutamatergic neurotransmission [6, 21]. Although speculative, glutamate elevations may indicate a failure to inhibit glutamate release in the setting of abnormally low levels of synaptic monoamines (dopamine) in individuals with ADHD, in the untreated state [11]. In healthy individuals without ADHD, dopamine inhibits glutamate release from cortical afferents in the striatum [22]. A significant elevation in glutamine, a marker of glial activity (neuronal support cells; modulate neurotransmission) may indicate that glial cells are responding to the setting of increased extracellular glutamate by increasing glutamate uptake and conversion to glutamine [23, 24, 25]. Others have proposed that reduced catecholaminergic input in ADHD may yield a decrease in glial (astrocyte) mediated neuronal energy metabolism, with alterations in glutamatergic signaling and indicators of cerebral insult or neurodegeneration (e.g., cerebral edema) [26, 27]. Clinical implications of such a model of ADHD pathophysiology would include strategies to distribute energy demands involved in task performance and to reestablish depleted energy reserves [28].
In addition to comparing the biochemical profile of untreated ADHD subjects to controls, we examined the spectral signals in ADHD subjects after 6–8 weeks of OROS MPH treatment. Contrary to prior studies, we used robust, clinically relevant dosing (mean 0.90 mg/kg/day) and documented clinical improvement and endpoint symptomatology by an ADHD‐specific rating scale (ADHD RS). Following treatment with OROS MPH, glutamatergic ratios trended down, approximating the signals observed in the control group; a 14–27% difference in glutamatergic ratios between controls and untreated ADHD subjects became a <5% difference when comparing controls and ADHD subjects on OROS MPH. The largest change was observed in the glutamine/Ino ratio. In another small pediatric sample (N= 12), Carrey et al. (2007) observed a similar trend reduction in striatal Glu and Glx following 8 weeks of immediate release MPH. The authors suggested that findings may have been influenced by relatively low stimulant dosing employed in their study (0.3–0.6 mg/kg/day), or by a treatment effect (@10% MRS signal reduction) less than the inherent variation in biochemical resonances. A significant reduction in striatal creatine was also observed, which the authors suggested implied a relative increase in monoamine (DA) availability following stimulant treatment [11].
Our findings should be viewed in light of methodological limitations. While the statistical and clinical significance of our findings may be primarily limited by the small size of the sample, age and sex may also influence metabolite profiles. Moreover, abnormalities in cerebral biochemistry in untreated individuals with ADHD may be found in differing brain regions, including striatum [11], prefrontal cortex [8], and cerebellum [10], perhaps supporting a heterogeneous underlying neurobiology in ADHD. The examination of ADHD treatment effects is also limited by this pilot study's small sample size and lack of placebo control. In addition, it may be that longer term treatment is necessary for significant changes to occur in cerebral neurochemistry. Moreover, it may be that the effect of stimulant medication on cerebral metabolites found in our study and others is not sufficiently greater than the variation of glutamatergic signals [11], or that the effect varies according to the pharmacologic agent [13]. Use of high‐field strength MRS with improved MRS methodology will significantly increase the ability for future investigations to measure the true resonance of metabolites of interest [21].
Despite these limitations, this study supports the utility of MRS in the examination of the underlying cerebral biochemistry of ADHD, as well as the impact of pharmacotherapy for this disorder on brain biochemistry. While preliminary, MRS findings to date are consistent with a corrective impact of stimulant medication on biochemical abnormalities in relevant brain areas for individuals with ADHD, with an MRS signature indicating reduced excitotoxic glutamatergic concentrations. These findings are directionally consistent with changes in MRS signaling seen with other psychotropics [5] and counter to the MRS profile seen in the setting of illicit drug use, in which biochemical findings suggest persistent excitoxicity and declines in neuronal integrity and density [29]. However, critical barriers limit the interpretation of the available literature, given the heterogeneous nature of stimulant exposure, lack of placebo control, and comparisons to normative (control) values, as well as the reliance on low field strength MRS (1.5 Tesla). Future studies are warranted.
Financial Disclosures
In the past 2 years, Dr. Hammerness has received research funds or participated in CME activities/professional talks supported by the following pharmaceutical companies: Eli Lilly, Forest, McNeil, Shire. Dr. Hammerness has also received research funds from Elminda Ltd. and has served on the advisory board for Shire. In the past 2 years, Dr. Hammerness has participated, as an investigator, in research studies funded by the following pharmaceutical companies: Cephalon, Eli Lilly, Glaxo‐SmithKline, Johnson & Johnson, McNeil, Ortho‐McNeil Janssen, Merck, New River, Novartis, Organon, Pfizer, Shire, Takeda. Dr. Hammerness has also received honoraria from Reed Medical Education (a logistics collaborator for the MGH Psychiatry Academy). Commercial entities supporting the MGH Psychiatry Academy are listed on the Academy's website, http://www.mghcme.org.
Dr. Joseph Biederman is currently receiving research support from the following sources: Alza, AstraZeneca, Bristol Myers Squibb, Eli Lilly and Co., Janssen Pharmaceuticals Inc., McNeil, Merck, Organon, Otsuka, Shire, NIMH, and NICHD. In 2009, Dr. Joseph Biederman received a speaker's fee from the following sources: Fundacion Areces, Medice Pharmaceuticals, and the Spanish Child Psychiatry Association. In previous years, Dr. Joseph Biederman received research support, consultation fees, or speaker's fees for/from the following additional sources: Abbott, AstraZeneca, Celltech, Cephalon, Eli Lilly and Co., Esai, Forest, Glaxo, Gliatech, Janssen, McNeil, NARSAD, NIDA, New River, Novartis, Noven, Neurosearch, Pfizer, Pharmacia, The Prechter Foundation, Shire, The Stanley Foundation, UCB Pharma, Inc. and Wyeth.
Dr. Henin has received honoraria from Shire, Abbott Laboratories, and AACAP. She receives royalties from Oxford University Press. She has also received honoraria from Reed Medical Education (a company working as a logistics collaborator for the MGH Psychiatry Academy). The education programs conducted by the MGH Psychiatry Academy were, in part, supported though Independent Medical Education grants from pharmaceutical companies, including AstraZeneca, Lilly, McNeil Pediatrics, Shire, Forest Laboratories Inc., Sanofi aventis, Janssen, Bristol‐Myers Squibb, and Pfizer.
Author Contributions
Paul Hammerness was the overall PI of the study. He provided general oversight of the study, was responsible for the clinical evaluation and treatment of subjects, coordinating and reviewing spectroscopy results, and drafting and editing the manuscript. Joseph Biederman was involved in the concept/design of this study, secured funding for this study, and played a key role in the interpretation of findings and drafting the manuscript. Carter Petty provided statistical support, and analysis of data. Aude Henin was involved in control subject recruitment, and oversight, as well as critical review of the manuscript. Constance Moore was responsible for oversight of the scans, as well as spectroscopy data analysis and interpretation, drafting and editing the manuscript.
Conflict of Interest
Carter Petty and Constance Moore report no conflict of interests.
Acknowledgments
We thank Timothy Wilens, M.D., and J. Eric Jensen, Ph.D., for their help with this project. This work was supported in part by the Pediatric Psychopharmacology Council Fund and by McNeil Pharmaceuticals (ClinicalTrials.gov; NCT00181714).
References
- 1. Pliszka S. Practice parameter for the assessment and treatment of children and adolescents with attention‐deficit/hyperactivity disorder. J Am Acad Child Adolesc Psychiatry 2007;46:894–921. [DOI] [PubMed] [Google Scholar]
- 2. Faraone SV, Sergeant J, Gillberg C, Biederman J. The worldwide prevalence of ADHD: Is it an American condition? World Psychiatry 2003;2:104–113. [PMC free article] [PubMed] [Google Scholar]
- 3. Valera EM, Faraone SV, Murray KE, Seidman LJ. Meta‐analysis of structural imaging findings in attention‐deficit/hyperactivity disorder. Biol Psychiatry 2007;61:1361–1369. [DOI] [PubMed] [Google Scholar]
- 4. Makris N, Biederman J, Monuteaux MC, Seidman LJ. Towards conceptualizing a neural systems‐based anatomy of attention‐deficit/hyperactivity disorder. Dev Neurosci 2009;31:36–49. [DOI] [PMC free article] [PubMed] [Google Scholar]
- 5. Agarwal N, Port JD, Bazzocchi M, Renshaw PF. Update on the use of MR for assessment and diagnosis of psychiatric diseases. Radiology 2010;255:23–41. [DOI] [PubMed] [Google Scholar]
- 6. Carlsson A. The neurochemical circuitry of schizophrenia. Pharmacopsychiatry 2006;39(Suppl 1):S10–S14. [DOI] [PubMed] [Google Scholar]
- 7. MacMaster FP, Carrey N, Sparkes S, Kusumakar V. Proton spectroscopy in medication‐free pediatric attention‐deficit/hyperactivity disorder. Biol Psychiatry 2003;53:184–187. [DOI] [PubMed] [Google Scholar]
- 8. Courvoisie H, Hooper SR, Fine C, Kwock L, Castillo M. Neurometabolic functioning and neuropsychological correlates in children with ADHD‐H: Preliminary findings. J Neuropsychiatry Clin Neurosci 2004;16:63–69. [DOI] [PubMed] [Google Scholar]
- 9. Ferreira PE, Palmini A, Bau CH, et al Differentiating attention‐deficit/hyperactivity disorder inattentive and combined types: A (1)H‐magnetic resonance spectroscopy study of fronto‐striato‐thalamic regions. J Neural Transm 2009;116:623–629. [DOI] [PubMed] [Google Scholar]
- 10. Perlov E, Tebarzt van Elst L, Buechert M, et al H1‐MR‐spectroscopy of cerebellum in adult attention deficit/hyperactivity disorder. J Psychiatr Res 2010;44:938–943. [DOI] [PubMed] [Google Scholar]
- 11. Carrey NJ, MacMaster FP, Gaudet L, Schmidt MH. Striatal creatine and glutamate/glutamine in attention‐deficit/hyperactivity disorder. J Child Adolesc Psychopharmacol 2007;17:11–17. [DOI] [PubMed] [Google Scholar]
- 12. Moore CM, Frazier JA, Glod CA, et al Glutamine and glutamate levels in children and adolescents with bipolar disorder: A 4.0‐T proton magnetic resonance spectroscopy study of the anterior cingulate cortex. J Am Acad Child Adolesc Psychiatry 2007;46:524–534. [DOI] [PMC free article] [PubMed] [Google Scholar]
- 13. Carrey N, MacMaster FP, Sparkes SJ, Khan SC, Kusumakar V. Glutamatergic changes with treatment in attention deficit hyperactivity disorder: A preliminary case series. J Child Adolesc Psychopharmacol 2002;12:331–336. [DOI] [PubMed] [Google Scholar]
- 14. Carrey N, MacMaster FP, Fogel J, et al Metabolite changes resulting from treatment in children with ADHD: A 1H‐MRS study. Clin Neuropharmacol 2003;26:218–221. [DOI] [PubMed] [Google Scholar]
- 15. Kronenberg G, Ende G, Alm B, Deuschle M, Heuser I, Colla M. Increased NAA and reduced choline levels in the anterior cingulum following chronic methylphenidate. A spectroscopic test‐retest study in adult ADHD. Eur Arch Psychiatry Clin Neurosci 2008;258:446–450. [DOI] [PubMed] [Google Scholar]
- 16. Provencher SW. Automatic quantitation of localized in vivo 1H spectra with LCModel. NMR Biomed 2001;14:260–264. [DOI] [PubMed] [Google Scholar]
- 17. Moore CM, Biederman J, Wozniak J, et al Differences in brain chemistry in children and adolescents with attention deficit hyperactivity disorder with and without comorbid bipolar disorder: A proton magnetic resonance spectroscopy study. Am J Psychiatry 2006;163:316–318. [DOI] [PMC free article] [PubMed] [Google Scholar]
- 18. Perlov E, Philipsen A, Matthies S, et al Spectroscopic findings in attention‐deficit/hyperactivity disorder: Review and meta‐analysis. World J Biol Psychiatry 2009;10(4 Pt 2):355–365. [DOI] [PubMed] [Google Scholar]
- 19. Sun L, Jin Z, Zang YF, et al Differences between attention‐deficit disorder with and without hyperactivity: A (1)H‐magnetic resonance spectroscopy study. Brain Dev 2005;27:340–344. [DOI] [PubMed] [Google Scholar]
- 20. Yang P, Wu MT, Dung SS, Ko CW. Short‐TE proton magnetic resonance spectroscopy investigation in adolescents with attention‐deficit hyperactivity disorder. Psychiatry Res 2010;181:199–203. [DOI] [PubMed] [Google Scholar]
- 21. Jensen JE, Licata SC, Ongur D, et al Quantification of J‐resolved proton spectra in two‐dimensions with LCModel using GAMMA‐simulated basis sets at 4 Tesla. NMR Biomed 2009;22:762–769. [DOI] [PubMed] [Google Scholar]
- 22. Russell VA. Dopamine hypofunction possibly results from a defect in glutamate‐stimulated release of dopamine in the nucleus accumbens shell of a rat model for attention deficit hyperactivity disorder: The spontaneously hypertensive rat. Neurosci Biobehav Rev 2003;27:671–682. [DOI] [PubMed] [Google Scholar]
- 23. Hyder F, Patel AB, Gjedde A, Rothman DL, Behar KL, Shulman RG. Neuronal‐glial glucose oxidation and glutamatergic‐GABAergic function. J Cereb Blood Flow Metab 2006;26:865–877. [DOI] [PubMed] [Google Scholar]
- 24. Struzynska L. A glutamatergic component of lead toxicity in adult brain: The role of astrocytic glutamate transporters. Neurochem Int 2009;55:151–156. [DOI] [PubMed] [Google Scholar]
- 25. Zwingmann C, Leibfritz D, Hazell AS. Nmr spectroscopic analysis of regional brain energy metabolism in manganese neurotoxicity. Glia 2007;55:1610–1617. [DOI] [PubMed] [Google Scholar]
- 26. Todd RD, Botteron KN. Is attention‐deficit/hyperactivity disorder an energy deficiency syndrome? Biol Psychiatry 2001;50:151–158. [DOI] [PubMed] [Google Scholar]
- 27. Meisingset TW, Risa O, Brenner M, Messing A, Sonnewald U. Alteration of glial‐neuronal metabolic interactions in a mouse model of Alexander disease. Glia 2010;58:1228–1234. [DOI] [PMC free article] [PubMed] [Google Scholar]
- 28. Russell VA, Oades RD, Tannock R, et al Response variability in Attention‐Deficit/Hyperactivity Disorder: A neuronal and glial energetics hypothesis. Behav Brain Funct 2006;2:30. [DOI] [PMC free article] [PubMed] [Google Scholar]
- 29. Sailasuta N, Abulseoud O, Hernandez M, Haghani P, Ross BD. Metabolic abnormalities in abstinent methamphetamine dependent subjects. Subst Abuse 2010;2010:9–20. [DOI] [PMC free article] [PubMed] [Google Scholar]