Abstract
The removal of spatially correlated noise is an important step in processing multi-channel recordings. Here, a technique termed the adaptive common average reference (ACAR) is presented as an effective and simple method for removing this noise. The ACAR is based on a combination of the well-known common average reference (CAR) and an adaptive noise canceling (ANC) filter. In a convergent process, the CAR provides a reference to an ANC filter, which in turn provides feedback to enhance the CAR. This method was effective on both simulated and real data, outperforming the standard CAR when the amplitude or polarity of the noise changes across channels. In many cases the ACAR even outperformed independent component analysis (ICA). On 16 channels of simulated data the ACAR was able to attenuate up to approximately 290 dB of noise and could improve signal quality if the original SNR was as high as 5 dB. With an original SNR of 0 dB, the ACAR improved signal quality with only two data channels and performance improved as the number of channels increased. It also performed well under many different conditions for the structure of the noise and signals. Analysis of contaminated electrocorticographic (ECoG) recordings further showed the effectiveness of the ACAR.
Index Terms: artifact removal, adaptive filtering, multi-channel recording, neural data, common average reference, spatially correlated noise
I. INTRODUCTION
In physiological recordings, contamination that affects multiple channels is often referred to as a common mode artifact. Sometimes the source and characteristics of this noise are known, such as with power line noise, cardiac rhythm, or ocular artifacts, and it can be removed by filters specifically aimed at its characteristics [1], [2]. In many cases, though, the noise is more difficult to isolate. For example muscle movement, which produces electromyographic (EMG) artifacts, can occur across a broad spectrum [3].
The broadband nature and large amplitude of EMG artifacts makes filtering the noise or using any part of the signal more challenging [4]. Often these artifacts cannot be avoided [5], and simply discarding contaminated signals can cause an unacceptable loss of data [6], [7]. One other difficulty in noise removal from physiological signals is that in many cases the personnel monitoring or analyzing the signals have their expertise in areas outside of signal processing. For brain-computer interface (BCI) applications the end goal is to have someone operate the system without the need for assistance, so in that case the signals would not even be monitored. It would be useful then to have a means of filtering common mode artifacts that is not only effective, but easy to implement and capable of operating autonomously.
The goal of this paper is to demonstrate a relatively simple and automated technique for removing common mode artifacts. Although the methods discussed in this paper might be applicable to other data sources, here physiological recordings were targeted. Specifically, the signals were real and simulated electrocorticographic (ECoG) neural recordings. The method presented is based on a combination of the popular common average reference (CAR) [8] and an adaptive noise canceling (ANC) filter [9], and as a result it is referred to as the adaptive common average reference (ACAR). The basic idea of the ACAR is that for each iteration a weighted CAR is used as a reference signal in an ANC filter for each channel, and the correlation between the reference and the ANC output is then used as a weight for each channel in calculating the CAR on the next iteration.
Relevant background methods and material are discussed in Section II. The full implementation and details of the ACAR are covered in Section III. In order to obtain quantitative results, much of the data used for analysis was simulated. For further verification real neural data was used, but these results can only be visually presented since the true signal and noise are not known. The performance of the ACAR, independent component analysis (ICA), and the CAR are compared in Section IV. The conclusion is presented in Section V.
II. BACKGROUND
A. Common Average Reference
A simple model for a multi-channel physiological recording contaminated by noise can be given as follows:
| (1) |
where D is the recorded signal channel m at time point k, S is the actual uncontaminated signal, N is the noise source k with a contribution of γ to each channel. This model gives rise to the popular common average reference (CAR) used in physiological recordings, which has been proven effective under the right conditions but does have many limitations [10]. The CAR simply subtracts from each channel the average across all channels, and is given below in (2), where the Em[Dk] operator represents the expected value of Dk across all M channels. It is assumed that the signals of interest are uncorrelated. The idea is that the reference then mostly contains the common mode noise since the signal portions of the recording should average out. If in (1), γ = 1 for all m and Em[Sk] = 0, then the CAR would provide perfect removal of N.
| (2) |
One problem with the CAR comes from the fact that differing channel characteristics can cause the noise to have unpredictable amplitudes and even polarity in each channel (γ ≠ 1 for all m in (1)). With these difficulties the CAR could actually be harmful if some channels were not originally affected by the noise or if amplitude and polarity differences caused an inaccurate reference to be generated.
B. Independent Component Analysis
The shortcomings of the CAR have led to other algorithms being used for removal of spatially correlated noise in multi-channel physiological recordings, with blind source separation (BSS) techniques being among the most common [5]. One of the most well-known methods is independent component analysis (ICA). ICA has seen widespread use in numerous problems involving identifying individual signal and noise sources in multi-channel recordings, and as a result is a good standard to measure against [11].
In the context of noise removal, ICA is used in an attempt to isolate the noise to its own independent component(s). Any noise component must then be identified, and its corresponding row in the mixing matrix is set to zero before re-mixing the components back into the original signal space. At times identification of the noise components can be done algorithmically. ICA guarantees nothing about the order, amplitude, or polarity of the separated components, though, so at times this process can be complex and possibly require manual identification [12]. This task is made more difficult if the noise and signal characteristics are similar or unknown.
Also, ICA can fail to separate the signals in many situations depending on the convergence algorithm, including the cases where there are more sources than sensors or where the sources are not spatially stationary. Even if the sources are spatially stationary, ICA is difficult to use in real-time unless a recorded segment of data is available beforehand with which the mixing matrix can be calculated and the noise components determined. At times, though, all of these conditions are met and ICA can be used effectively in a real-time system, that is, a system such as a BCI in which processing of the neural signals is completed with some constant delay (usually on the order of milliseconds) relative to their recording.
III. METHODS
A. Adaptive Common Average Reference
The method presented here, referred to as the adaptive common average reference (ACAR), attempts to combine the strengths of an adaptive noise canceling (ANC) filter and the CAR described in the previous section. The ANC filter has been shown to be extremely effective in removing noise if an accurate reference is available [13]. A diagram of the filter is given in Fig. 1. The recorded signal is given by D, and a reference for the noise is given by X. The reference must be temporally correlated with N, although a small amount of time shift is acceptable as long as it does not exceed L, the length of the FIR filter shown in the diagram with coefficients W. The filter minimizes Ŝk, which is the difference between D and N̂. This process should also minimize the difference between N̂ and N so that Ŝ converges towards S. For good performance any correlation between N and S should be minimal.
Fig. 1.

System design for an adaptive noise canceling (ANC) filter. D is the recorded signal that consists of the true signal S plus noise N. A reference correlated with N is given by X, and the L FIR filter coefficients W are adapted by minimizing the output Ŝ so that N̂ most closely resembles N before being subtracted.
The convergence algorithm chosen for the ANC filter is based off of the least mean squares (LMS) method, which is one of the most popular alogrithms for adaptive filters and is given in (3) [14]. The bound on the learning rate, μ, was derived in [15] to ensure filter stability. The filter length is represented by L. Wk contains the filter tap coefficients at sample k and Xk are the most recent L values of X, which are used by the filter at sample k. is the power of X. For the methods used in this paper, a simple modification to the LMS algorithm was implemented in which the step size μ is replaced by a normalized step size, u. The new step size then requires a value between 0 and 1. This modification is known as normalized LMS (nLMS) and is shown in (4).
| (3) |
| (4) |
In (4), can be estimated from a segment of X. For the implementation here a one second segment of data was used, although the exact value is not critical as long as it is long enough to provide a stable estimate and short enough to adapt to changes in X. Decreasing L has similar effects to increasing the step size and in general should be as small as possible to model the necessary system. Since the desire here was to show that the ACAR will work with a generalized setup for an unknown system rather than fine-tuning multiple parameters for a specific data set, L was set to 10 for all data.
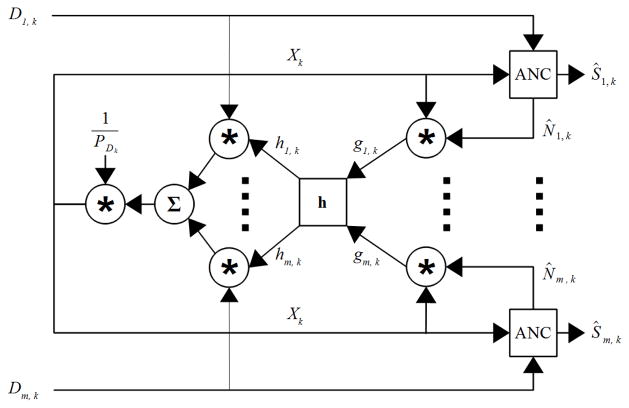
The CAR is in general able to produce a usable reference signal for spatially correlated noise, which is needed for X. The CAR might not provide a good enough reference for an ANC filter to be fully effective, but it is good enough for the ANC filter to begin converging. The filter output can then be used to improve upon the CAR, which in turn makes the ANC filter more effective and allows it to converge more tightly to the noise. These two convergent processes build upon each other to effectively reduce the spatially correlated noise. A diagram of this process is shown below in Fig. 2.
Fig. 2.
Block diagram of the adaptive common average reference (ACAR) filter. D is the recorded data channels and Ŝ is the filtered output. The ANC block contains the contents of Fig. 1 and the h block performs a moving average on g and normalizes the weights used for each channel in generating the reference as given in (6). PDk is the average signal power of all channels of D in a moving window as given by (7). Note: Until the window used by h is filled, g is calculated as the product of X and D as explained in the text.
D is the original recorded signal as in (1), and each ANC block contains the contents of Fig. 1. On initialization, X is the standard CAR. For each channel of the recording, if X is correlated with N then the scale and polarity of N relative to X can be estimated by the product of X with N̂, which produces g in Fig. 2. If the noise changes polarity across channels, then the polarity information provided by g can alone greatly enhance X. The magnitude is also useful as it allows the channels to be weighted by the relative strength of the spatially correlated noise.
It should be noted that g is a rudimentary measure of correlation between X and N̂. Calculation of correlation usually also involves z-scoring the data, but the mean is not removed since the noise could have a DC component. Also, the ANC filter will adapt N̂ based on the noise in each channel and normalizing by the standard deviation of N̂ would penalize noisier channels. Normalizing by the standard deviation of X is also not necessary since normalization of g and the reference signal is performed later and thus only the relative values of g are important at this step.
The values of h are calculated by smoothing g with a moving average and normalization shown in (5) and (6). As with all windows used in this paper, any reasonable length should work and so T was set to be one second of data. The maxm(|ḡk|) operator represents the maximum of |ḡk| across all M channels.
| (5) |
| (6) |
It should be noted that the initial samples of N̂ before the ANC filter begins converging will be inaccurate and h cannot provide much smoothing until its moving average window is filled. Due to this concern, the system implemented here calculates g as the product of X and D until the window used by h is filled. This modification has no discernible affect on the steady state error of the system, but does improve the speed and consistency of convergence.
After h is calculated, it is used to weight each channel before summing and producing X for the next iteration. As a final step, the reference is normalized by the average power across all channels of D given by (7). This normalization ensures that the reference signal remains stable and does not undergo rapid changes in power as the ANC filters adapt. As a failsafe, the ANC filter coefficients are continuously monitored by computing the reflection coefficients with Levinson recursion and checking stability with the Schur-Cohn algorithm [14]. If instability is detected the ANC filter maintains its previous coefficients and D is passed through to the output unchanged.
| (7) |
B. Independent Component Analysis
In order to give ICA optimal results and not have the performance depend on a second algorithm for detecting the noise component, an oracle was used to determine which independent components were noise. Each component was first individually removed and the one was selected that, when removed, resulted in the highest SNR in the reconstructed signals. This process was repeated in an iterative fashion until the SNR could not be improved any further by removing an additional component. In this way, if ICA did not achieve full separation of the data then multiple components containing noise could be eliminated.
ICA was implemented using the RobustICA algorithm, which has shown excellent results for the kind of data used in this paper [16]. RobustICA attempts to maximize the non-Gaussianity of the sources. The algorithm iteratively calculates the normalized kurtosis contrast function and can separate any component that has non-zero kurtosis. It should then be capable of separating any data set that has at most one Gaussian source. The use of higher order moments such as kurtosis is common amongst ICA methods. In some circumstances, though, such as when multiple signal sources are Gaussian, BSS algorithms that rely on other measures can produce superior results [17].
C. Data Collection
Simulated Data
Most of the data used for analysis was simulated to ensure that the target signal was known. Signals were generated at 1200 Hz using the Craniux software suite [18]. S in (1) consisted of pink noise with a 1/f power falloff to simulate a baseline ECoG recording [19]. This pink noise was created by generating uniform white noise and passing it through a digital filter with a 1/f response. Additional uniform white noise was added to the filtered signal, resulting in data that was sub-Gaussian with a kurtosis of about 2.4.
The noise, N, consisted of Gaussian white noise. For each trial, the mixing vector γ was generated with each element as a random number distributed uniformly between −1 and 1. This vector was then normalized to provide a specified average signal to noise ratio (SNR) as calculated in (8). The average SNR was calculated as the mean signal power over the mean noise power, which ensures that a constant SNR also provided a constant mean square error (MSE).
| (8) |
Real Data
The ACAR filter was also tested on real ECoG data. Although the true, noise-free signal was not known for these recordings, it is useful to at least qualitatively show that the method performs well on real data. All data was collected with g.USBamp (Guger Technologies) amplifiers and the raw signals were sampled at 1200 Hz. A standard 4 Hz notch filter was used to remove line noise and its harmonics. The data was recorded subdurally while the subjects attempted to use high gamma band modulation to control cursor movement in a 2D space.
The first data set was collected from a human subject who was implanted with a 32 channel ECoG grid over primary motor and sensorimotor areas. The subject was a 30 year old male who suffered a complete C4 spinal cord injury 7 years prior. All data collection and procedures were approved by the University of Pittsburgh’s Institutional Review Board and informed consent was obtained prior to implantation. The second data set was obtained from a non-human primate who had 12 channels of data recorded from primary motor and pre-motor areas. All data collection and procedures were approved by the University of Pittsburgh’s Institutional Animal Care and Use Committee.
D. Analysis
For the simulated data, the results of the ACAR and ICA were compared by the average SNR of the data after it was filtered. The MSE was also used to show the convergence properties of the ACAR. The standard CAR was not used on simulated tests where the noise had polarity changes across channels due to the poor performance of the CAR in this situation (it actually degraded signal quality when used in these cases). The standard CAR was used on other simulated data, though, and on the real data for which qualitative results were obtained through visual inspection of the signals.
IV. RESULTS AND DISCUSSION
A. Simulated Data
ACAR Learning Rate
The ACAR was first tested with different step sizes, u in (4). For each step size 50 trials of 16 channel data were generated. Each trial was 20 seconds long with an SNR of 0 dB. As expected Fig. 3 shows that smaller step sizes take longer to converge, but result in a smaller steady state error as confirmed by Table I. In the table, the SNR is calculated over the final 15 seconds of each trial so that convergence speed is not a factor. The best step size depends on the importance of convergence speed versus steady state error.
Fig. 3.
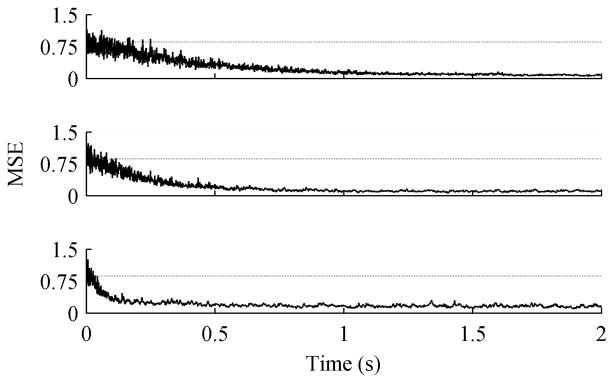
MSE for variable step sizes, averaged over 50 trials. The data contained 16 channels with an initial SNR of 0 dB. The dotted line is the average unfiltered MSE. Step sizes were (Top to Bottom) 0.005, 0.01, and 0.05.
TABLE I.
SNR (mean ± standard deviation) after filter convergence for variable step sizes, calculated over 50 trials of 16 channel data with an initial SNR of 0 dB.
| Step Size | SNR (dB) |
|---|---|
| 0.005 | 10.0 ± 0.8 |
| 0.01 | 9.2 ± 0.9 |
| 0.05 | 7.1 ± 0.7 |
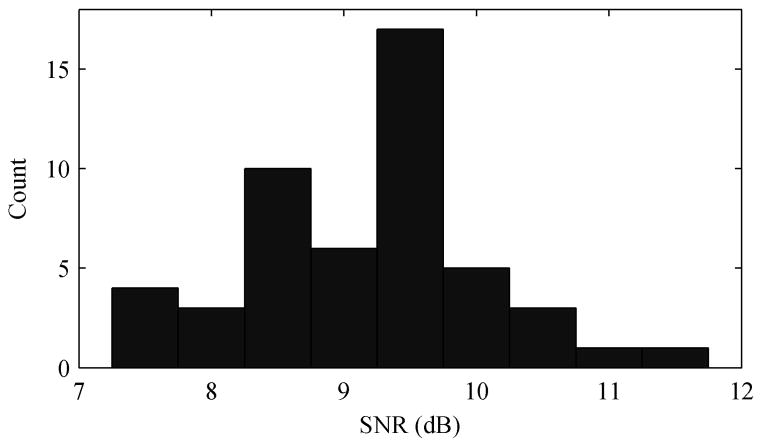
The optimal learning rate varies depending on characteristics of the signals, noise, mixing vector, etc. The goal here is to show that the ACAR works well under a variety of circumstances without fine-tuning parameters, though, so for the remainder of the analysis a step size of 0.01 was used. Fig. 4 shows a histogram of the filtered SNR for the 50 trials with a 0.01 learning rate. The ACAR improved the signal quality for every trial.
Fig. 4.
Histogram of ACAR output SNR over 50 trials for 16 channels, 0.01 step size, and 0 dB input SNR.
Variable Initial Noise Power
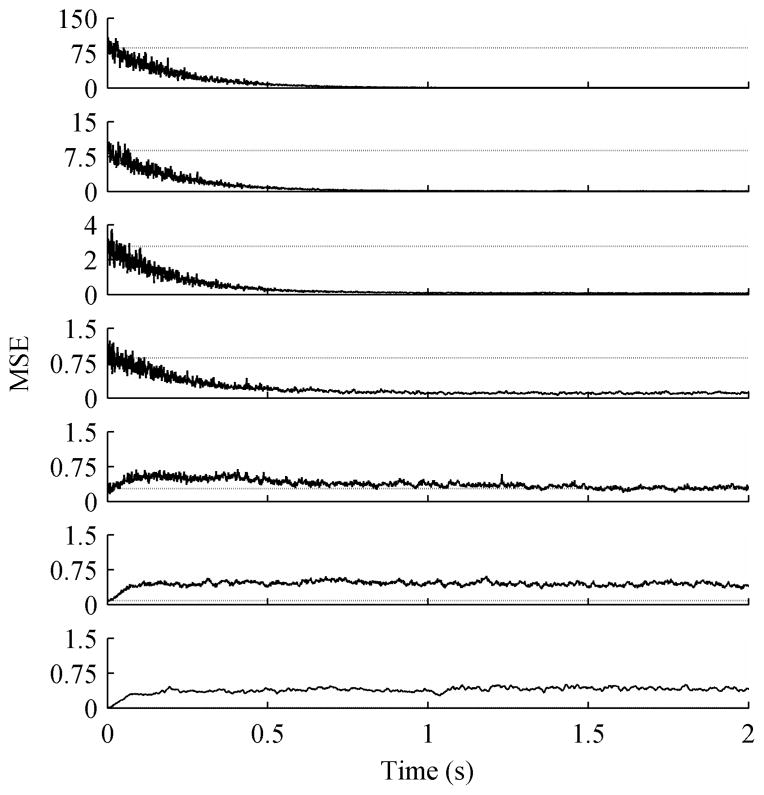
Next, the behavior of the ACAR with different initial SNRs was examined. For each session the SNR was varied and 50 trials of 20 second long, 16 channel data were collected. Fig. 5 shows the convergence of the ACAR for different initial SNRs. Although it is difficult to tell due to the scales, the ACAR did take slightly longer to fully converge at the lower SNRs. Table II shows the resulting SNR after filtering this data using both the ACAR and ICA. The ACAR remains consistent and exceeds the performance of ICA up until an initial SNR of 5 dB. The lower the initial SNR, the more accurate of a reference the ACAR was able to generate, which compensated for the problem of removing higher levels of noise. At high input SNRs, the ACAR was unable to converge upon an accurate reference.
Fig. 5.
MSE for variable initial SNRs, averaged over 50 trials of 16 channel data. The dotted line represents the average unfiltered MSE. The ACAR used a step size of 0.01. The initial SNRs in dB were (Top to Bottom) −20, −10, −5, 0, 5, 10, 20.
TABLE II.
SNR (mean ± standard deviation) after filter convergence for variable initial SNRs, calculated over 50 trials of 16 channel data.
| Unfiltered | ACAR | ICA |
|---|---|---|
| −20 | 11.5 ± 0.5 | 1.2 ± 0.5 |
| −10 | 11.2 ± 0.5 | 3.1 ± 0.7 |
| −5 | 10.5 ± 1.0 | 5.2 ± 1.0 |
| 0 | 9.2 ± 0.9 | 5.7 ± 1.0 |
| 5 | 6.5 ± 1.0 | 7.1 ± 0.9 |
| 10 | 3.1 ± 0.5 | 8.1 ± 0.6 |
| 20 | 3.6 ± 0.3 | 10.5 ± 1.3 |
In further testing the ACAR remained consistent down to around −280 dB, after which point it continued to attenuate about 290 dB of noise but could not maintain the output at over 10 dB as seen with the lower SNRs in Table II. At −280 dB the filter took approximately 20 seconds to fully converge. For arbitrarily high input SNRs, the ACAR maintained an output SNR of 3 to 5 dB. ICA was also unable to improve its performance for higher SNRs and maintained an output SNR of about 10 to 12 dB as the input SNR increased beyond 20 dB.
So the improvement in signal quality from the ACAR increased with decreasing input SNRs. At about 5 dB the ACAR began to struggle to converge and at higher input SNRs the signal quality was made worse by the ACAR. An output SNR over 3 dB was still maintained, though. ICA outperformed the ACAR at these higher input SNR levels, but it also hurt the signal quality for tested input SNRs greater than 5 dB. The ACAR also had more consistent results than ICA. Most physiological recordings that the ACAR would target would have fairly low SNRs.
Variable Number of Data Channels
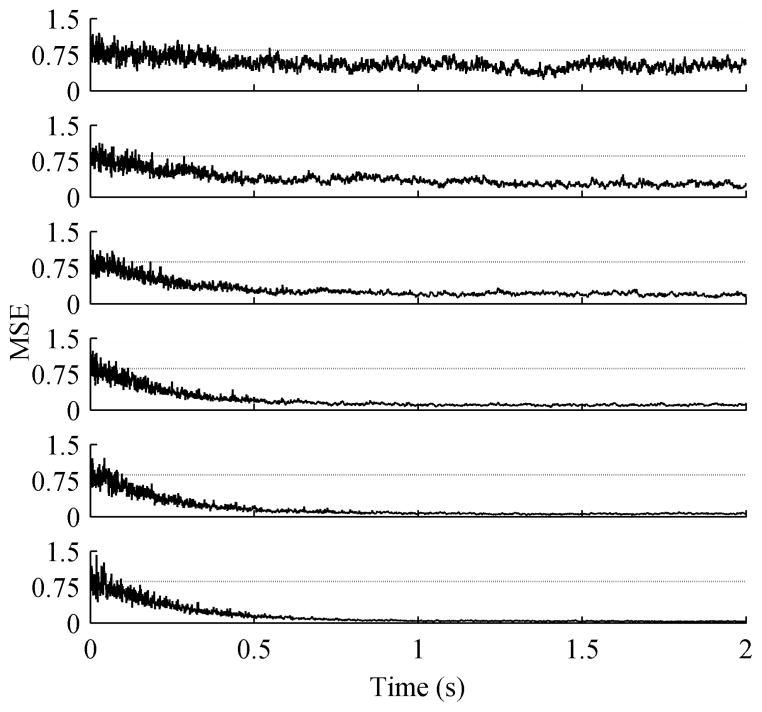
The performance of the ACAR as the number of data channels changed was also tested. For each number of channels, 50 trials of 20 second long data with an initial SNR of 0 dB were collected. Fig. 6 shows the convergence of the filter for each number of channels, and Table III shows the converged SNR. As can be seen, the filter converged more quickly and smoothly as the number of channels increased, and the converged SNR improved as well. As the number of channels increased the signal itself is more likely to average out to zero when generating the reference signal, resulting in a cleaner reference for the noise. ICA did not vary much due to the different number of channels and in all cases was outperformed by the ACAR in both mean and in consistency.
Fig. 6.
MSE for variable number of data channels, averaged over 50 trials of data that had an initial SNR of 0 dB. The dotted line represents the average unfiltered MSE and the ACAR used a step size of 0.01. The number of data channels were (Top to Bottom) 2, 4, 8, 16, 32, and 64.
TABLE III.
SNR (mean ± standard deviation) after filter convergence for variable number of data channels, calculated over 50 trials of data with an initial SNR of 0 dB.
| Channels | ACAR | ICA |
|---|---|---|
| 2 | 2.4 ± 0.3 | 1.9 ± 1.1 |
| 4 | 4.7 ± 0.5 | 3.7 ± 1.3 |
| 8 | 7.2 ± 0.8 | 4.7 ± 1.1 |
| 16 | 9.2 ± 0.9 | 5.7 ± 1.0 |
| 32 | 11.6 ± 0.9 | 6.4 ± 0.8 |
| 64 | 13.8 ± 1.0 | 7.1 ± 0.5 |
Variable Noise Source Conditions
The ACAR was also tested under conditions in which the noise did not have consistent power or spatial stationarity. Both the initial SNR and the mixing vector were adjusted according to the Gauss-Markov process shown in (9). In this process a is the value being updated, Δ is the timepoint at which the update occurs, and η is a value drawn from a zero-mean Gaussian distribution with a specified standard deviation.
| (9) |
For the first trial, the SNR was held constant at 0 dB and every 2 seconds each value in the mixing vector was changed by η with a standard deviation of 0.1. The values were clipped between −1 and 1 and re-normalized. For the second trial, the mixing vector was held constant and the SNR was adjusted every 2 seconds by η with a standard deviation of 1. The SNR was clipped if it went outside the bounds of −10 to 10 dB. For the third trial, both the mixing vector and the SNR were varied. Each trial was 20 minutes of 16 channel data and an ACAR learning rate of 0.01 was used.
Table IV shows the SNR across each trial for both the ACAR and ICA. The ACAR improved the signal quality across all trials and maintained performance that is consistent with what was seen in earlier trials. ICA performed poorly on the two trials in which the mixing vector varied, which is expected since ICA expects spatially stationary sources. On the trial where only SNR varied, though, ICA performed very well. The noise power changing most likely caused the distribution of the noise over the entire trial to be non-Gaussian, allowing ICA to better separate it into its own component.
TABLE IV.
SNR for variable noise conditions, calculated over 20 minutes of data.
| Condition | Unfiltered | ACAR | ICA |
|---|---|---|---|
| Var Mix | 0.0 | 9.2 | 1.9 |
| Var SNR | −2.1 | 7.8 | 11.9 |
| Var Mix, SNR | −5.4 | 7.6 | 0.9 |
Signal and Noise Gaussianity
The Gaussianity of the signals and the noise contributes to the performance of ICA. As stated earlier, the simulated signals were sub-Gaussian while the noise itself was Gaussian. In order to compare results to ICA under more optimal (i.e. less Gaussian) conditions, tests were done with signal and noise sources that were uniformly distributed. Table V shows these results.
TABLE V.
SNR for different signal and noise distributions, calculated over 50 trials of 16 channel data with an initial SNR of 0.
| Signal Distribution | Noise Distribution | ACAR | ICA |
|---|---|---|---|
| Uniform | Gaussian | 11.4 | 7.1 |
| Sub Gaussian pink noise | Uniform | 9.2 | 10.2 |
| Uniform | Uniform | 11.4 | 12.1 |
Making the signals uniform, causing them to be even more sub Gaussian, improved ICA’s results slightly. The biggest advantage, though, was seen in making the noise uniformly distributed, despite it being expected that RobustICA could separate the data when only one Gaussian source was present. ICA outperformed ACAR when the noise was uniform, but ACAR did stay within 1 dB. Interestingly, ACAR’s results were slightly improved by having uniformly distributed source signals. This could be explained by lower frequency signals having better odds of being correlated by chance, and the 1/f signals are skewed more towards the lower end of the frequency spectrum.
Signal Correlation
In general ACAR makes the assumption that the source signals are uncorrelated, and thus anything correlated across the recorded channels is considered noise. This is not always the case in practice, though, as signal data can propagate to multiple recording sites. To examine the performance of ACAR in this non-ideal, but realistic situation, a simulated data set was created in which the signals were created from mixing the independently generated sources.
For one condition a square matrix, with size equal to the number of data channels, was created with each element a uniform random number between 0 and 1. The original sources were then multiplied by this matrix to create the actual signals. For the second condition the mixing matrix was symmetric with all ones on the diagonal. The off-diagonal elements were chosen in the same manner as the previous condition except this time they were normalized by the difference in the row and column index. This means that each source is treated as local to one channel, but it spreads to neighboring channels with a gain proportional to distance. This behavior is similar to what can be expected in real physiological recordings. The results for these data sets are shown in Table VI.
TABLE VI.
SNR for correlated signals, calculated over 50 trials of 16 channel data with an initial SNR of 0.
| Condition | ACAR | ICA |
|---|---|---|
| Fully random | 4.5 | 7.7 |
| Spatially normalized | 8.0 | 7.7 |
ACAR was still able to improve the signal quality under the fully random condition. ICA outperformed ACAR in that case, and ICA received a modest boost in performance compared to previous results in which the sources were not mixed. For the spatially normalized condition, though, ACAR performed well and was on par with the results of ICA.
ACAR was still effective in these situations because the noise remained the dominant source in the recordings and the single dominant source is what the filter is designed to find. In the fully random condition an SNR of 0 dB means that the noise still on average contributes as much power to each channel as the independent sources combined. In the spatially normalized condition the noise is even more dominant due to the attenuation of the independent source by distance. This condition also makes it less likely that the spatial distribution of any signal source would overlap with the distribution of the noise and thus get removed along with the noise.
Changes in Noise Polarity
Finally, the effect of the polarity of the noise across channels was examined. For each condition, 50 trials of 20 second long data with an initial SNR of 0 dB were once again collected. In the ‘monopolar’ condition the noise was given the same polarity across all channels, but still had a random scaling factor between 0 and 1. In the ‘uniform’ condition the noise was added to each channel with the same polarity and scaling factor. For reference, the ‘bipolar’ condition used in previous tests is also included. This data allowed the results for the CAR to be included for comparison. The results are shown in Table VII.
TABLE VII.
SNR for different noise polarities, calculated over 50 trials of data with an initial SNR of 0 dB.
| Noise | ACAR | ICA | CAR |
|---|---|---|---|
| Monopolar | 9.3 ± 0.8 | 5.6 ± 0.8 | 4.7 ± 0.9 |
| Uniform | 9.3 ± 0.8 | 5.7 ± 1.0 | 11.8 ± 0.5 |
| Bipolar | 9.2 ± 0.9 | 5.7 ± 1.0 | −0.4 ± 0.6 |
Table VII shows that the ACAR and ICA performed consistently across all conditions. As expected the CAR performed poorly on the bipolar condition, better on the monopolar condition, and on the uniform condition exceeded even the performance of the ACAR. The uniform condition is the ideal situation for the CAR and in this case provides an upper bound on how well the ACAR could be expected to perform under those circumstances. The ACAR was unable to perfectly converge to the CAR for the uniform condition, but as the characteristics of the noise began to move away from the uniform condition the performance of the CAR dropped steeply while the ACAR maintained consistent performance.
B. Real Data
Human Data
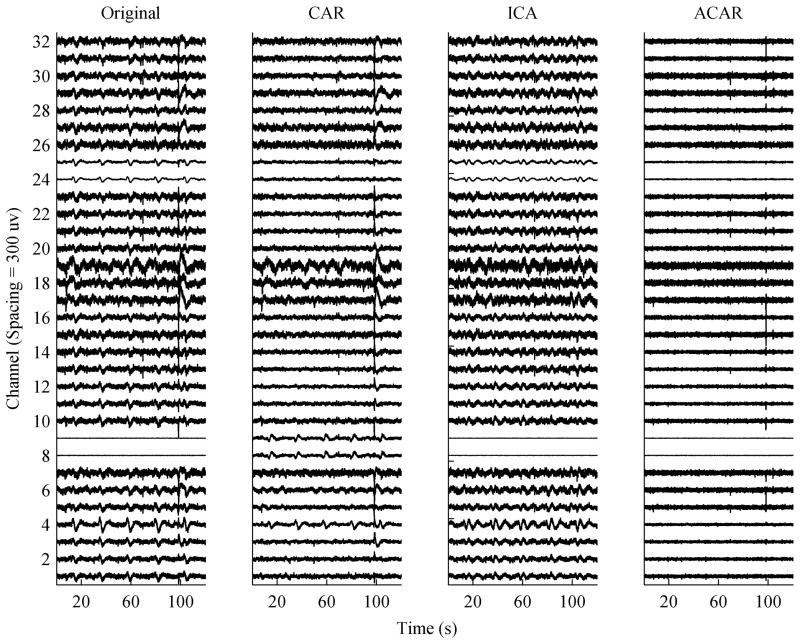
The results of the ACAR on real data were also promising. Fig. 7 shows the 32 channels of human-subject ECoG data after high-pass filtering at 0.1 Hz, and after application of a CAR, ICA, and the ACAR. Since the true signal was unknown, the ICA components and reconstructed signals were manually examined to determine the noise components. The determination was made by two experts in the analysis of neuronal population recordings. The raw data shows a highly periodic common-mode artifact from an unknown source in the data. It is unlikely the noise was physiological in nature due to its timing.
Fig. 7.
Real multi-channel data with artifacts correlated across channels. The data was processed by: (Left) high-pass filtering at 0.1 Hz, (Left-Middle) high-pass filtering and then using a standard CAR, (Right-Middle) high-pass filtering and then using ICA, (Right) applying the ACAR.
As shown, the CAR managed to clean the artifact much of the time for most channels. It struggled with some channels, though, such as 4 and 19, and it added the artifact to channels where it was not initially present, such as 8 and 9. It also failed to provide much improvement to the large artifact at around 100 seconds. This is probably partly due to the fact that there seems to be some polarity changes in that artifact across channels. ICA performed better than the CAR in not adversely affecting clean channels, but still failed to remove much of the contamination.
The ACAR consistently removed the periodic artifact, and avoided disturbing the channels where the artifact was not present. It also removed most of the large artifact, although a small spike is still noticeable which is most likely the result of the filter not adapting quickly enough to such a large artifact. It should be noted that due to amplifier characteristics the data had a large DC offset and low frequency drift, which is normally eliminated with a high pass filter. The ACAR was able to remove this offset and correlated drift on its own in addition to the periodic noise.
Non-human Primate Data
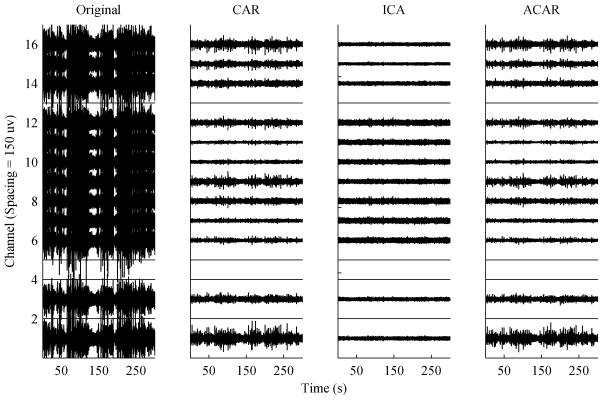
The 12 channel non-human primate data was more heavily contaminated due to constant jaw and tongue movement. As can be seen in Fig. 8, the original signals are nearly completely masked by the EMG artifacts. The recording was also affected more strongly by low frequency drift and to achieve optimal results a high-pass filter at 1 Hz was applied before all methods, including the ACAR. The ACAR was capable of removing the drift on its own, but if allowed to do so its performance removing the EMG noise decreased. In this data set the recording contained 16 channels, but channels 2, 4, 5, and 13 contained no data and were ignored during filtering. For easier visualization the open channels have been set to zero in Fig. 8.
Fig. 8.
Real multi-channel data with artifacts correlated across channels. The data was processed by high-pass filtering at 1 Hz and then: (Left) no additional filtering was used, (Left-Middle) a standard CAR was applied, (Right-Middle) ICA was used, (Right) the ACAR was applied.
As can be seen, the CAR performed well on this data. The result of the ACAR resembles that of the CAR, and only through close examination or overlaying the plots could it be seen that the ACAR reduced the artifacts by an insignificant amount more. This result is not surprising given that the contamination was monopolar and fairly uniform across channels. These conditions are ideal for the CAR, and it is good that the ACAR converged to nearly the same result. ICA performed extremely well in removing the noise, but this was at the expense of eliminating 5 out of the 12 components. It is unknown how much neural data was lost in the process. Without a knowledge of the true underlying signal, it is difficult to tell with certainty in this case whether the ICA result or the CAR and ACAR result is more desirable.
C. Example Application
As a final test, the ability of the ACAR to reveal information of interest from contaminated physiological signals was examined. A data set was obtained in which the same human subject discussed previously was able to accurately control the cursor in 2D space with a BCI to hit nearly 90% of targets [20]. This data set was originally free of significant contamination. Noise was added and then filtered back out to measure the success of the ACAR in recovering the important neural information in the signals.
The CAR was chosen as the main comparative algorithm for this data, since typically in real-time BCI applications it is a more commonly used and viable option than ICA. To allow the use of CAR, monopolar noise was used as in Table VII. To simulate the realistic power fluctuations in physiological noise and to prevent a biased CAR performance resulting from a single stationary noise mixture, the noise model with a variable mixture and SNR presented in Table IV was used. This model precludes the use of ICA as a viable method, as shown in Table IV by its poor performance with a variable mixture.
In an offline environment the signals were decoded using an elastic net algorithm with spectral power in 10 Hz bins from 0 to 200 Hz as the features [21]. For training, features were averaged over the presentation time of each cursor target, but for testing each timepoint was decoded individually as it would be in a real-time BCI. To minimize the effect of real-time error correction attempted by the subject only the first second of cursor movement data for each target was used. The data contained three sessions of data with a total of 176 targets and over 45,000 timepoints. Results were calculated with 10-fold cross validation.
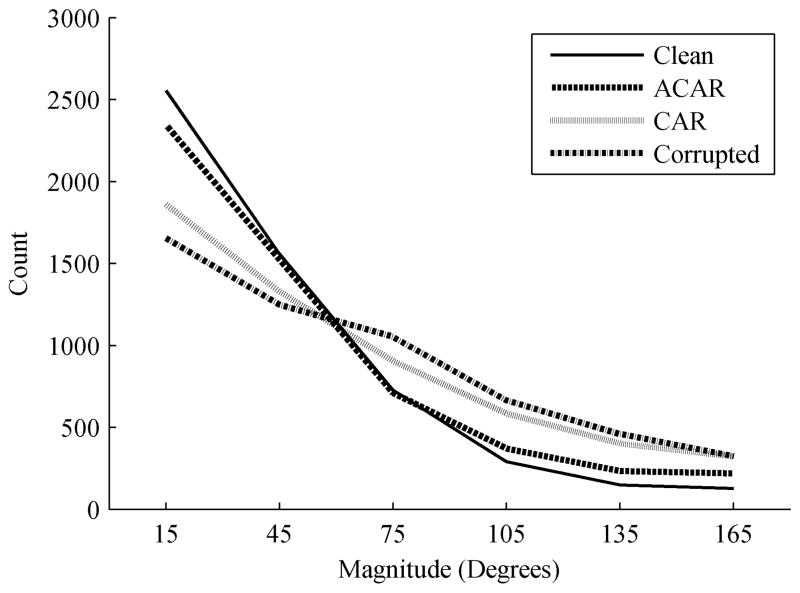
The original signals were first decoded, and then the noise was added and the decoding performed once again. The simulated noise ensured that the contamination would not be correlated with the desired decoder output, so the decoder performance should decrease from the corruption of the neural data. The noisy signals were then filtered with the ACAR and with the CAR and the resulting signals were again decoded. The main metric was the angle error between the direction to the desired target and the direction of movement determined by the decoder. For each signal condition, the distribution of this error is shown in Fig. 9. As expected, the error for the original signals was most tightly distributed towards 0 degrees. The distribution for the noisy signals was much flatter with more timepoints having larger errors. The CAR was able to improve upon the noisy distribution. The ACAR showed an even further improvement in more closely matching the performance of the original signal, indicating that it was best able to recover the underlying neural information.
Fig. 9.
Distribution of angle error magnitude in 2D movement of a cursor with a BCI.
V. CONCLUSIONS
A. Benefits of ACAR
The ACAR is a method for effectively removing common mode artifacts from multi-channel physiological recordings. The technique works even with polarity changes in the noise between channels. It was found to be effective with as few as 2 channels of data, with performance improving further as the number of channels increased. It also showed consistent results in improving signal quality to around 10 dB on data with an average SNR in the range of about −280 to 5 dB. At higher SNRs the ACAR could not generate an accurate noise reference and degraded the signal quality, but consistently kept its output between 3 and 5 dB. At these higher input SNR levels a filter would not be needed in most physiological recordings. A noise detector could also be added that only triggered the ACAR when the noise power reached a certain level.
In addition to reducing constant, spatially stationary noise, the ACAR was found to produce consistent results under variable noise conditions. This includes situations in which the noise power, mixing vector, or both were changing over time. This is important since most sources of real noise will drift slightly in power or spatial location, although probably not to the extent that was tested here. Real multi-channel physiological data also often contains correlation between the signals recorded by each channel, so this situation was tested as well. Although ACAR’s performance did decrease in some of these conditions, it still consistently improved signal quality.
Through visual inspection the ACAR was found to be effective in removing various artifacts from real data. Most conditions tested with both real and simulated data showed that for removing spatially correlated noise from multi-channel recordings, the ACAR was superior to a standard CAR and in many cases better than the RobustICA algorithm. This was with an implementation of the ICA algorithm in which an oracle determined the noise component that should be removed before reconstructing the signals. Additionally, the ACAR was able to improve the quality of the underlying neural signals of interest in real data that was corrupted by simulated noise.
The ACAR was used in a generalized form without changing any parameters across multiple conditions for simulated and real data, and so it should be easily usable in an automated fashion without configuration by expert personnel. Unlike ICA it can be easily implemented in real-time, which is a significant advantage for applications that need real-time analysis and processing, such as BCIs. The filter presented in this paper showed potential for reducing common mode artifacts in both recorded and real-time physiological data, and its performance here justifies further investigation and development.
B. Limitations and Future Work
The ACAR was shown to be an effective algorithm, but there are situations where it might not be the best choice for common mode artifact removal. Some of these examples were presented in this paper. When the noise had no polarity or amplitude changes across channels the standard CAR performed better. As the signals and the noise became less Gaussian, ICA improved to a point where it exceeded ACAR. Last, it was shown that correlation between the signals could decrease the performance of the ACAR. Although this result was expected, it is a highly realistic condition for multi-channel physiological recordings.
In general then, ICA would probably produce the most desirable results if computation time is not a factor and the signal and noise sources are known to be spatially stationary and non-Gaussian. The non-Gaussian restriction could be relaxed with a BSS algorithm that does not rely on higher order moments. If it is known that the noise is uniform across all channels of the recording then the CAR would most likely produce the best results. The ACAR offers an algorithm that performs well under a variety of conditions and is a good choice if the conditions needed by ICA or the CAR are not met or are unknown. The main weakness of the ACAR is if there is a high level of correlation between the signal sources, in which case ICA is most likely a better option as long as the previously mentioned requirements for ICA to perform well are met.
Source localization techniques used for neural data rely on the correlation between signals to find the dominant sources [22] (although some recent work has looked at the differences between channels [23]). It is important then that any filtering performed before source localization does not affect the signal correlation structure. The effect that ACAR has on this structure could vary greatly depending on factors such as SNR, the spatial layout of the noise and sources of interest, and the number of recorded channels. ACAR converges to a reference and spatial map for the most dominant source in the recording, which is expected to be noise. This property limits ACAR to only removing noise over one spatial distribution, but it should also prevent it from damaging correlation of signal sources. In the case where a source of interest is dominant, or where it has a spatial distribution similar to the dominant source, it would likely be corrupted by the ACAR. A full understanding of this interaction between ACAR and source localization, though, requires further investigation.
Additionally, the ability of ACAR to uncover the underlying signals of interest warrants further study. This topic was briefly examined in this paper, but further data sets with both real signals and real noise are needed for conclusive results. Spatial filters, such as the CAR, have been shown to improve the performance of EEG-based BCIs [24], [25]. Examining the effect of the ACAR on such experiments is an important step in determining the level of impact the ACAR can have on multi-channel physiological recordings.
Acknowledgments
This material is based upon work supported by a National Science Foundation Graduate Research Fellowship under Grant No. 0946825, the Quality of Life Technology Center under NSF Grant No. EEEC-0540865, the UPMC Rehabilitation Institute, the National Institutes of Health (NIH) Grants 3R01NS050256-05S1 and 8KL2TR000146-07, and the Craig H. Neilsen Foundation.
The authors would like to thank Dr. Michael Boninger, Dr. Aaron Batista, Alan Degenhart, and others in their associated laboratories for providing the ECoG data used in this paper. The help of Dr. Stephen Foldes and Dr. Brian Wodlinger in the examination of this ECoG data, as well as useful discussions with Dr. Xin Li, are also greatly appreciated
Biographies
John W. Kelly (S’04) was born in Oak Ridge, TN, in 1984. He received the B.S. degrees in both electrical and computer engineering in 2003, and the M.S. degree in electrical engineering, in 2004, both from North Carolina State University, Raleigh. In 2013 he completed his Ph.D. in electrical and computer engineering at Carnegie Mellon University, Pittsburgh, PA.
His previous positions include multiple summer internships and a job as a Software Developer at Oak Ridge National Laboratory and a summer internship at Y-12 National Security Complex. His recent research interests include automated methods for filtering and processing neural signals.
Dr. Kelly was a recipient of the National Defense Science and Engineering Graduate (NDSEG) Fellowship in 2008 and the NSF Graduate Research Fellowship in 2009.
Daniel P. Siewiorek (F79) received the B.S. degree in electrical engineering from the University of Michigan in Ann Arbor, MI, USA in 1968, and the M.S. and Ph.D. degrees in electrical engineering (minor in computer science) from Stanford University in Palo Alto, CA, USA in 1969 and 1972, respectively.
He is the Buhl University Professor of Electrical and Computer Engineering and Computer Science at Carnegie Mellon University. He has designed or been involved with the design of nine multiprocessor systems and has been a key contributor to the dependability design of over two dozen commercial computing systems. He leads an interdisciplinary team that has designed and constructed over 20 generations of mobile computing systems. He has written nine textbooks in the areas of parallel processing, computer architecture, reliable computing, and design automation in addition to over 475 papers. Currently he is Director of the Quality of Life Technology NSF Engineering Research Center. His previous positions include Director of the Human Computer Interaction Institute, Director of the Engineering Design Research Center, and co-founder and Associate Director of the Institute for Complex Engineered Systems.
Dr. Siewiorek is a Fellow of ACM and AAAS and is a member of the National Academy of Engineering. He has served as Chairman of the IEEE Technical Committee on Fault-Tolerant Computing, and as founding Chairman of the IEEE Technical Committee on Wearable Information Systems. He has been the recipient of the AAEE Frederick Emmons Terman Award, the IEEE/ACM Eckert-Mauchly Award, and the ACM SIGMOBILE Outstanding Contributions Award.
Asim Smailagic (F10) received the B.S. degree in electrical engineering in 1973, and the M.S. and Ph.D. degrees in computer science from the University of Sarajevo, Yugoslavia, in 1976 and 1984, respectively. He received the Fulbright postdoctoral award and completed post-doctoral studies in computer science at Carnegie Mellon University in 1988.
He is a Research Professor in the Institute for Complex Engineered Systems, College of Engineering, and Department of Electrical and Computer Engineering at Carnegie Mellon University. He is also Director of the Laboratory for Interactive and Wearable Computer Systems at CMU. He has written or edited several books in the areas of mobile computing, digital system design, and VLSI systems and has given keynote lectures at over a dozen representative international conferences.
Dr. Smailagic is the Chair of the IEEE Technical Committee on Wearable Information Systems. He has been a Program Chairman or Co-Chairman of IEEE conferences over ten times. He has had editorship roles in four IEEE Transactions journals - on Mobile Computing, Parallel and Distributed Systems, VLSI Systems, and Computers - the IEEE Journal on Selected Areas in Communications, Journal on Pervasive and Mobile Computing, etc. Dr. Smailagic received the 2000 Allen Newell Award for Research Excellence from the CMUs School of Computer Science, the 2003 Carnegie Science Center Award for Excellence in IT, and the 2003 Steve Fenves Systems Research Award from the CMUs College of Engineering.

Wei Wang (M’12) received the M.D. degree from Peking University Health Science Center (formerly Beijing Medical University), in Beijing, China in 1999. In 2002 he completed the M.Sc. degree in biomedical engineering at the University of Tennessee Health Science Center in Memphis, TN and in 2006 he received the Ph.D. degree in biomedical engineering from Washington University in St. Louis, St. Louis, MO, USA.
He is currently an Assistant Professor in the Department of Physical Medicine and Rehabilitation with a secondary appointment in the Department of Bioengineering at the University of Pittsburgh in Pittsburgh, PA, USA. Prior to joining the University of Pittsburgh, he served as a senior scientist at St. Jude Medical, Inc. in Sylmar, CA. His research interests include neural engineering, motor neuroprosthetics, brain-computer interfaces, rehabilitation of movement disorders, and motor system neurophysiology.
Dr. Wang currently holds a multidisciplinary clinical research scholar (NIH KL2) award from the University of Pittsburgh and is the chair of the IEEE Engineering in Medicine and Biology Pittsburgh chapter.
Footnotes
Personal use of this material is permitted. However, permission to use this material for any other purposes must be obtained from the IEEE by sending an email to pubs-permissions@ieee.org.
Contributor Information
John W. Kelly, Email: jwkelly@ece.cmu.edu, Dept. of Electrical and Comp. Eng., Carnegie Mellon University, Pittsburgh, PA 15213 USA.
Daniel P. Siewiorek, Email: dps@cs.cmu.edu, Dept. of Electrical and Comp. Eng., Carnegie Mellon University, Pittsburgh, PA 15213 USA.
Asim Smailagic, Email: asim@cs.cmu.edu, Dept. of Electrical and Comp. Eng., Carnegie Mellon University, Pittsburgh, PA 15213 USA.
Wei Wang, Email: wang-wei3@pitt.edu, Department of Physical Medicine and Rehabilitation, University of Pittsburgh, Pittsburgh, PA 15213 USA.
References
- 1.Kelly JW, Siewiorek DP, Smailagic A, Collinger JL, Weber DJ, Wang W. Fully automated reduction of ocular artifacts in high-dimensional neural data. IEEE T on Biomed Eng. 2011 Mar;58(3):598–606. doi: 10.1109/TBME.2010.2093932. [DOI] [PubMed] [Google Scholar]
- 2.Kelly JW, Collinger JL, Degenhart AD, Siewiorek DP, Smailagic A, Wang W. Frequency Tracking and Variable Bandwidth for Line Noise Filtering without a Reference. Conf of the IEEE Eng in Med and Bio Soc. 2011 doi: 10.1109/IEMBS.2011.6091950. [DOI] [PubMed] [Google Scholar]
- 3.Fatourechi M, Bashashati A, Ward RK, Birch GE. EMG and EOG artifacts in brain computer interface systems: A survey. Clin Neurophys. 2007 Mar;118(3):480–94. doi: 10.1016/j.clinph.2006.10.019. [DOI] [PubMed] [Google Scholar]
- 4.Goncharova II, McFarland DJ, Vaughan TM, Wolpaw JR. EMG contamination of EEG: spectral and topographical characteristics. Clin Neurophys. 2003;114(9):1580–1593. doi: 10.1016/s1388-2457(03)00093-2. [DOI] [PubMed] [Google Scholar]
- 5.De Vos M, Vos DM, Riès S, Vanderperren K, Vanrumste B, Alario FX, Van Huffel S, Huffel VS, Burle B. Removal of muscle artifacts from EEG recordings of spoken language production. Neuroinform. 2010 Jun;8(2):135–50. doi: 10.1007/s12021-010-9071-0. [DOI] [PubMed] [Google Scholar]
- 6.Donoghue JP. Bridging the brain to the world: a perspective on neural interface systems. Neuron. 2008 Nov;60(3):511–21. doi: 10.1016/j.neuron.2008.10.037. [DOI] [PubMed] [Google Scholar]
- 7.Wang W, Collinger J, Perez M, Tyler-Kabara E, Cohen L, Birbaumer N, Brose S, Schwartz A, Boninger M, Weber DJ. Neural interface technology for rehabilitation: exploiting and promoting neuroplasticity. Phys Medi and Rehab Clinics of N Amer. 2010;21(1):157–178. doi: 10.1016/j.pmr.2009.07.003. [DOI] [PMC free article] [PubMed] [Google Scholar]
- 8.Offner F. The EEG as potential mapping: the value of the average monopolar reference. Electroenceph and Clin Neurophys. 1950 doi: 10.1016/0013-4694(50)90040-x. [DOI] [PubMed] [Google Scholar]
- 9.Widrow B, Glover J, McCool J, Kaunitz J, Williams C, Hearn R, Zeidler J, Eugene Dong J, Goodlin R. Adaptive noise cancelling: principles and applications. Proc of the IEEE. 1975;63(12):1692–1716. [Google Scholar]
- 10.Dien J. Issues in the application of the average reference: review, critiques, and recommendations. Behavior Research Meth Instr Comp. 1998 Mar;30(1):34–43. [Google Scholar]
- 11.Bashashati A, Fatourechi M, Ward RK, Birch GE. A survey of signal processing algorithms in brain-computer interfaces based on electrical brain signals. J of Neural Eng. 2007 Jun;4(2):R32–57. doi: 10.1088/1741-2560/4/2/R03. [DOI] [PubMed] [Google Scholar]
- 12.Jung TP, Makeig S, Westerfield M, Townsend J, Courchesne E, Sejnowski TJ. Removal of eye activity artifacts from visual event-related potentials in normal and clinical subjects. Clin Neurophys. 2000 Oct;111(10):1745–58. doi: 10.1016/s1388-2457(00)00386-2. [DOI] [PubMed] [Google Scholar]
- 13.Haykin S. Adaptive Filter Theory. 3. Upper Saddle River, NJ: Prentice Hall; 1996. [Google Scholar]
- 14.Lim JS, Oppenheim AV. Advanced Topics in Signal Processing. Englewood Cliffs, NJ: Prentice Hall; 1988. [Google Scholar]
- 15.Widrow B, Mantey PE, Griffiths LJ, Goode BB. Adaptive antenna systems. Proc of the IEEE. 1967;55(12):2143–2159. [Google Scholar]
- 16.Zarzoso V, Comon P. Robust independent component analysis by iterative maximization of the kurtosis contrast with algebraic optimal step size. IEEE T on Neural Networks. 2010;21(2):248–261. doi: 10.1109/TNN.2009.2035920. [DOI] [PubMed] [Google Scholar]
- 17.Belouchrani A, Abed-Meraim K, Cardoso JF, Moulines E. A blind source separation technique using second-order statistics. IEEE T on Sig Proc. 1997;45(2):434–444. [Google Scholar]
- 18.Degenhart AD, Kelly JW, Ashmore RC, Collinger JL, Tyler-Kabara EC, Weber DJ, Wang W. Craniux: a LabVIEW-based modular software framework for brain-machine interface research. Comp Intell and Neuro. 2011 Jan;2011 doi: 10.1155/2011/363565. [DOI] [PMC free article] [PubMed] [Google Scholar]
- 19.Keshner M. 1/f noise. Proc of the IEEE. 1982;70(3):212–218. [Google Scholar]
- 20.Wang W, Collinger J, Degenhart A, Tyler-Kabara E, Schwartz A, Moran D, Weber D, Wodlinger B, Vinjamuri R, Ashmore R, Kelly J, Boninger M. An electrocorticographic brain interface in an individual with tetraplegia. PloS One. 2013 Feb;8(2):e55344. doi: 10.1371/journal.pone.0055344. [DOI] [PMC free article] [PubMed] [Google Scholar]
- 21.Kelly JW, Degenhart AD, Siewiorek DP, Smailagic A, Wang W. Sparse linear regression with elastic net regularization for brain-computer interfaces. Conf of the IEEE Eng in Med and Bio Soc. 2012 Aug;2012:4275–8. doi: 10.1109/EMBC.2012.6346911. [DOI] [PubMed] [Google Scholar]
- 22.Van Veen BD, van Drongelen W, Yuchtman M, Suzuki A. Localization of brain electrical activity via linearly constrained minimum variance spatial filtering. IEEE transactions on bio-medical engineering. 1997 Sep;44(9):867–80. doi: 10.1109/10.623056. [DOI] [PubMed] [Google Scholar]
- 23.Zhang J, Sudre G, Li X, Wang W, Weber DJ, Bagic A. Task-related MEG source localization via discriminant analysis. Conf of the IEEE Eng in Med and Bio Soc. 2011 Jan;2011:2351–4. doi: 10.1109/IEMBS.2011.6090657. [DOI] [PubMed] [Google Scholar]
- 24.Foldes ST, Taylor DM. Offline comparison of spatial filters for two-dimensional movement control with noninvasive field potentials. J of Neural Eng. 2011 Aug;8(4):046022. doi: 10.1088/1741-2560/8/4/046022. [DOI] [PubMed] [Google Scholar]
- 25.McFarland DJ, McCane LM, David SV, Wolpaw JR. Spatial filter selection for EEG-based communication. Electroenceph and Clin Neurophys. 1997 Sep;103(3):386–94. doi: 10.1016/s0013-4694(97)00022-2. [DOI] [PubMed] [Google Scholar]


