Abstract
Traditional fabrication methods for polymer microchips, the bonding of two substrates together to form the microchip, can make the integration of carbon electrodes difficult. We have developed a simple and inexpensive method to integrate graphite/PMMA composite electrodes (GPCEs) into a PMMA substrate. These substrates can be bonded to other PMMA layers using a solvent-assisted thermal bonding method. The optimal composition of the GPCEs for electrochemical detection was determined using cyclic voltammetry with dopamine as a test analyte. Using the optimized GPCEs in an all-PMMA flow cell with flow injection analysis, it was possible to detect 50 nM dopamine under the best conditions. These electrodes were also evaluated for the detection of dopamine and catechol following separation by microchip electrophoresis (ME).
Keywords: carbon electrode, carbon paste electrode, graphite/PMMA composite electrode, microchip electrophoresis, and polymer microchip
1 Introduction
Reports of the use of microfluidic systems for analytical applications have increased significantly over the last 10 years [1–6]. There are many reasons to perform analytical chemistry at the micron scale, including low reagent use (μL–mL), small sample volume requirements (nL–μL), and fast analysis time (s–min) [7]. Microfluidic analytical systems can also be directly coupled to sampling methods such as microdialysis as well as integrated with other processes such as sample preparation or cell sorting [8–10]. However, one of the challenges of these microfluidic systems is the incompatibility of such small sample volumes with many detection methods.
Electrochemical detection (EC) is ideal for microfluidic devices in many ways [11–15]. Miniaturization can be achieved without loss of sensitivity, and many biological analytes are electrochemically active. Carbon electrodes are of special interest due to their large potential window, facile kinetics for the oxidation of organic compounds, and minimal fouling with biological samples [16]. Carbon-based electrodes have been employed previously in polydimethylsiloxane (PDMS) microfluidic devices [17, 18]. In this case, electrodes can be placed directly into or on the electrode substrate because PDMS is soft enough to conform to small raised features of micron thickness, such as those in carbon ink or carbon fiber electrodes [19–21]. However, integration of carbon electrodes into microfluidic devices composed of rigid plastic substrates such as polymethlymethacrylate (PMMA) can be especially challenging. This is due to the fact that the surfaces of the two substrates containing the channel and the electrode, respectively, must be flush with one another to ensure proper bonding. Most electrode fabrication methods such as screen printing [22] and metal deposition [23, 24] produce raised electrodes on the surface of the substrate and, therefore, interfere with the bonding process.
Carbon paste and ink are comprised of a carbon source (e.g. graphite or carbon nanotubes) and a binding agent [25]. The resulting mixture is malleable and, therefore, can conform to a feature etched in a plastic substrate [26]. For carbon paste electrodes (CPE), additives are frequently added to the mixture to chemically modify the surface or reduce the resistance of the paste [27, 28]. There are too many additives and binders to list fully here, but mineral oil and organic solvents are most commonly employed [29]. These CPE electrodes can be very sensitive and selective [30]. However, they can also suffer from mechanical instability. Hydrodynamic flow can disrupt the carbon paste due to increased shear stress and erode the CPE [31, 32].
Carbon paste has been screen printed on and embedded into PDMS microchips to form electrodes for ME-EC [33, 34]. Sameenoi et al. described a carbon paste electrode embedded in PDMS. By mixing graphite with uncured PDMS as a binding agent, then curing the CPE in a PDMS channel (fabricated using soft lithography), they were able to create mechanically stable electrodes. The channel layer, also made from PDMS, could then be irreversibly sealed over the carbon paste electrodes to form an all PDMS microchip used for flow-injection analysis [35]. Johnson et al. were able to incorporate rigid materials such as metals, glassy carbon, and carbon fiber bundles into an epoxy by pouring the resin and hardener over the electrode material and polishing the surface once the epoxy was cured. Thus, one or multiple types of embedded electrode material could be used as one layer, and a PDMS substrate with channels was used as the other layer, forming a complete microchip [36]. Both of these methods require PDMS to be at least one of the layers in the microchip.
In 2008, Dai et al. reported the development of an electrode material similar to CPE that was produced by mixing monomethlymethacrylate (MMA) with graphite powder. The MMA was then polymerized in a glass capillary to produce a graphite/PMMA composite. These electrodes were shown to be quite versatile and were employed for the detection of vitamin C using electrogenerated chemiluminescence [37], amperometric detection of NADH [38], and the oxidation of guanine or adenine for quantitation of single-stranded DNA [39].
In this paper, we describe a simple and inexpensive method to fabricate graphite/PMMA composite electrodes (GPCEs) into rigid PMMA substrates. The effect of electrode composition on the electrochemical response for dopamine was evaluated using cyclic voltammetry (CV). These GPCEs were then fabricated directly in a PMMA substrate to form an all-PMMA microchip for flow-injection analysis. In addition, the PMMA/GPCE substrates were evaluated for microchip electrophoresis (ME) with electrochemical detection using PDMS as the channel substrate and catechol and dopamine as model compounds.
2 Materials and methods
2.1 Materials
Dopamine, potassium chloride (KCl), catechol, 2-(N-morpholino) ethanesulfonic acid (MES), and graphite powder (<100 μm) were purchased from Sigma-Aldrich (St. Louis, MO, USA). Colloidal silver was received from Ted Pella, Inc. (Redding, CA, USA). PMMA was acquired from McMaster-Carr (Elmhurst, IL, USA). Acetone, parafilm, and Kimwipes were obtained from Fisher Scientific (Waltham, MA, USA). Monosodium phosphate monohydrate was received from Acros (Geel, Belgium) and dibasic sodium phosphate heptahydrate was obtained from Mallinckrodt AR (Phillipsburg, NJ, USA). PDMS monomer and curing agent (Dow Corning, Elizabethtown, KY, USA) were also used in microchip fabrication. All aqueous buffers and solutions were prepared with 18.2 MO water (Millipore, Kansas City, MO, USA). Stock solutions of 10 mM dopamine and catechol were made fresh daily in water. Sample solutions were prepared from the stock solutions in 50 mM sodium phosphate buffer at pH 7, unless otherwise indicated.
2.2 Graphite composite electrode fabrication
A stock solution of 10 mg PMMA/mL of acetone was created by dissolving solid PMMA in acetone and sonicating for approximately 5 h with the container covered by parafilm (for safety reasons, do not heat a tightly sealed container), then replacing any volume lost to evaporation. Different concentrations of the PMMA solution were then prepared by adding acetone to the stock solution and vortexing in an airtight container. Graphite composite was prepared by mixing different ratios of graphite powder and different concentrations of the PMMA solution. Electrode fabrication was accomplished using the following procedure. 1) Using Corel Draw and a CO2 laser with 0.8% speed, 3% power, 1000 dpi settings (Universal, Scottsdale, AZ, USA), trenches were cut into solid PMMA. The process was repeated three times while varying the position of the laser by 0.01 in to create a smooth trench ~100 μm × ~100 μm. 2) The trenches were filled with the carbon composite using a syringe. 3) The excess paste was removed using sonication followed by surface smoothing using Kimwipes and acetone. The resulting composite electrode was placed in an oven at 110°C for at least 10 min, then the temperature was increased to 160°C and held for 2 h; the oven was then cooled to 80°C over 1–2 h. If the final electrode surface was not flush with the PMMA substrate and/or did not have a reflective surface, steps 1 and 2 were repeated. A diagram of the process can be found in the supplementary information (S1). The entire process takesapproximately 6 hours start to finish (for 1–50 electrodes). Four hours of that time is dedicated to heating and cooling the electrodes, so the number of electrodes that can be made in 6 hours is dictated mostly by the size of the oven and the substrates themselves. Approximately 23% of the electrodes exhibited limits of detection of 15 micromolar or less for dopamine.
2.3 Electrochemical measurements
Cyclic voltammetry and amperometric detection measurements were performed using an 812c potentiostat (CH Instruments, Inc., Austin, TX, USA). The electrochemical detector consisted of a GPCE working electrode (unless otherwise noted), a platinum wire auxiliary electrode, and an Ag/AgCl reference electrode (Bioanalytical Systems, Inc., West Lafayette, IN, USA). All cyclic voltammograms were performed at a scan rate of 100 mV/s using a 1 mV sampling rate. Peak height and peak potential were determined from the CVs using Origin 8.6 software (OriginLab, Northampton, MA, USA) following baseline subtraction. Amperometric detection for the microchip electrophoresis experiments was performed using an electrically isolated potentiostat (Pinnacle Technology, Lawrence, KS, USA) with an Ag/AgCl reference electrode (Bioanalytical Systems) and a GPCE working electrode. A 3 mm diameter glassy carbon electrode (Bioanalytical Systems was used as a working electrode; it was prepared by polishing the surface with an alumina slurry (Bioanalytical Systems) then sonicating in water (18.2 MΩ) for at least 10 s to remove residual alumina. The electrophoretic separation was accomplished using a high voltage power supply (Ultravolt Inc., Ronkonkoma, New York, USA) that was controlled using Labview hardware and software (National Instruments, Austin, TX, USA). All Labview software was written in-house.
2.4 PMMAflow injection device
A flow channel cut into a piece of PMMA flow cell was created using the same laser ablation process aswith the electrode trench, resulting in a channel 0.7 in long, ~ 100 μm wide, and ~100 μm deep. An inlet was made using a 35 gauge needle, and an outlet (6 mm diameter) was cut using a CO2 laser. The “channel PMMA” plate and the “electrode PMMA” plate were bonded together using the following procedure. 1) The two PMMA pieces were placed together and 1–2 drops of a solvent (75% IPA and 25% acetone) were placed at the seam of the interface. This allowed capillary action to create a thin layer of solvent between the two pieces. The two layers were aligned without allowing the solvent to evaporate and then placed between two pieces of glass. 2) Pressure was applied using a C-clamp, and everything was placed in an oven at 110°C for at least 15 min. Nanoports (Upchurch Scientific, Oak Harbor, WA, USA) were then affixed using epoxy. A schematic of the procedure can be found in the supplementary information (S2).
Electrical connection to the graphite/PMMA composite electrode was accomplished using copper wire and colloidal silver. Flow injection experiments were accomplished using a syringe pump (Harvard Apparatus, Holliston, MA, USA) at flow rate of 20 μL/min. The analysis buffer was 50 mM sodium phosphate (pH 7). Samples were injected using a 5 μL sample loop and a six port Rheodyne 7725i valve (Bioanalytical Systems) into the flow cell. The working electrode was set at 500 mV vs. Ag/AgCl.
2.5 Fabrication and operation of the hybrid PDMS/PMMA ME-EC device
The fabrication of a simple “T” PDMS microchip has been described in detail elsewhere [23]. Briefly, a solution of 20 parts PDMS monomer and 1 part curing agent by weight was prepared and mixed. The pre-polymer was then poured onto a silicon wafer with raised SU-8 micro-channel features The PDMS was allowed to de-gas and harden on the wafer for 8 h. The resulting polymerized PDMS with recessed channels 40 μm wide and 40 μm deep was peeled from the wafer; reservoirs were created with biopsy punches (Harris Uni-core, Ted Pella). The PDMS channel layer was reversibly bonded to the substrate containing the graphite/PMMA composite electrode (GPCE) [12]. A diagram of the simple T microchip with the length of the side arms at 0.75 cm and the separation channel 3.5 cm is shown in Figure 1A. The electrode (~100 μm wide) was placed partly in-channel and partly end-channel (Fig. 1B). The PDMS channels were then conditioned sequentially with 0.1 M NaOH, water, and 10 mM MES pH 6 buffer solutions. Samples were introduced into the separation channel using a gated injection scheme [33, 34]. A field strength of 77 V/cm was used for all separations.
Figure 1.
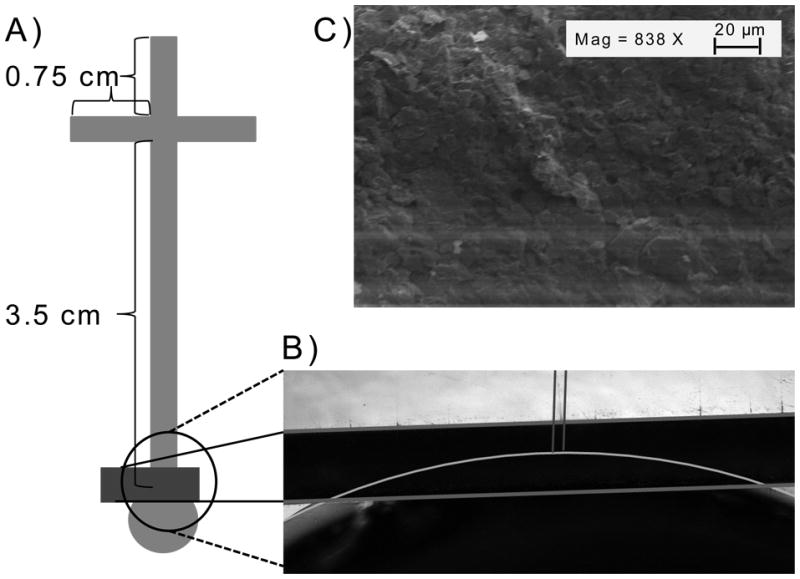
A) A diagram of the PDMS microchip for ME-EC showing the dimemsions of the channels and the placment of the GPCE. B) A micrograph of the GPCE highlighting the electrode placement in the microchip. C) An SEM of the surface of the optimized GPCE.
3 Results and discussion
3.1 Graphite/PMMA composition optimization
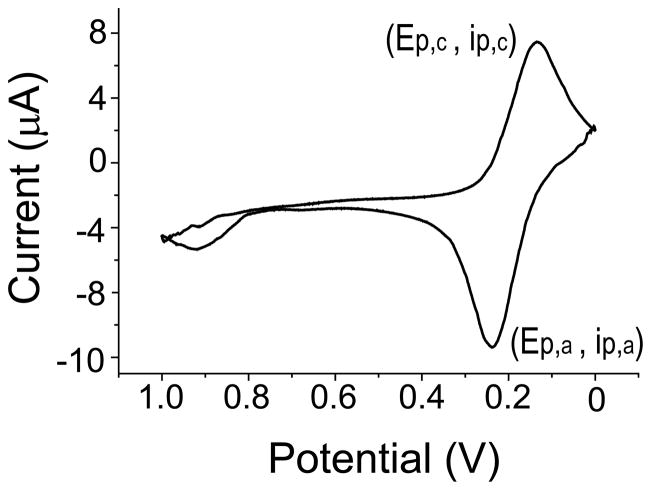
Cyclic voltammetry was used to determine the peak current (ip) and peak potential (Ep) for the anodic (Ep,a, ip,a) and cathodic peaks (Ep,c, ip,c) of 2 mM dopamine in 50 mM phosphate (pH 7) buffer as shown in Figure 2. To determine the optimal PMMA solution concentration, the graphite:PMMA ratio was held constant at 20:1 (w/w) and the PMMA solution concentration (mg PMMA/mL acetone) was varied (n = 3 for each concentration). The electrochemical results for those electrodes are shown in shown in Figure 3A. Electrodes prepared using PMMA solution concentrations of 8 and 10 mg/mL exhibited the lowest average anodic peak potential (~320 mV) and the highest peak current (~1.31 μA) for dopamine and were not statistically different from each other. However, the standard deviation for the peak current of the 10 mg/mL concentration was almost 2× higher than that for the 8 mg/mL concentration. This is probably due to the fact that the 10 mg/mL concentration was more viscous and, thus, there was incomplete mixing of the graphite. Therefore, the 8 mg/mL PMMA solution concentration was considered optimal and used for future experiments.
Figure 2.
A background-subtracted cyclic voltammogram (CV) of 2 mM dopamine in 50 mM phosphate buffer at pH 7, with GPCE (~100 μm wide × 100 μm deep) working, Pt auxilary, and Ag/AgCl reference electrodes.
Figure 3.
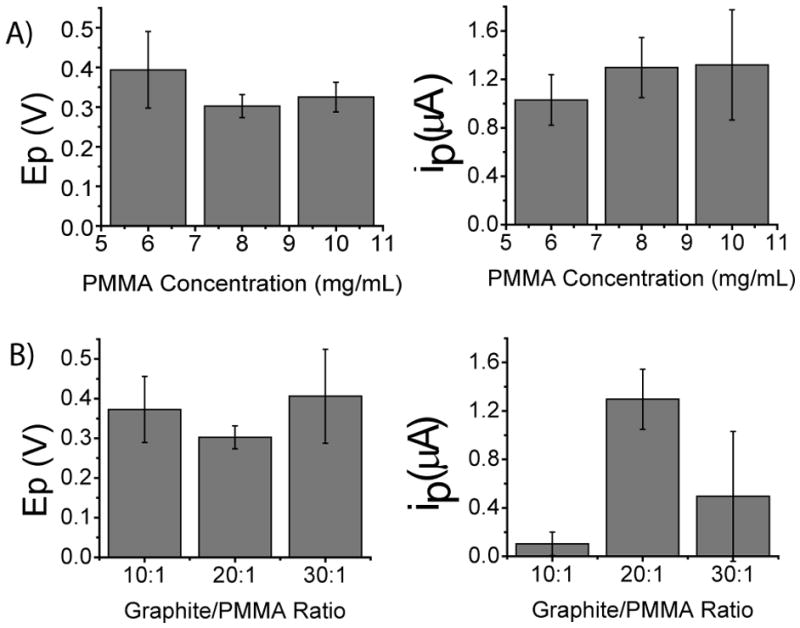
Data obtained from baseline-subtracted response for the oxidation of 2 mM dopamine. A) The potential (Ep) and the current (ip) for electrode composites with 20:1 graphite:PMMA compostition and varying PMMA solution concentration. B) The potential (Ep) and the current (ip) for electrode composites with a constant PMMA solution concentration of 8 mg/mL and varying graphite:PMMA ratio.
Using the optimal PMMA solution concentration, the ratio of graphite:PMMA (w/w) was then varied. These results are shown in Figure 3B. The 20:1 graphite:PMMA ratio exhibited the lowest peak oxidation potential for dopamine and, more importantly, the highest oxidation current, (1.30 ± 0.2 μA); this was more than 2.5 times higher than the 30:1graphite:PMMA ratio, which was the next highest. Therefore, the optimal electrode composition was determined to be a PMMA concentration of 8 mg/mL with a graphite/PMMA ratio of 20:1. This resulted in an average ip,a of 1.30 ± 0.2 μA and an Ep,a of 300 ± 30 mV. All further electrode characterization was performed with a GPCE prepared using a 20:1graphite:PMMA ratio and 8 mg/mL PMMA solution.
Lastly, the performance of the GPCE was compared to that of the most commonly used carbon material, glassy carbon. Since dopamine exhibits a chemically reversible oxidation, the ΔEp, or difference in the anodic and cathodic peak potential, was measured for both electrode types. The ΔEp for glassy carbon and the optimized GPCE were 0.21 ± 0.03, and 0.15 ± 0.03 V, respectively, using the same experimental conditions. The lower ΔEp suggests that the GPCEs are less resistive and have more facile reduction and oxidation kinetics [42].
3.2 GCPE characterization
3.2.1 Detection of dopamine using flow injection analysis
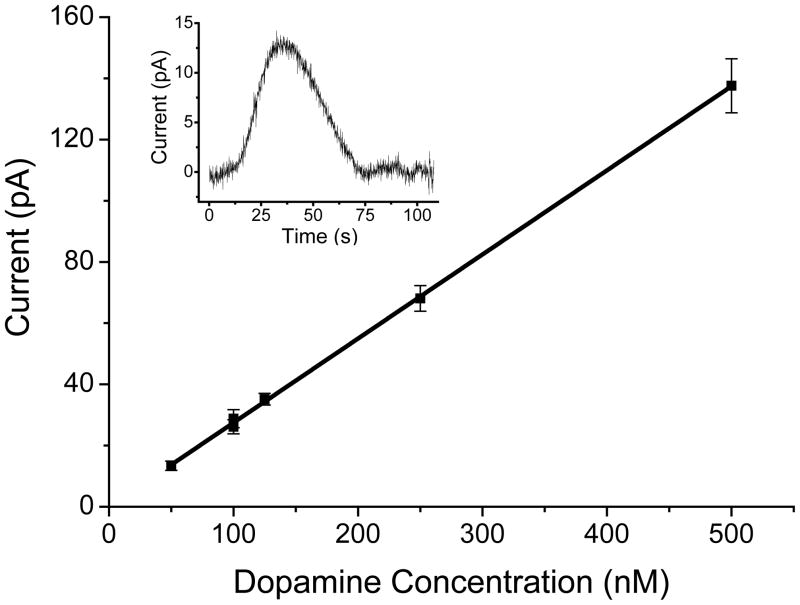
Three separate optimized GPCE electrodes were evaluated by flow injection analysis using PMMA flow cells and dopamine as the test analyte. Figure 4 shows the calibration curve obtained with the best electrode using five solutions ranging in concentration from 50 to 500 nM. All the electrodes fabricated during this study exhibited excellent linearity, with R2 values not less than 0.90. However, the dynamic range varied from electrode to electrode. The sensitivities of the three electrodes varied within an order of magnitude, ranging from 30–300 pA/μM. The noise varied over three orders of magnitude (pA–nA), which led to calculated limits of detection (LOD) (S/N >3) ranging from 14 μM–50 nM. The inset in Figure 4 shows the response obtained from the best of the three electrodes for a solution containing 250 pmol of dopamine (S/N = 5).
Figure 4.
A calibration curve (R2 = 0.999) for flow injection analysis using the all-PMMA flow microchip with an integrated GPCE. (Inset: 50 nM dopamine peak using the all-PMMA flow microchip and integrated GPCE with flow-injection analysis.)
The surface characteristics of the GCPE, which include a rough surface with many edge features as shown in Figure 1C, may be the major contributing factor to such low limits of detection, which agrees with other published reports [27]. The variations in both the surface and the internal structure of the electrode, such as different amounts of graphite on the surface and trapped microair bubbles, respectively, may be the reason for such a large amount of variation in the noise. More detail on how the variations affect conductivity and how noise can be mitigated is provided in supplementray information (S3). These defects are most likely due to the fact that each electrode is made by hand one at a time. However, the cost in both money (<$0.10 per electrode on a 2 × 2 in substrate) and time (>50 electrodes fabricated per day, start to finish) is small; thus, electrodes with unacceptable noise levels can be discarded.
3.2.2 Electrophoretic separation
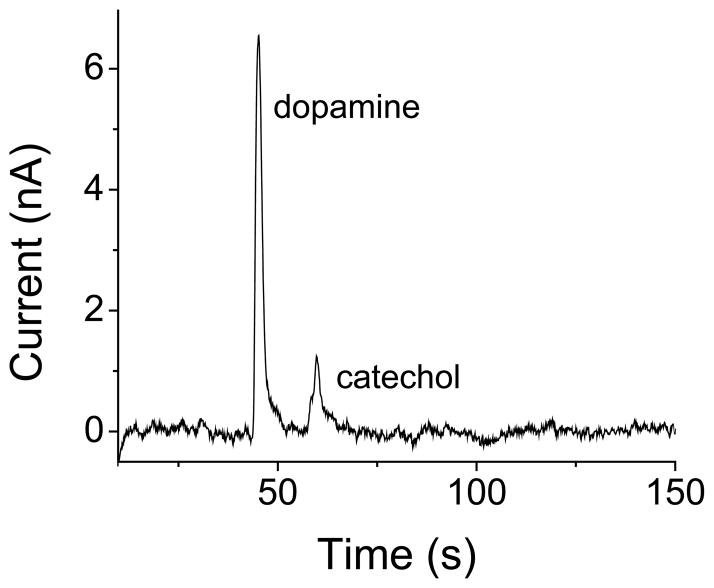
Using a PDMS microchip reversibly sealed on a GPCE PMMA substrate (as shown in Fig. 1A and B), ME was performed with amperometric detection. Due to the relatively large size of the electrode (~100 μm wide) in comparison with the separation channel (40 μm wide), the electrode placement was both in- and end-channel, as shown in Figure 1B. The resulting electropherogram for 100 μM dopamine and catechol is shown in Figure 5. The baseline noise was significally higher for the electrophoresis experiments than for flow-injection analysis. In-channel alignment was used in these experiments, and the large electrode was not well decoupled from the electric field. Although the separation and detection conditions were not optimized, this electropherogram demonstrates that this electrode can be used for ME-EC. It was stable under electroosmotic flow conditions, and the same electrode was used with multiple PDMS microchips over several days.
Figure 5.
Separation and detection of 100 μM dopamine and catechol using ME-EC.
4 Concluding remarks
In this paper, the fabrication of an inexpensive graphite/PMMA composite electrode that can be integrated into an all-PMMA microfluidic device is reported. In addition, the use of the electrode in a PMMA/PDMS hybrid chip for microchip electrophoresis is also demonstrated. These inexpensive, simple-to-fabricate electrodes can exhibit low LODs and low noise. Also, these GPCE are stable and can withstand high flow rates (20 μL/min) and electrophoretic fields. However, each electrode must be individually evaluated and calibrated, due to electrode-to-electrode variability. Our future efforts will be the integration of these GPCEs into an all-PMMA microchip for microchip electrophoresis with electrochemical detection and further work on fabrication reproducibility.
Supplementary Material
Acknowledgments
The authors thank Pinnacle Technologies for the isolated potentiostat. We also thank the Ralph N. Adams Institute, the University of Kansas, and the National Institutes of Health (R01 NS042929 and R21 5R43NS064644) for their support. We would also like to acknowledge Ryan Grigsby, the Director of the Adams Institute Microfabrication Facility at the University of Kansas, for developing the Labview software and hardware support and Nancy Harmony for her assistance in preparation of the manuscript.
Glossary
- GPCE
graphite/PMMA composite electrode
- CPE
carbon paste electrode
- CV
cyclic voltammetry
References
- 1.Soe AK, Nahavandi S, Khoshmanesh K. Biosens Bioelectron. 2012;35:1–13. doi: 10.1016/j.bios.2012.02.012. [DOI] [PubMed] [Google Scholar]
- 2.Arora A, Simone G, Salieb-Beugelaar GB, Kim JT, Manz A. Anal Chem. 2010;82:4830–4847. doi: 10.1021/ac100969k. [DOI] [PubMed] [Google Scholar]
- 3.Lapos JA, Manica DP, Ewing AG. Anal Chem. 2002;74:3348–3353. doi: 10.1021/ac025504p. [DOI] [PubMed] [Google Scholar]
- 4.Kappes T, Schnierle P, Hauser PC. Anal Chim Acta. 1999;393:77–82. [Google Scholar]
- 5.Kovarik ML, Ornoff DM, Melvin AT, Dobes NC, Wang Y, Dickinson AJ, Gach PC, Shah PK, Allbritton NL. Anal Chem. 2012;85:451–472. doi: 10.1021/ac3031543. [DOI] [PMC free article] [PubMed] [Google Scholar]
- 6.Garcia CD. Bioanalysis. 2012;4:1717–1722. doi: 10.4155/bio.12.118. [DOI] [PMC free article] [PubMed] [Google Scholar]
- 7.Noh J, Kim HC, Chung TD. In: Microfluidics: Technologies and Applications. Lin BC, editor. Springer-Verlag Berlin; Berlin: 2011. pp. 117–152. [Google Scholar]
- 8.Giordano BC, Burgi DS, Hart SJ, Terray A. Anal Chim Acta. 2012;718:11–24. doi: 10.1016/j.aca.2011.12.050. [DOI] [PubMed] [Google Scholar]
- 9.Nandi P, Desaias DP, Lunte SM. Electrophoresis. 2010;31:1414–1422. doi: 10.1002/elps.200900612. [DOI] [PubMed] [Google Scholar]
- 10.Lin CC, Hsu JL, Lee GB. Microfluid Nanofluid. 2011;10:481–511. [Google Scholar]
- 11.Vilela D, Anson-Casaos A, Martinez MT, Gonzalez MC, Escarpa A. Lab on a Chip. 2012;12:2006–2014. doi: 10.1039/c2lc40099e. [DOI] [PubMed] [Google Scholar]
- 12.Matysik FM. Microchim Acta. 2008;160:1–14. [Google Scholar]
- 13.Ghanim MH, Abdullah MZ. Talanta. 2011;85:28–34. doi: 10.1016/j.talanta.2011.04.069. [DOI] [PubMed] [Google Scholar]
- 14.Fischer DJ, Hulvey MK, Regel AR, Lunte SM. Electrophoresis. 2009;30:3324–3333. doi: 10.1002/elps.200900317. [DOI] [PMC free article] [PubMed] [Google Scholar]
- 15.Vandaveer WR, Pasas-Farmer SA, Fischer DJ, Frankenfeld CN, Lunte SM. Electrophoresis. 2004;25:3528–3549. doi: 10.1002/elps.200406115. [DOI] [PubMed] [Google Scholar]
- 16.McCreery RL. Chem Rev. 2008;108:2646–2687. doi: 10.1021/cr068076m. [DOI] [PubMed] [Google Scholar]
- 17.Ding Y, Ayon A, García CD. Anal Chim Acta. 2007;584:244–251. doi: 10.1016/j.aca.2006.11.064. [DOI] [PubMed] [Google Scholar]
- 18.Omiatek DM, Santillo MF, Heien ML, Ewing AG. Anal Chem. 2009;81:2294–2302. doi: 10.1021/ac802466g. [DOI] [PMC free article] [PubMed] [Google Scholar]
- 19.Wang J, Pumera M, Chatrathia MP, Rodriguez A, Spillman S, Martin RS, Lunte SM. Electroanalysis. 2002;14:1251–1255. [Google Scholar]
- 20.Kovarik ML, Torrence NJ, Spence DM, Martin RS. Analyst. 2004;129:400–405.21. doi: 10.1039/b401380h. [DOI] [PubMed] [Google Scholar]
- 21.Gawron AJ, Martin RS, Lunte SM. Electrophoresis. 2001;22:242–248. doi: 10.1002/1522-2683(200101)22:2<242::AID-ELPS242>3.0.CO;2-W. [DOI] [PubMed] [Google Scholar]
- 22.O’Mahony AM, Windmiller JR, Samek IA, Bandodkar AJ, Wang J. Electrochem Commun. 2012;23:52–55. [Google Scholar]
- 23.Martin RS, Gawron AJ, Lunte SM, Henry CS. Anal Chem. 2000;72:3196–3202. doi: 10.1021/ac000160t. [DOI] [PubMed] [Google Scholar]
- 24.Pai RS, Walsh KM, Crain MM, Roussel TJ, Jackson DJ, Baldwin RP, Keynton RS, Naber JF. Anal Chem. 2009;81:4762–4769. doi: 10.1021/ac9002529. [DOI] [PubMed] [Google Scholar]
- 25.Adams RN. Anal Chem. 1958;30:1576–1576. [Google Scholar]
- 26.Rossier JS, Schwarz A, Reymond F, Ferrigno R, Bianchi F, Girault HH. ELECTROPHORESIS. 1999;20:727–731. doi: 10.1002/(SICI)1522-2683(19990101)20:4/5<727::AID-ELPS727>3.0.CO;2-A. [DOI] [PubMed] [Google Scholar]
- 27.Shiddiky MA, Won MS, Shim YB. Electrophoresis. 2006;27:4545–4554. doi: 10.1002/elps.200600240. [DOI] [PubMed] [Google Scholar]
- 28.Oshea TJ, Lunte SM. Anal Chem. 1994;66:307–311. [Google Scholar]
- 29.Svancara I, Vytras K, Kalcher K, Walcarius A, Wang J. Electroanalysis. 2009;21:7–28. [Google Scholar]
- 30.Li XC, Chen ZG, Zhong YW, Yang F, Pan JB, Liang YJ. Anal Chim Acta. 2012;710:118–124. doi: 10.1016/j.aca.2011.10.035. [DOI] [PubMed] [Google Scholar]
- 31.Mikysek T, Svancara I, Kalcher K, Bartos M, Vytras K, Ludvik J. Anal Chem. 2009;81:6327–6333. doi: 10.1021/ac9004937. [DOI] [PubMed] [Google Scholar]
- 32.Kalcher K, Kauffmann JM, Wang J, Svancara I, Vytras K, Neuhold C, Yang Z. Electroanalysis. 1995;7:5–22. [Google Scholar]
- 33.Wang J, Pumera M, Prakash Chatrathi M, Rodriguez A, Spillman S, Martin RS, Lunte SM. Electroanalysis. 2002;14:1251–1255. [Google Scholar]
- 34.Martin RS, Gawron AJ, Fogarty BA, Regan FB, Dempsey E, Lunte SM. Analyst. 2001;126:277–280. doi: 10.1039/b009827m. [DOI] [PubMed] [Google Scholar]
- 35.Sameenoi Y, Mensack MM, Boonsong K, Ewing R, Dungchai W, Chailapakul O, Cropek DM, Henry CS. Analyst. 2011;136:3177–3184. doi: 10.1039/c1an15335h. [DOI] [PubMed] [Google Scholar]
- 36.Johnson AS, Selimovic A, Martin RS. Electrophoresis. 2011;32:3121–3128. doi: 10.1002/elps.201100433. [DOI] [PMC free article] [PubMed] [Google Scholar]
- 37.Dai H, Wu X, Wang Y, Zhou W, Chen G. Electrochim Acta. 2008;53:5113–5117. [Google Scholar]
- 38.Dai H, Xu H, Lin Y, Wu X, Chen G. Electrochem Commun. 2009;11:343–346. [Google Scholar]
- 39.Dai H, Lin Y, Xu H, Yang C, Chen G. Analyst. 2010;135:2913–2917. doi: 10.1039/c0an00485e. [DOI] [PubMed] [Google Scholar]
- 40.Gunasekara DB, Hulvey MK, Lunte SM, da Silva JAF. Anal Bioanal Chem. 2012;403:2377–2384. doi: 10.1007/s00216-012-5810-4. [DOI] [PMC free article] [PubMed] [Google Scholar]
- 41.Cellar NA, Kennedy RT. Lab on a Chip. 2006;6:1205–1212. doi: 10.1039/b603561b. [DOI] [PubMed] [Google Scholar]
- 42.Kissinger PT, Heineman WR. In: Laboratory Techniques in Electroanalytical Chemistry. Kissinger PT, Heineman WR, editors. Marcel Dekker, INC; New York, New York: 1996. pp. 84–93. [Google Scholar]
Associated Data
This section collects any data citations, data availability statements, or supplementary materials included in this article.


